Long
Long
 Long
Long
 Long
Long
 Long
Long
 Long
Long
SAP Approaches a Key Weekly Support Area Worth WatchingSAP remains a core European enterprise software name, with its AI-driven cloud transition back in focus.
Technically, price has arrived at a level I’ve been waiting for for quite some time.
The strongest area on the current chart for a mid- to long-term investor to keep an eye on sits roughly between €180 and €206.
Why is this zone so important?
Because multiple technical criteria align in this area in a clean and compact way.
Criteria inside the highlighted box:
1. Channel projections — both larger and smaller structures.
2. Equal waves.
3. Fibonacci retracement (38.2%) — in strong long-term trends, these levels often act as key reaction zones.
4. Round number €200 — psychological levels matter, especially for long-term positioning.
5. Previous highs — the pause in early 2024 now starts to offer liquidity that can act as support.
6. Weekly EMA 200 — last, but definitely not least.
From a purely technical perspective, initiating a mid- to long-term position from this zone would not be a mistake. This clears the first filter — technical structure.
From here, fundamentals and your own thesis should take over.
My role is to make sure you don’t make technical mistakes , and at current levels,you don't.
If this was helpful, feel free to hit the LIKE / Boost button.
See you soon.
Cheers,
Vaido Valneva: Between Correction and Long-Term PotentialXETR:AYJ Hey guys,
I started analyzing Valneva around mid-October 2025 after the company was brought to my attention by a friend. I find it to be a very interesting company and chart. There aren't many ideas or analysis to find on TradingView so I figured I try to make my own. I focused on understanding the price structure and the broader technical context.
From a technical perspective, the stock had already put in a significant bottom below 2 EUR, around 1.75 EUR, in December 2024. From that low, price advanced strongly up to roughly 4.20 EUR.
My analysis is purely chart-based and primarily relies on Fibonacci structures. On the initial 0–A move from approximately 1.75 EUR to 4.20 EUR, I applied a Fibonacci retracement. Price corrected into the projected retracement zone (light blue), overshot at around 10% max. into a lower area. Importantly, price eventually broke above point A, confirming a valid B–C continuation and the start of a sequence.
Following that, I analyzed a larger 0–A structure (green), whose Fibonacci retracement levels are located a bit higher. This broader corrective zone starts roughly around 3.50 EUR (0.5 Fib) and extends to just below 3.00 EUR (0.667 Fib), overlapping with the upper area of the previous correction zone (0.5 Fib light blue). After the price had already tested the 0.5 retracement once in early September and rallied from there, I waited for a second approach. I placed a first limit order in mid November, which was filled in exactly one month later as price moved back into the green corrective zone.
However, I do not assume that the correction is necessarily complete. From my point of view, further downside remains possible. Price could revisit the light-blue corrective area, meaning a deeper overshoot below the green retracement zone. A move not only below 3.00 EUR, but potentially toward 2.80 EUR or even 2.70 EUR cannot be ruled out. I am prepared for such a scenario and would view it as an opportunity rather than a problem.
On the upside, my moderate targets start at around 6.20 EUR and higher, based on the projected extension levels shown in light blue. In a more extended scenario, the broader sequence in green theoretically allows for moves toward the 9–10 EUR area if the higher-level structure plays out.
From a fundamental and news-driven perspective I guess, 2025 has been mixed so far. The company reported negative developments related to the Chikungunya vaccine, which has effectively been put on hold in the U.S.. Additionally, forecasts were revised downward, which clearly impacted price action and led to a second test of the green corrective zone. After the first test in early September, price has now entered this area again in recent days.
Looking ahead, I would not be surprised to see further weakness around or ahead of the Q4 2025 results, as guidance has already been adjusted lower. This could add additional downside pressure independent of the broader technical structure. However since the beginning of 2025 the price is still up more than 75%.
That said, the key long-term catalyst remains the Phase 3 data for VLA15, the Lyme disease vaccine candidate. Phase 1 and Phase 2 results have been very encouraging. If Phase 3 data also turns out positive, this could represent a major inflection point for the company. In that case, current price levels would likely become irrelevant in hindsight.
Price levels seen during the COVID period above 20 EUR are, at this stage, speculative and should be viewed as long-term upside, or to the moon if you will, scenarios rather than basic cases. For now, my focus remains on the current structure: managing entries within the corrective zones, expecting deeper Fibonacci retracement levels such as 0.559, 0.618, 0.667 or lower if reached, and reassessing once meaningful clinical data is released.
I am positioned, prepared for volatility, and willing to add on further weakness. If the upcoming data is positive, I expect a structural trend shift with significantly higher price levels over time. Let's see what happens.
I'd very much like to here your opinions and potential suggestions for improvements :)  Long
Long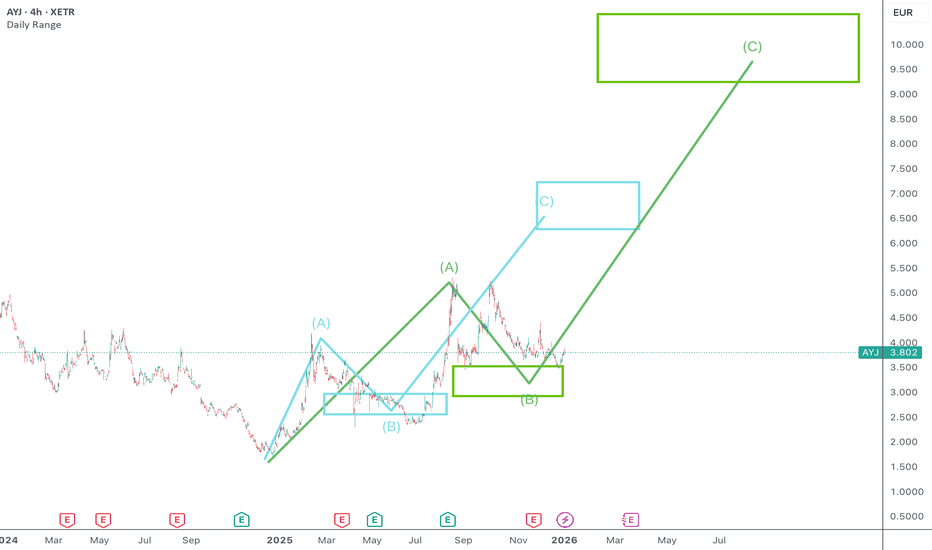
 Long
Long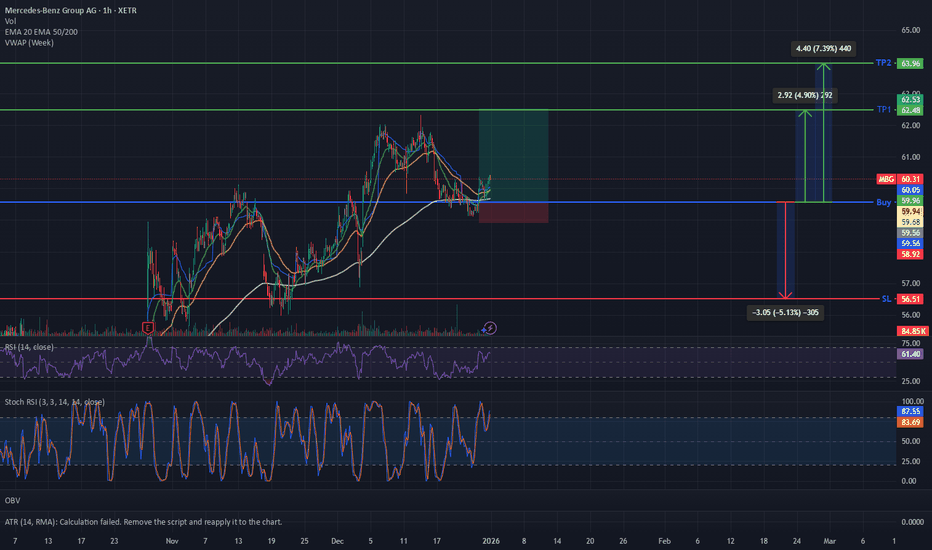
Allianz: Strong Structural Tailwinds with a Disciplined TechnicaInsurance companies currently benefit from multiple structural tailwinds, positioning them favorably relative to banks and other financials. Rate cuts support equity valuations and enhance the appeal of dividend-paying stocks, allowing insurers such as Allianz to shine further in a yield-seeking environment. Unlike banks, insurers are not exposed to direct credit risk, making them more resilient during economic downturns, particularly amid growing concerns around loan quality and the so-called “cockroach theory” in banking, where the discovery of one bad loan raises fears of many more.
Insurance companies also offer highly predictable shareholder returns, underpinned by stable premium income, disciplined underwriting, and long-duration liabilities. This predictability supports consistent dividends and share buybacks. A key additional tailwind is their large bond portfolios, which benefit from reinvestment at higher yields over time and contribute to steadily rising investment income. Allianz, in particular, stands out as one of the largest bondholders in Europe, giving it exceptional leverage to this structural dynamic.
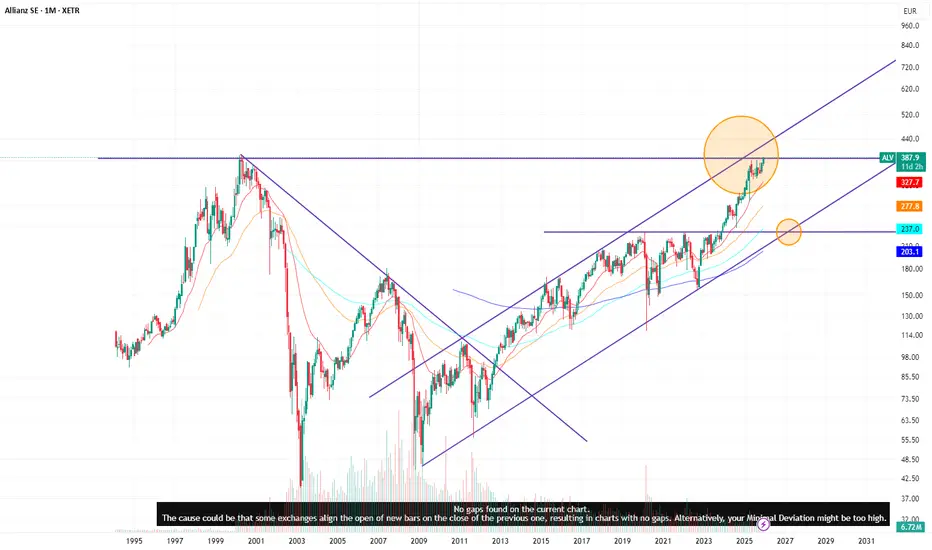
From a technical perspective, Allianz has been trading within a well-defined upward channel and has recently approached a confluence of resistance. Based on this structure, a pullback toward a confluence of support, projected around March, would be a technically constructive retest rather than a sign of weakness.
Personally, assuming broader conditions remain stable, I intend to initiate a position on such a retracement, once technical confirmation aligns with the already compelling fundamental backdrop. Fundamentally, the stock appears strong; the strategy is therefore to combine fundamental conviction with disciplined technical execution.  Long
Long
 Long
Long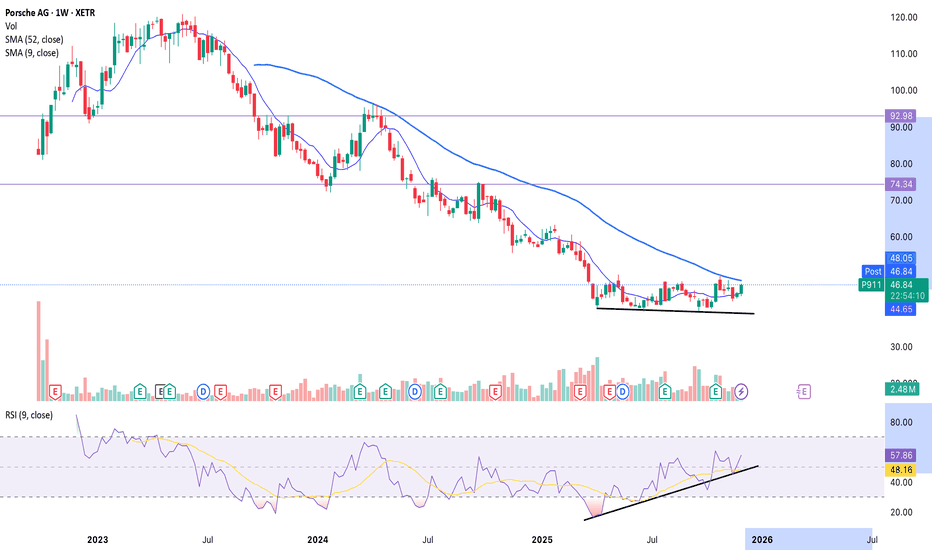
 Long
Long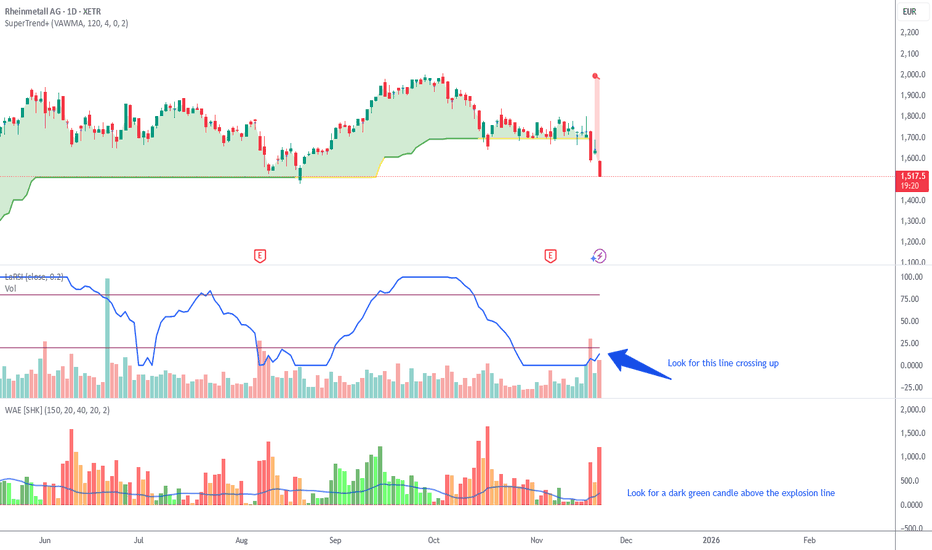
 Long
Long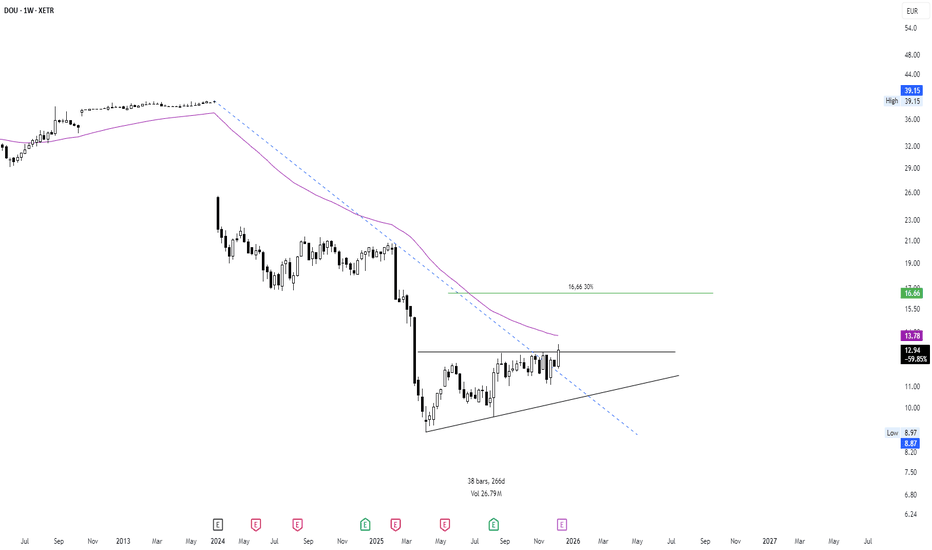
 Long
Long
 Long
Long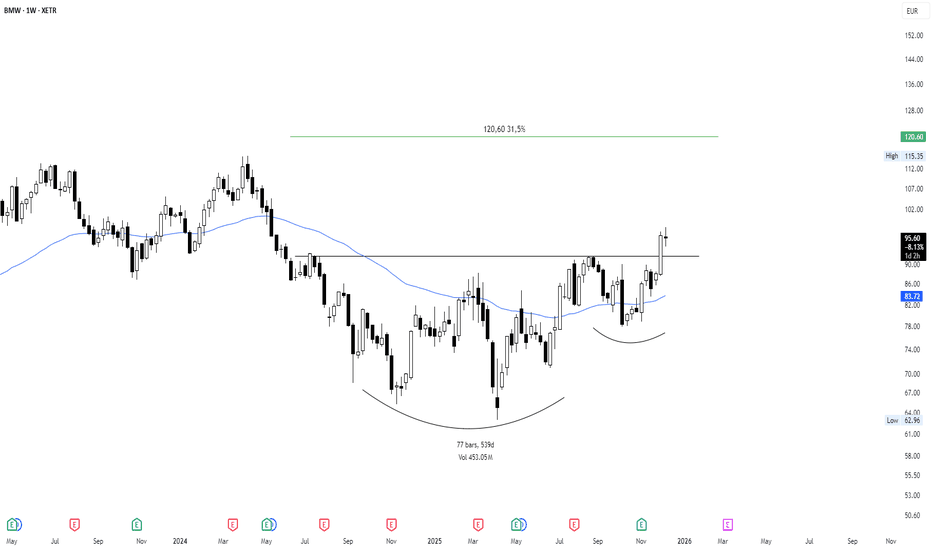
Long 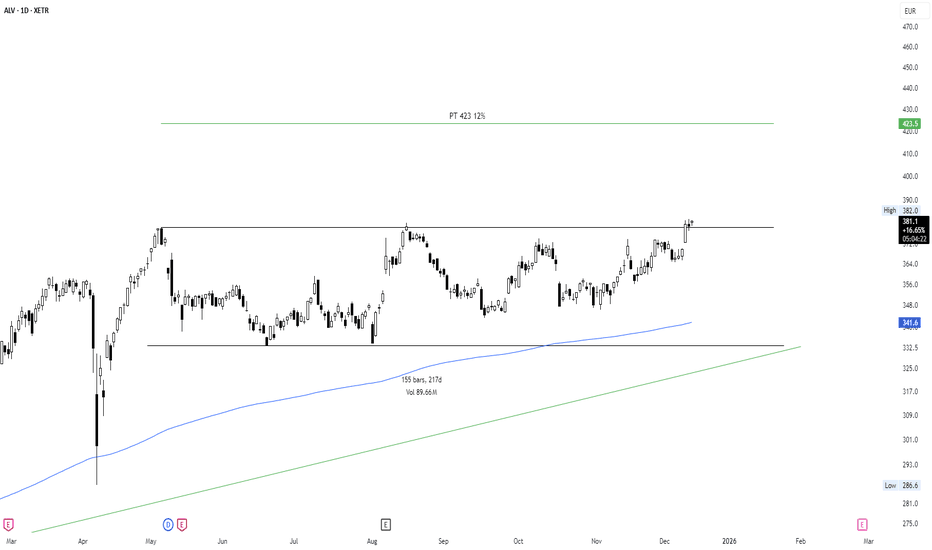
 Long
Long
Mercedes‑Benz Group AG📄 Key Fundamentals for Mercedes‑Benz Group AG
Here are some of the most relevant recent valuation and financial metrics for Mercedes‑Benz.
Metric / Indicator Latest / Reported Value*
EPS (TTM) € 6.48 per share
justETF
+2
GuruFocus
+2
P/E (Trailing 12 mo) ~ 9–9.5× (various sources: 8.9×, 9.3×, 9.5×)
Wisesheets
+3
Yahoo Finance
+3
GuruFocus
+3
Forward P/E ≈ 9.1× (2025/2026 estimates)
GuruFocus
+1
PEG ratio (based on 5‑yr EBITDA growth) ~ 0.63–0.66
GuruFocus
+1
Dividend yield (TTM / recent) Estimates around ~ 7% for 2025
Wisesheets
+1
2024 Net Income (full year) ~ € 10,207 million (Net Income) & EPS 6.48 €
justETF
+1
2024 Revenue ~ € 145,594 million (≈ €145.6 bn)
justETF
+1
* “TTM” = trailing twelve months. Figures come from a mix of recent financial‑data sources for 2024–2025.
What these numbers suggest:
A P/E around 9–9.5x is relatively low, especially compared to many global automakers or growth companies — this could imply the stock is modestly valued or undervalued (assuming stable earnings).
PEG < 1 (around 0.63–0.66) suggests that, relative to its growth potential (5‑year EBITDA growth), the valuation might be attractive.
A dividend yield near ~7% (depending on payout policy and share price) is relatively generous, making the stock potentially interesting for income‑oriented investors.
Caveats / Risks:
The forward P/E suggests modest expected earnings growth (or at least modest investor optimism relative to current price).
The auto industry is cyclical and subject to macroeconomic pressures: demand, raw‑material costs, competition, regulatory shifts (especially around EVs), etc.
Past performance (2024 earnings, 2025 interim results) may not guarantee similar performance ahead, especially in a rapidly evolving auto market.
📈 Technical Analysis (Based on Your Chart + General Context)
From the chart and common technical indicators (trend lines, Fibonacci zones, support/resistance, oscillators, etc.):
The price appears to have undergone a significant uptrend (from lows ~ €20s/€30s up to high near ~€90 in earlier years), followed by a prolonged retracement / consolidation phase.
Currently, the stock seems to be trading around €60–62, which may correspond to a mid‑range level (not near the highs, but above recent lows) — potentially forming a base or accumulation zone.
The presence of a Fibonacci retracement overlay suggests investors are watching certain retracement levels (e.g., 38.2%, 50%, 61.8%) as potential support/resistance zones.
Momentum indicators — from what can be seen — may show some recovery, but given the long-term volatility, it’s hard to assert a strong bullish reversal without confirmation (breakout, volume increase, improved fundamentals, etc.).
The recent bounce from lower levels may reflect recovery optimism (e.g., better earnings outlook, stabilization of macro conditions, or company-specific developments).
Possible near‑term technical scenarios:
If price holds above current support (~ €55–60) and breaks above recent resistance (~ €62–65), we might see a rally toward higher resistance zones (possibly retesting higher Fibonacci retracement levels).
If price fails to sustain support, there could be a re‑test of lower levels, potentially toward prior consolidation lows (depending on broader market conditions).
🧮 Combined Fundamental + Technical View (Neutral‑to‑Moderately Positive)
Considering the modest P/E, low PEG, and attractive dividend yield, the fundamental valuation of Mercedes‑Benz appears reasonably attractive, especially if the company can maintain earnings and manage industry headwinds well.
On the technical side, the stock seems to be in a consolidation or base‑building phase, which — if combined with favorable fundamental developments — could set the stage for a more sustained uptrend or value recovery.
Given the cyclical nature of auto demand and external risks (global economy, competition, EV transition, regulation), the path may be choppy — but Mercedes‑Benz seems reasonably positioned compared to many peers.
✅ What to Watch / Key Catalysts
Earnings announcements & guidance, especially as global auto markets face challenges (macroeconomics, interest rates, consumer demand).
Automotive industry trends: demand for electric vehicles (EVs), regulation (EU emissions, tariffs), supply‑chain costs, raw materials.
Company’s operational execution: cost management, efficiency, new model launches, EV strategy, global sales exposure (e.g., China, U.S., Europe).
Macro environment: economic growth in key markets, currency fluctuations, inflation/interest‑rate environment, global trade conditions.
Technical confirmation: breakout from consolidation, volume trends, support/resistance tests.
This is not financial advice — only data analysis. Please consult a qualified financial professional for personalized guidance. Long 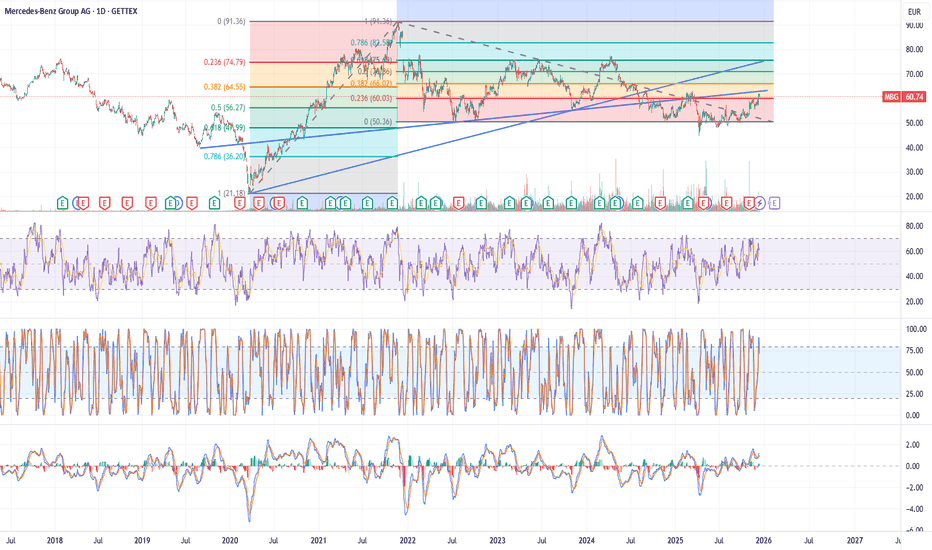
E.ON SE — Technical + Fundamental AnalysisFundamental Overview & Recent Performance
E.ON is a major European energy company: it focuses on energy distribution networks, infrastructure (grids), energy sales, and increasingly on sustainable energy solutions.
GlobalData
+2
eon.com
+2
As of 2025, the company’s market capitalization is roughly €40–48 billion (depending on exchange rate/report) which places it among the larger utilities in Europe.
Companies Market Cap
+2
eon.com
+2
For 2025 the company reaffirmed its guidance: the adjusted EBITDA target is €9.6–9.8 billion, and adjusted net income target is €2.85–3.05 billion.
Investing.com
+2
Quartr
+2
In the first 9 months of 2025, adjusted EBITDA was €7.4 billion (up ~10% YoY) and adjusted net income rose by ~4% to €2.3 billion.
SolarQuarter
+2
Ad Hoc News
+2
Investment plans remain strong. From 2024–2028, E.ON expects to invest around €43 billion, with a large portion (€35 bn) going into its Energy Networks business.
eon.com
+2
eon.com
+2
The company’s dividend history shows a steady increase in annual dividend: for 2025 the dividend is €0.55 per share — last years were €0.53 (2024), €0.51 (2023), etc. Dividend yield is around 3.5%–4%, depending on price.
StockAnalysis
+1
➡️ Interpretation (Fundamental Strengths):
E.ON appears financially healthy: increasing EBITDA and net income, stable dividend policy, and large ongoing investments — especially in grid infrastructure and energy transition.
Its focus on networks/infrastructure (rather than riskier commodity‑based energy retail) provides more stable cash-flows.
GlobalData
+2
Quartr
+2
Given Europe’s push for energy transition, upgrades to power grids, decarbonization, and electrification, E.ON’s investment‑heavy strategy might position it well for long‑term structural demand in energy infrastructure.
⚠️ Risks / Considerations:
The valuation and net debt evolution remain a key watch: increasing investments and debt must be managed carefully.
Seeking Alpha
+1
Regulatory risk — as a grid operator, returns often depend on regulation of tariffs, allowed returns, and energy policies in Germany and Europe. Changes in regulation could impact profitability.
📊 Technical Picture (Based on Your Chart + Indicators)
From your chart (daily timeframe):
The stock had a strong upward trend from mid-2022 to early‑2025, and more recently it seems to be in consolidation / range-bound around €10–11 (though your chart shows 10.76 — possibly older or another listing).
Momentum indicators:
RSI (14) is ~63–64 → not yet overbought but approaching higher zone.
Stochastic RSI is in overbought zone (K ~82, D ~86) → possible short-term overbought conditions, risk of a pullback or consolidation soon.
MACD shows a recent crossover — histogram slightly positive — but the move seems weak / indecisive.
From chart annotations you have “RsiLE” and “RsiSE” signals (buy/long entries vs exit/short entries) — recent signals seem to lean toward “long entry” (RsiLE), which suggests some bullish bias in the short/medium term.
➡️ Technical outlook: The setup suggests that the stock may be forming a base or consolidation. If it breaks out above resistance (depending on your defined resistance, perhaps near prior swing highs), there may be room for a move higher. But with oscillators somewhat stretched, a short‑term pullback or sideways action is also quite possible before a decisive breakout.
Possible scenarios:
Bullish breakout: Price breaks out of consolidation, riding on positive fundamentals + market sentiment → potential move to prior resistance zones (depending on timeframe, could be higher).
Sideways / consolidation: Price remains in range until clearer catalyst (earnings, regulatory news, broader energy/commodity sentiment) emerges.
Short-term correction: Given overbought Stochastic‑RSI, a minor pullback (or test of support) could occur before resuming upward move.
🧮 Combined View & What to Watch
Strengths (Fundamental) Technical Signals / Cautions
Strong 2025 earnings growth (EBITDA & Net Income increasing)
SolarQuarter
+1
Overbought in Stochastic‑RSI — risk of short-term pullback
Substantial capex and investment plans for energy networks & infrastructure (long-term structural play)
eon.com
+2
eon.com
+2
Recent chart shows consolidation — trend not clearly upward yet
Stable dividend history, decent yield ~3–4%
StockAnalysis
+1
Momentum (MACD) is weak — needs stronger confirmation for upmove
Operating in essential utility/energy infrastructure business — somewhat defensive Regulatory/policy risk: energy‑market & grid regulation in Europe must be watched
Key catalysts to watch for future direction:
Execution of E.ON’s investment program (especially grid upgrades, energy networks) and how that impacts future EBITDA and cash flows.
Regulatory developments regarding energy tariffs, grid rates, returns on infrastructure investment in Germany/Europe.
Macro developments: energy demand, European energy transition policies, inflation/interest‑rate environment (affecting CAPEX costs & financing).
Technical breakout or failure: if price breaks convincingly above consolidation range, or falls below key supports.
🧠 My View (Neutral-to-Cautiously Optimistic — Not a Recommendation)
Given the combination of solid fundamentals (earnings growth, capex/investment strategy, dividend) + reasonable technical setup (though with some overbought signals), E.ON SE appears as a company with long-term structural potential, particularly as Europe transitions toward greener, more robust energy infrastructure.
In the short-to-medium term, price action may be choppy: likely consolidation or mild pullbacks before a clearer breakout. But over a multi‑year horizon, the strong investment and essential‑services nature of the business provide a supportive backdrop.
This is not financial advice — only data analysis. Please consult a qualified financial professional for personalized guidance. Fluor Corporation (FLR) – Full Technical & Fundamental AnalysisI. Technical Analysis
The chart shows a combination of Fibonacci retracements, an ascending support trendline, a descending resistance trendline, MACD+RSI, and Stochastic RSI. Here is the complete breakdown:
🔍 1. Price Structure & Trend
✔️ Ascending Triangle / Rising Support
FLR has created a series of higher lows since the $26.70 bottom, forming a strong rising trendline.
Simultaneously, multiple lower highs form a descending resistance, creating a wedge-like consolidation.
➡️ This signals price compression — a breakout is coming.
🔍 2. Fibonacci Key Levels
Using the swing low $26.70 and swing high $49.64, important levels include:
0.382 → $40.87 (major resistance)
0.50 → $38.17 (current barrier zone)
0.618 → $35.21 (major support)
0.786 → $32.01 (deep support)
✔️ Current price is near $37.23
Price sits between 0.50 and 0.618, a typical reversal zone in strong trends.
🔍 3. Support & Resistance
Support Levels
$35.00–$35.20 (0.618 Fibonacci)
Ascending trendline
Below $35, next support is $32.
Resistance Levels
$38.17 – $40.87
Descending trendline
Above $44, final resistance is $49.64 (previous high)
📈 4. MACD+RSI Indicator
MACD is turning bullish, with the MACD line curving upward.
Histogram turning green.
Momentum begins shifting toward buyers.
This supports the possibility of a medium-term upward swing.
📉 5. Stochastic RSI
Currently rising toward the upper region (60–70).
Shows short-term bullish momentum.
Once above 90, a short-term pullback becomes possible.
⭐ 6. Technical Summary
Bullish Scenario
If FLR breaks above $38.17, targets are:
$40.87
$44.22
$49.64
Bearish Scenario
If FLR loses $35, price may fall to:
$32.01
A break below $32 invalidates the bullish structure.
Overall Technical Bias:
➡️ Neutral to Bullish, with confirmation needed above $38.17.
II. Fundamental Analysis
Here are the most recent reliable fundamental metrics available, including EPS and P/E as requested.
🧩 1. EPS & P/E (Latest Available)
Metric Value Interpretation
EPS (TTM) ≈ $18–$20 per share Extremely high relative to price, partly due to non-recurring gains
P/E Ratio (TTM) ≈ 2.3× Very low; signals undervaluation or temporarily inflated earnings
Forward P/E ≈ 19–20× Indicates expected normalization of earnings in coming quarters
👉 What this means
A very low P/E usually attracts value investors,
BUT the large gap between P/E (2.3×) and forward P/E (~20×) indicates that recent EPS includes one-time gains or unusually strong project profits.
Analysts expect more normal (lower) earnings going forward, which is why forward valuation is much higher.
📈 2. Revenue & Earnings Momentum
Fluor has reported:
Strong year-over-year revenue growth
Improving profitability after years of restructuring
Solid performance in infrastructure, LNG, chemicals, and government contracts
Backlog has been growing, indicating stable revenue visibility.
💰 3. Cash Flow & Balance Sheet
Operating cash flow has strengthened significantly.
Long-term debt levels have declined, improving leverage and financial stability.
Liquidity remains solid, supporting ongoing project execution.
⚙️ 4. Growth Catalysts
LNG megaprojects in the U.S. and Middle East
Government and defense contracts
CHIPS Act & clean energy construction
Mining & industrial expansion projects
Nuclear and carbon reduction infrastructure
These trends support strong multi-year demand for EPC services.
⚠️ 5. Key Risks
Project execution risk (cost overruns can impact earnings)
Highly cyclical industry
Backlog dependency on large, long-term contracts
Global economic slowdown could reduce project awards
⭐ III. Combined Technical + Fundamental Outlook
✔️ Technical signals trending bullish (MACD recovery, strong support at $35, bullish reversal zone).
✔️ Fundamentals improving, but EPS is inflated and future P/E is much higher.
🎯 Overall Outlook:
Bullish potential, but confirmation is needed above $38.17 for continuation toward $41 → $44 → $49.
Long-term investors should consider:
Strong fundamentals
Attractive low current P/E
But also forward valuation risk
Short-term traders should watch:
Trendline support
MACD confirmation
Stochastic RSI reaching overbought
⚠️ Disclaimer (as you requested):
This analysis reflects my personal view only. I take no responsibility for your buy or sell decisions.  Long
Long
Siemens AG (1D) – Full Technical Analysis + Fundamental Analysis🔍 1. Price Action & Trend Structure
✔️ Strong long-term uptrend inside a rising channel
Siemens has been moving within a well-defined ascending channel for several years.
The price consistently respects both the upper resistance line and the lower support line of this channel.
Every pullback to the bottom of the channel has historically led to a new bullish wave.
✔️ Price currently near the upper-mid region of the channel
This suggests:
The trend is still healthy and bullish
But the stock is not at an ideal low-risk buy zone
Strongest buy opportunities typically occur near the channel’s lower boundary
✔️ Key support zone: ~138 €
This level, marked on the chart, acted as:
Major support during corrections
A psychological price floor
If the stock ever returns to this zone, it would be considered a high-value demand area.
🔍 2. MACD + RSI Combined Indicator
✔️ MACD is recovering from a recent bearish phase
The histogram is transitioning from negative toward zero → decreasing selling pressure
MACD and Signal lines are preparing for a possible bullish crossover
This usually indicates early momentum shift toward buyers
⚠️ However:
The momentum is not strongly bullish yet.
The MACD must cross above the Signal line with histogram turning positive for a confirmed buy signal.
➡️ We are currently in a transition phase, not a confirmed uptrend continuation.
🔍 3. Stochastic RSI (Stoch RSI)
✔️ Stoch RSI is near overbought levels (above 90)
This indicates:
A strong recent upward bounce
Potential for short-term pullback or consolidation
However, in strong long-term trends (like Siemens), Stoch RSI can stay overbought for extended periods without triggering a reversal.
✔️ Overall message from Stoch RSI:
Momentum is strong short term, but buying at this level carries increased risk of near-term correction.
🔍 4. Key Observations from RSI Strategy Buy/Sell Signals
The chart shows multiple automated RSI-based Buy (LE) and Sell (SE) signals.
Pattern:
Buy signals occur near channel support → extremely profitable historically
Sell signals occur near channel resistance → reliable for trimming or exiting
Right now:
Price is closer to the upper-middle zone, not near support
Therefore, no strong Buy signal is present
🔥 5. Bullish & Bearish Scenarios
Bullish Scenario (Primary Trend)
If price continues respecting the channel:
Next target: 240–250 € range
Break above 250 € → continuation toward 270–280 €, the projected top of the channel
This aligns with the stock’s strong long-term bullish structure.
Bearish Scenario (Less likely but important)
If momentum weakens and price breaks below the mid-channel line:
First support: 210 €
Major support: 138 € zone (historically very strong)
A break below 138 € would invalidate the rising channel, but this has a low probability given historical behavior.
⭐ Final Summary
Siemens remains in a strong multi-year uptrend inside a clean ascending channel.
MACD shows early signs of bullish momentum returning, but not confirmed yet.
Stoch RSI is overbought, signaling the possibility of a short-term pullback.
Price is not at the channel bottom, meaning risk is higher for new entries at current levels.
📌 Best buying opportunities historically occur at the channel’s lower boundary.
We are currently in the mid-to-upper area, which is not optimal for low-risk entry.
If you want, I can also provide:
✔ Entry/exit points
✔ Risk management plan
✔ Weekly & monthly timeframe confirmation
----------------------------------------------------------
Fundamental Analysis
🧾 1. Business & Structural Drivers
Siemens AG is a diversified industrial and technology group, with core businesses in:
Digital Industries (automation, industrial software)
Smart Infrastructure (building technologies, power distribution)
Mobility (rail and transportation solutions)
Management highlights electrification, transportation and industrial software as the main long-term growth drivers, with continued strong demand in these areas even while the automation environment has been more challenging.
Siemens
The company is also pushing its “ONE Tech Company” strategy – integrating hardware, software and services to lock in customers and grow recurring revenues.
Siemens
+1
📈 2. Recent Financial Performance
FY 2024 (year ended 30 Sept 2024)
Revenue: €75.9 billion, +3% year-on-year.
Net income: €9.0 billion – a record high at that time.
Free cash flow: €9.5 billion, described by management as “excellent”.
Siemens
+2
Siemens Press
+2
Demand remained strong in electrification, transport and industrial software, helping offset a tougher cycle in automation.
Siemens
FY 2025 (latest full year)
For fiscal 2025 (ended Sept 2025), Siemens extended this growth trend:
Q1 2025: revenue €18.4 bn (+3%); book-to-bill 1.09.
Siemens Press
Q2 2025: revenue €19.8 bn (+7%); orders up 10% to €21.6 bn; book-to-bill 1.10.
Siemens Press
Q4 2025: revenue €21.4 bn (+6% comparable); book-to-bill 1.02.
Siemens Press
+1
For the full fiscal 2025 year:
Net income: ~€10.4 billion, another all-time high (third year in a row).
EPS pre PPA: €12.95; excluding one-off gains, EPS pre PPA was ~€10.71 – in line with guidance (€10.40–11.00).
Siemens Press
+1
There was an earnings miss versus analyst expectations in Q4 2025 (EPS and revenue came in slightly below forecasts, which caused a short-term share price drop), but underlying growth remained solid.
Investing.com
Outlook
For fiscal 2026, Siemens guides for:
Comparable revenue growth: 6–8%
Book-to-bill: >1
EPS pre PPA: €10.40–11.00 (excluding special items).
Siemens
This shows management still expects profitable growth despite macro uncertainty and FX headwinds.
💰 3. Balance Sheet, Cash & Dividend
Free cash flow: around €9.5 bn in FY 2024 (and similarly strong in 2025), giving the company a lot of flexibility for dividends, buybacks and investment.
Siemens Press
+1
Net debt: Total net debt around €34.8 bn, but industrial net debt only about €7.9 bn, down ~27% vs 2022, with a solid liquidity position.
Creditreform Rating
Dividend: Proposed/paid dividend of €5.20 per share, with a yield roughly in the 2–3% range and a payout ratio around 40–45%.
Siemens Press
+2
Siemens
+2
Rating agencies and independent analysts generally view Siemens’ balance sheet as strong and conservative, which supports continued investment and shareholder returns.
Siemens
+1
📊 4. Valuation
Recent data show:
Trailing P/E: around 23–24x earnings.
Wisesheets
Forward estimates (2026–2027) imply a P/E in the low-20s and a dividend yield around 2.4–2.6%.
MarketScreener
Profit margin around 12% and decent returns on equity and invested capital compared with peers.
Yahoo Finance
+1
So the stock is not cheap, but for a high-quality, diversified industrial with strong cash generation and structural growth themes, the valuation is in a reasonable premium range rather than “bubble” territory.
⚙️ 5. Key Fundamental Positives
Structural tailwinds in electrification, grid upgrades, automation, digitalization and rail transport.
Siemens
+1
Consistent revenue and order growth with book-to-bill >1, showing a healthy pipeline.
Siemens Press
+2
Siemens Press
+2
Excellent free cash flow and disciplined capital allocation (dividends, buybacks, targeted acquisitions).
Siemens Press
+1
Strong balance sheet with manageable industrial net debt and solid credit ratings.
Creditreform Rating
+1
⚠️ 6. Main Risks & Caveats
Cyclical exposure: Parts of the business (especially automation) are sensitive to global industrial cycles and capex spending.
Siemens
Execution & portfolio risk: Strategy depends on integrating software, services and hardware; missteps in large projects (Mobility, infrastructure) or M&A could pressure margins.
FX and macro headwinds: Management already cites currency effects as a drag on EPS for 2026.
Siemens
Valuation risk: With a P/E in the 20s, any disappointment (like the recent Q4 2025 earnings miss) can trigger sharp short-term drawdowns.
Investing.com
+1
🧩 7. How This Fits Your Technical View
Technical picture: clear long-term uptrend in a rising channel, but currently not at the lower boundary (not a “deep value” technical entry).
Fundamentals: confirm Siemens as a high-quality, cash-generative company with solid growth guidance and a shareholder-friendly capital allocation policy.
So from a combined technical + fundamental perspective:
Long-term investors might see Siemens as a strong compounder but may prefer to buy on pullbacks toward the lower part of the channel to improve risk/reward.
Short- to medium-term traders should still respect the overbought readings and channel resistance, even though the underlying business is fundamentally strong.
⚠️ Disclaimer (as you requested)
This fundamental and technical analysis reflects only my personal view based on publicly available information. I take no responsibility for any of your buy or sell decisions.
 Long
Long