• Products
  • Community
  • Markets
  • Brokers
  • More
Get started
  • Markets
  • /Germany
  • /Stocks
  • /Ideas
Powerhouse Energy Group PLC Breakout in the next 6 Weeks Powerhouse Energy Group PLC at the Market Tradegate. Hello friends, I have found a top position here. Trade without risk x1, return 5500-6000% within the next 12-16 months. This starts with the current weekly closing, or shortly before. Potential is gigantic, but 100% realistic. When the red line is reached, another short opportunity arises.
BLong
by WhaleWaveSurfer
Tesla Fibonacci and RSI divergence target 187 euro in 2 daysBased on Fibonacci and RSI divergence 1H chart, i expect a LONG target price 187 Euro in 2 days
GETTEX:TL0Long
by MariusDroppert
Tesla RSI Divergence Day-chart is greenHello Traders, Based on Fibonacci and RSI divergence Day chart, i expect a LONG target price between 260 and 216 Dollar.
GETTEX:TL0Long
by MariusDroppert
Updated
1
DHER Bull Market Price Prediction DHER Bull Market Price Prediction t180 XETR:DHER
XETR:DHER
by Sandro-Chart
Updated
2
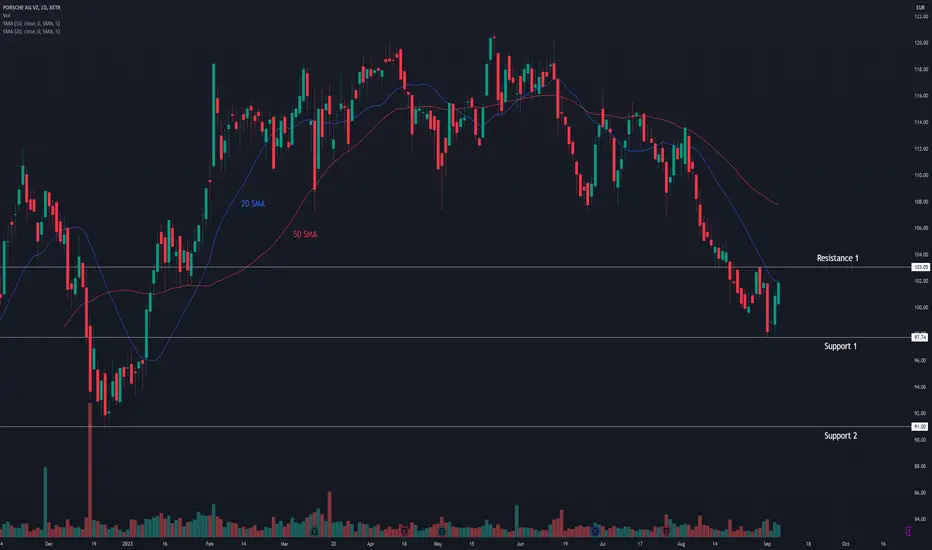
One luxury carmarker is down 20%, a buying opportunity?Although founded in 1948, Porsche became a public company in late September 2022. Initially, the company started to float on the market with an opening price of €84. However, shares rose as high as €120.80 in the coming months. Yet despite these impressive gains since the IPO, shares of the company began to decline in May 2023, losing about 20% of their value through the summer. In its recent financial report, Porsche AG Group revealed that its operating profit rose 10.7% YoY and sales revenue
XETR:P911Long
by Tradersweekly
Updated
6
Siemens Energy: Flag patternHigh Tight Flag for Siemens Energy: This serves as a strong entry signal for a long position. The target is positioned at the yellow resistance area. TP (Take Profit): 15.500 SL (Stop Loss): 12.730 (flag high)
XETR:ENRLong
by 03.freeman
1
VOLKWAGEN moving up towards $126 in new impulse up.The stock displayed an impulsive rise between Oct-Dec 2023 and a subsequent correction of the same through the months of dec-jan. The correction was almost an 61.8% retracement of the impulse and the price shot up quite strongly as soon as the corrective wave was over. Now the stock is already in wave 3 structure and with sub-divisions or without them $126 is the projected target zone for the stock.
XETR:VOW3Long
by neeraj_2_sharma
KWS SAAT SE & CO. KGAA - Long opportunityAccording to the Elliott Wave Theory, KWS is currently showing potential for a rally, coinciding with the beginning of a new long-term impulse. Since September 2018, KWS has been undergoing a correction, graphically represented by the drawn ABC. The C wave is not yet complete, but the final 5th wave is underway and forming a wedge pattern. Its completion could coincide with the breaking of the wedge. In this case, it would signal the end of wave 5 < wave C and the beginning of wave 1 < wave 1 of
XETR:KWSLong
by MDP_LV
Updated
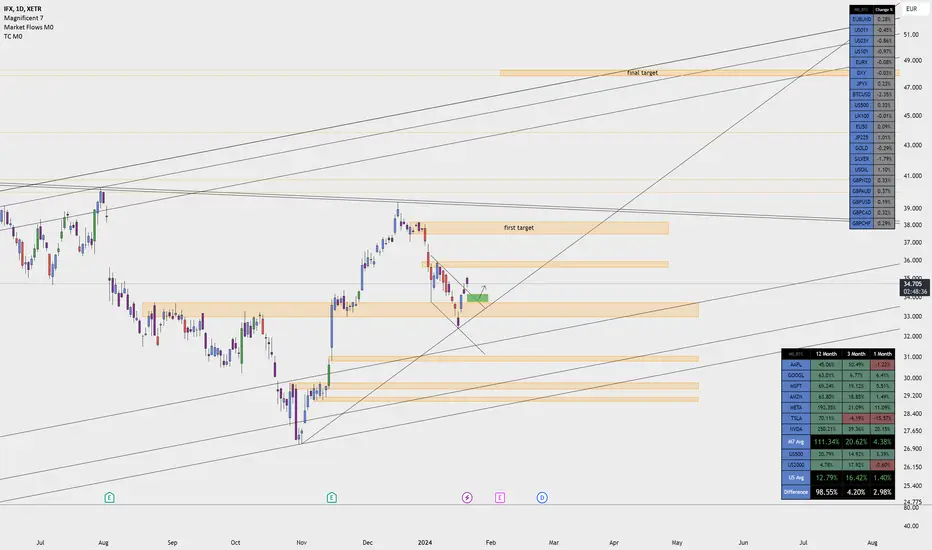
IFX: Potential BuyBreaking above the descending channel after a fakeout. Areas marked to look out for. Buy backed with positive analyst expectations.
XETR:IFXLong
by M0_BTC
MTX Simple Breakout2 days ago we have exceeded the bottom dd 18th August which is a support now. Nothing else to say. The principle is KISS here.
XETR:MTXLong
by motleifaul
Updated
VOW - Volkswagen - Long position BUY and HOLDDear all, Not bad idea start open long positions in VOW, close to 100$ is a very good level for buying. It is a position with a potential 50% return, but it is for medium long term so buy and hold.
XETR:VOWLong
by FITINTRADE
Top shoe stocks ...Top shoe stocks performance ... from the most popular brands ...
XETR:ADS
by JoaoPauloPires
BAYN: Potential BuyRetesting the channel price recently broke out of, this represents a possible buy opportunity backed with a recent insider buying activity. First target right after the gap where you could take partials, then 48 EUR. If you believe in the company why not hold to ATH.
XETR:BAYNLong
by M0_BTC
hdfcbank adr trend dear all this id hdfc bank adr weekly chart pattern so keep watch , today secound day hdfc bank gives more pain so i think pain continus and price may give more down so keep hold short position and cut and buy position as per chart zone marking in chart. more pain pending
GETTEX:HDFAShort
by deepakgupta20278
BAYN Entry ZoneBayer has reached a Fibonacci entry zone after yesterday's fall. There is a window to be closed that has been opened at the fall on November 20th.
XETR:BAYNLong
by motleifaul
Updated
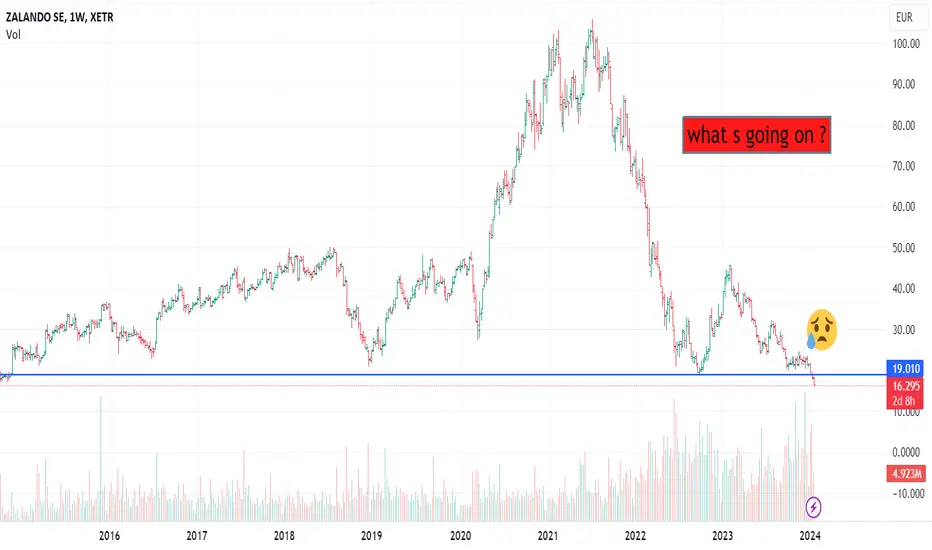
ZALANDO on fireJust wondering what s going on here. This stock has broken a very impressive support of long term. Is there any chance to go short on it?
XETR:ZAL
by Malcolm-Luter
#ADS • adidas AG • XETRA LONG TF H1#ADS • adidas AG • XETRA LONG TF H1, TP = 181.62 , SL = 169.64 The trend continues, the nearest support level according to my calculations TP = 181.62
XETR:ADSLong
by MagyarPenztarca
Updated
Siemens Healthineers: Not yet done ☝️Siemens Healthineers took a step south at the beginning of the year, but has since almost made up for this setback on the upside. Nevertheless, we have drawn up a new alternative scenario with a 30% probability on the chart, according to which the current rise would already be completed with the last high in the form of the magenta-colored wave alt.(X). Accordingly, the price would fall below the support level of €45.51 earlier and consequently into our turquoise-colored Target Zone between €40.
XETR:SHL
by HKCM_Global
Novo Nordisk failed new ATH but still bullishNovo failed yesterday to achieve a new all time high and dropped Now bouncing on support 96,5 I think will going to break upside reasistance soon
TRADEGATE:NOVLong
by balinor
PG&E corp is in for an ELECTRIC RIDE UPWARDSPG&E isn't going anywhere, California is helplessly dependent on it. they are investing in their infrastructure (after its horrendous wildfire fiasco due to infrastructure negligence). This situation lead to a tremendous sell-off because it seemed like a risky company to hold stocks for and overall the company was just hated throughout California after the fires. I think that very soon the stock price is set for a very aggressive bounce back to its past high value levels
TRADEGATE:PCGLong
by camilotapia75
GAP is ready for a series of PRICE GROWTH!GAP is registering significant net positive volume this past few weeks -- in anticipation of the company's turnaround story in terms of bottomline which it did after the company posted a surprise profit due to business re-organization after last Month's earnings result. The stock is sitting at a strong solid support at 8-9 area -- a 1.0 FIB level area where buyers converge. Expect price to bounce from this range. Weekly histogram has created higher lows conveying incoming reversal to the upsid
XETR:GAPLong
by JSAL
Updated
Deutsche Bank Shares: Riding the Bull with a Diamond SparkleTechnical Analysis for Deutsche Bank Shares: 1. Bullish Diamond Fractal Formation: Deutsche Bank shares are currently exhibiting a notable technical pattern known as a Bullish Diamond Fractal. This pattern suggests a potential reversal in the prevailing downtrend, indicating a shift in market sentiment in favor of the bulls. 2. Key Levels and Targets: First Take Profit (TP): The analysis points to a conservative first take profit level at 15,500. This level is identified as a potential r
XETR:DBKLong
by wikitrades
Alignment of the Stars (AOTS)When the moving averages aligned its a longterm bullish.
TRADEGATE:SIELong
by Enigma_MBO
1
Unveiling Potential Opportunities in $TUI1 Stock - LONGUnveiling Potential Opportunities in XETR:TUI1 Stock: Navigating the Surge and Identifying Profit Targets In the wake of recent developments surrounding Tui, Europe's largest package holiday operator, the decision to potentially shift its stock exchange listing from the FTSE 250 to Frankfurt has stirred considerable interest in the financial landscape. This move not only impacts Tui's positioning but also raises questions about London's standing as a global finance center. Analyzing the Buz
XETR:TUI1Long
by wikitrades
123456789101112131415161718192021222324252627282930313233343536373839404142
…999

Made by humans

Select market data provided by ICE Data Services. Select reference data provided by FactSet. Copyright © 2026 FactSet Research Systems Inc.Copyright © 2026, American Bankers Association. CUSIP Database provided by FactSet Research Systems Inc. All rights reserved. SEC filings and other documents provided by Quartr.© 2026 TradingView, Inc.

SOC 2 CompliantGDPR Compliant
More than a product
  • Supercharts
Screeners
  • Stocks
  • ETFs
  • Bonds
  • Crypto coins
  • CEX pairs
  • DEX pairs
  • Pine
Heatmaps
  • Stocks
  • ETFs
  • Crypto coins
Calendars
  • Economic
  • Earnings
  • Dividends
  • IPOs
More products
  • News Flow
  • Portfolios
  • Fundamental Graphs
  • Yield Curves
  • Options
  • Macro Maps
  • Pine Script®
  • MCP Server
Apps
  • Mobile
  • Desktop
Community
  • Social network
  • Wall of Love
  • Refer a friend
  • Creator program
  • House Rules
  • Moderators
Ideas
  • Trading
  • Education
  • Editors' picks
Pine Script
  • Indicators & strategies
  • Wizards
  • Freelancers
  • Marketplace
Tools & subscriptions
  • Features
  • Pricing
  • Market data
  • Gift plans
Trading
  • Overview
  • Brokers
  • Brokers comparison
  • The Leap
Special offers
  • CME Group futures
  • Eurex futures
  • US stocks bundle
About company
  • Who we are
  • Space mission
  • Blog
  • Help Center
  • Careers
  • Media kit
Merch
  • Tarot cards for traders
  • The C63 TradeTime
Policies & security
  • Terms of Use
  • Disclaimer
  • Privacy Policy
  • Cookies Policy
  • Accessibility Statement
  • Trust Center
  • Security tips
  • Bug Bounty program
  • Status page
Business solutions
  • Widgets
  • Charting libraries
  • Lightweight Charts™
  • Advanced Charts
  • Trading Platform
Growth opportunities
  • Advertising
  • Brokerage integration
  • Partner program
  • Education program
Community
  • Social network
  • Wall of Love
  • Refer a friend
  • Creator program
  • House Rules
  • Moderators
Ideas
  • Trading
  • Education
  • Editors' picks
Pine Script
  • Indicators & strategies
  • Wizards
  • Freelancers
  • Marketplace
Business solutions
  • Widgets
  • Charting libraries
  • Lightweight Charts™
  • Advanced Charts
  • Trading Platform
Growth opportunities
  • Advertising
  • Brokerage integration
  • Partner program
  • Education program
Look FirstLook First