Long
Long
Long 
PNE AG: A juicy entry point or a trap for long-term investors?XETR:PNE3 is sitting on a 'make-or-break' intersection of multi-year levels—here’s why the next move could either ignite a 60% rally or trigger a free fall
Technicals:
- price is testing the intersection of the lower boundary of the 2023 downtrend and that global support zone from 2021
- if market sentiment turns negative and price breaks support, a free fall toward 7.90 seems likely — that’s basically the last barrier holding the price up
- if the positive scenario plays out, look for an Expanding Triangle pattern to trigger a test of the mid-range of the descending channel
- the main target is the imbalance zone from Sep-Oct 2025 — expect heavy profit-taking from mid-term traders in that area
- long scenario invalidated if 2 bars close below 7.90
Fundamentals:
- GETTEX:PNE3 shares dropped 8% last month after the 2025 fiscal year earnings downgrade, triggered by short-term traders closing their positions
- having sold their Panama windfarm portfolio in January 2026, the company signals a strategic shift toward Germany, France, and Poland. This move is backed by new capacity permits recently secured in Germany in December
- in the short term these can drive short-term traders or weak hands out, but the mid-to-long-term recovery story now looks even more intact
- the company is definitely not a giant and still has high debt ratio, and this is a key risk which might negatively impact the share price in case the EU decides to increase % rates
- whereas European renewables sector faces headwinds and receives less support than it should, in my opinion, the limited fossil fuels might make green energy a solid long-term bet
Conclusion:
- the 8.50–9.10 zone plays a key role in determining the medium-term price action
- if this level holds, the price could head toward 12.20, with a long-term target of 15.00
- if the support zone fails, it opens the door for a retest of 7.90
- 8.80 serves as an attractive entry price for long-term investors, but short-term traders are advised to wait for a clear outcome: a strong bullish candle, consolidation at the support zone, or a decisive breakdown
# - - - - -
⚠️ Long-Term Signal - Buy ⬆️
✅ Entry Point - 8.80
🛑 SL - 7.78
🤑 TP - 12.14
⚙️ Risk/Reward - 1 : 3.2👌
# - - - - -
Good Luck!
# - - - - -
DISCLAIMER: Not financial advice. Everyone must make trading decisions at their own risk, guided only by their own criteria and strategy for opening or not opening a trade  Long
Long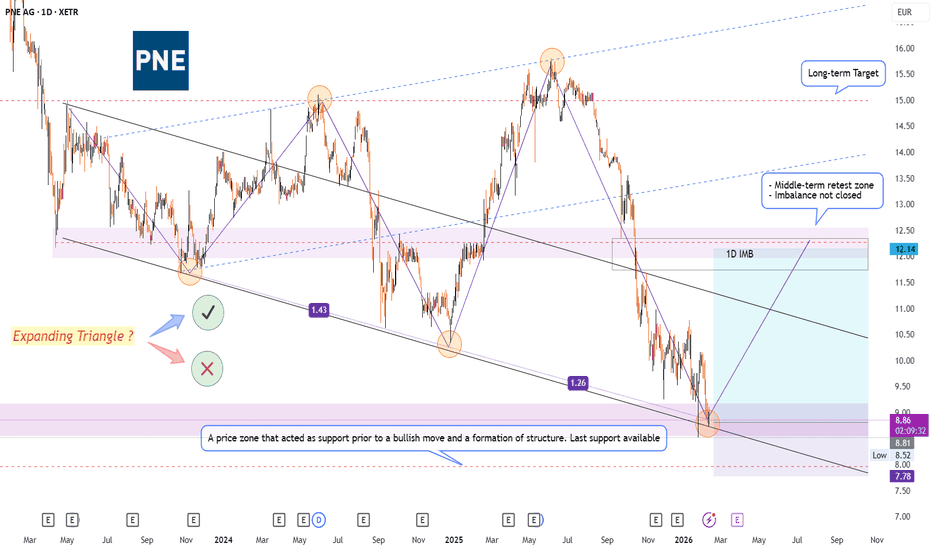
Volkswagen AG - Long-Term Opportunity DevelopingVolkswagen appears to have completed a full 5-wave impulse cycle, topping out around the 2021 highs. Since then, price action has transitioned into a broader corrective phase, likely unfolding as an ABC structure.
Wave A marked the initial sell-off, followed by a Wave B recovery. Currently, price action suggests we are in Wave C, which typically represents the final leg of a correction.
From a structural perspective, the trend remains weak:
Lower highs and lower lows
No confirmed reversal yet
Price trading below key retracement levels
Key Levels
61.8% retracement (~105€): First major resistance
78.6% – 88.7% zone (~55–75€): High-probability demand zone
Long-term support (~34€): Historical floor
My Plan (Long Setup)
I am not looking to enter at current levels.
Instead, I’m watching for price to move into the 55€–75€ zone, which aligns with:
Deep Fibonacci retracement levels
Potential completion of Wave C
Long-term value area within the broader range
This zone offers a high risk/reward long opportunity if:
Price shows signs of stabilization
Selling pressure weakens
A structural shift begins (higher lows / reclaim of key levels)
Invalidation / Risk
A clean breakdown below ~55€ would suggest a deeper structural shift
No confirmation = no position
Conclusion
Volkswagen is not currently in a trend phase, but rather in a long-term corrective structure.
The focus is on patience and positioning in extreme value zones, not chasing price.
This is a planned long setup, not an active trade.  Long
Long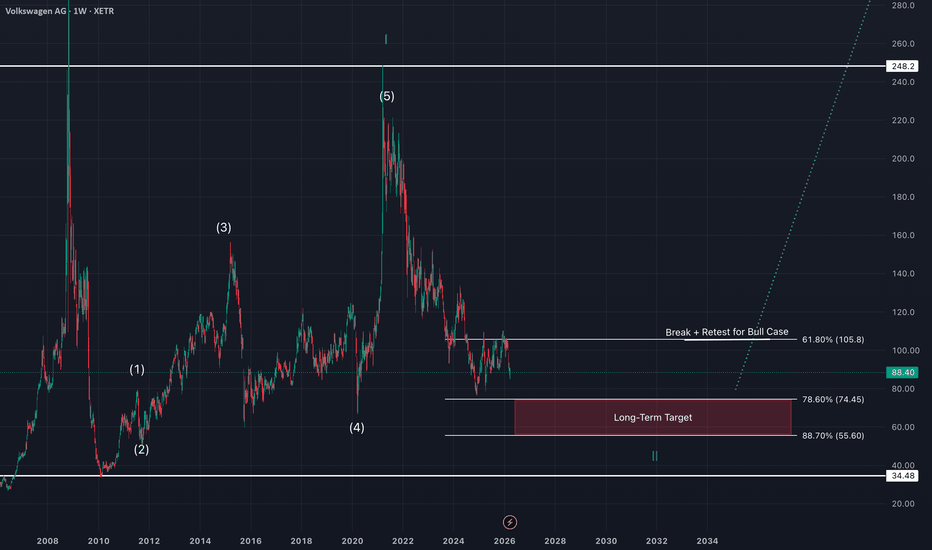
 Short
Short
 Long
Long
 Long
Long
The Coming EU Recession into 2028, Mercedes BENZ $MBG Triple TopThe principal pillar of the European economy is Germany, recognized as its wealthiest nation.
A parallel can be drawn to the adage regarding America: when it experiences a minor setback, the global economy often faces significant repercussions.
It is often asserted that the essence of "Deutschland" is deeply rooted in its automotive industry, leading to its moniker as "Autoland." German automobiles have consistently been esteemed as the finest globally.
In fact, the most thriving economic engine in Europe has been heavily dependent on the automotive sector, and the initiatives aimed at addressing climate change have been likened to the act of vanquishing a vampire—driving a stake through its heart.
Volkswagen, the biggest car maker in Europe, is warning that it might have to cut thousands of jobs and close some factories in Germany. This is happening because they are having tough talks with unions about rising costs.
The push for climate-friendly cars has really affected how many people want to buy new vehicles, and they are also facing strong competition in the electric car market. The news about job cuts and possible factory shutdowns is causing a big stir around the world.
Other car companies like Mercedes Benz, BMW, and Ford are also making cuts and letting employees go. Volkswagen is planning to lay off tens of thousands of workers and is even thinking about closing some factories, which is a big deal. Bosch, the largest auto parts supplier in the world and a major employer in Germany, is also cutting hours and pay for around 10,000 workers. Even Meyer Werft, a shipbuilding company that has been around since the 1800s, recently needed a huge bailout of $423 million to stay out of bankruptcy.
The economic strategies implemented by Brussels have significantly weakened the overall economy of the European Union. Germany has remained committed to the traditional Mercantile economic model, maintaining elevated tax rates to curb inflation while producing goods for export to generate profits.
In 2023, the automotive sector is projected to represent as much as 17% of Germany's exports. This sector has created over 750,000 jobs. However, German manufacturing has struggled to achieve a full recovery since the COVID-19 pandemic in 2020, currently reaching only about 90% of its pre-pandemic output.  Short
Short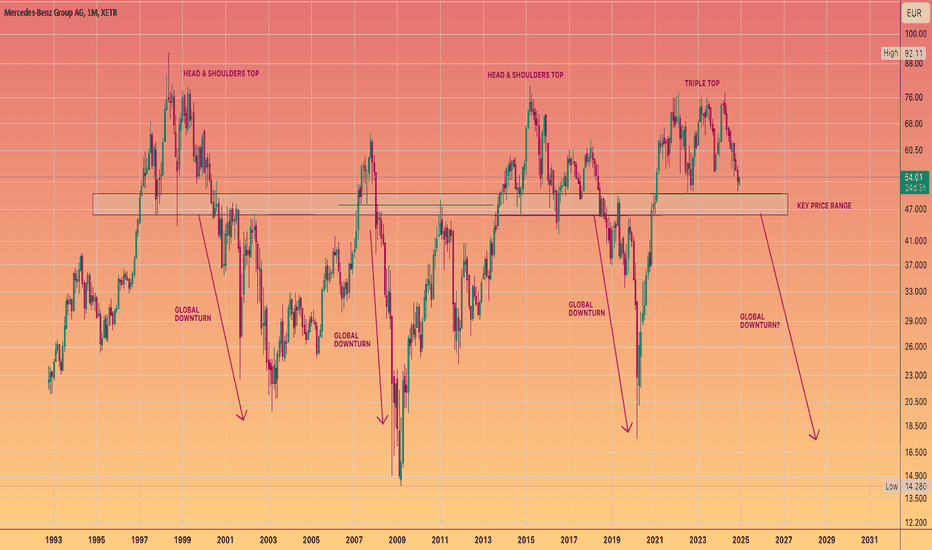
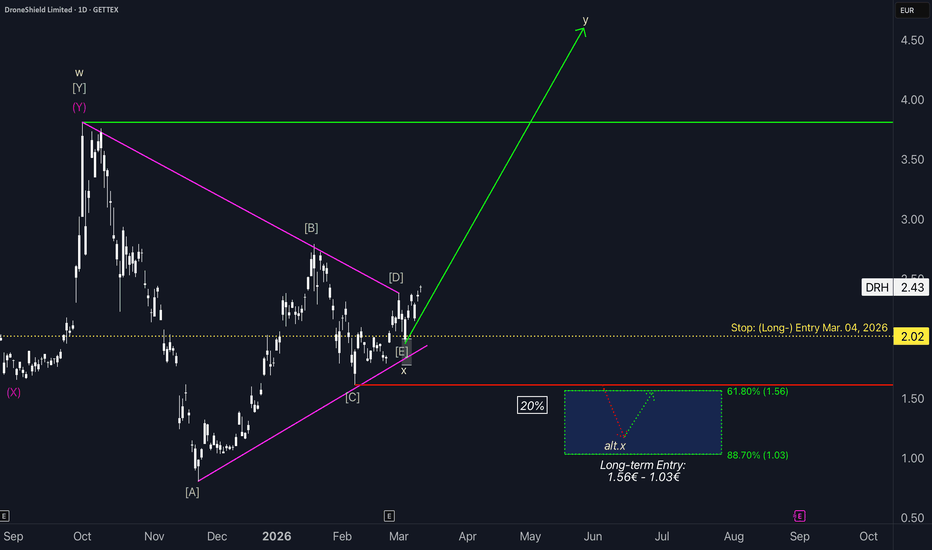
DroneShield: Hit and Run!We recently switched our DroneShield charts to the Munich-based gettex exchange. As a result, we are now analyzing the price in Euro (instead of Australian dollars) — however, this does not change our wave count, our expectations, or our scenarios.
Since our last update, DroneShield’s stock has continued to move higher and has thus confirmed the corrective low. We closed half of our long trade that was opened on March 4, 2026. We are remaining in the market with the other half of the position and are protecting it with a stop at €2.02.
Alternative scenario
However, if downside pressure increases significantly and the stock even falls below the support at €1.61, our alternative scenario would be activated. In that case, we would assume that a lower low will be formed within our alternative long-term entry zone (coordinates: €1.56 – €1.03) (probability: 20%). Thereafter, the upward move described above would likewise unfold.  Long
Long
 Long
Long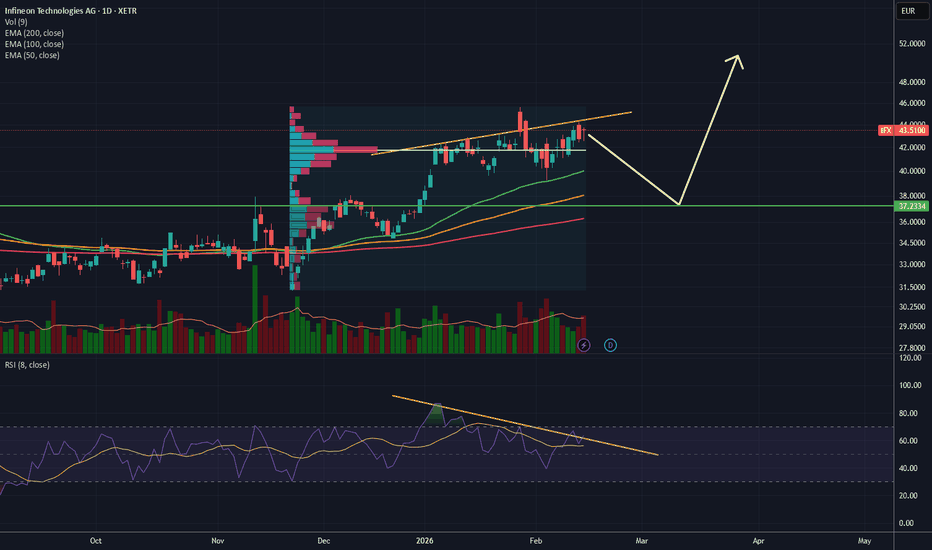
Symmetrical compression (potentially explosive)Drone warfare is now a reality: those who manufacture drones will certainly win, but those who can take them down are just as essential.
Some info:
DroneShield is an Australian company experiencing extremely rapid growth due to the global surge in demand for anti‑drone technologies. In 2025, it recorded revenue growth of 276–277%, reaching AUD 216.5 million, and returned to stable profitability with AUD 210 million in cash and zero debt. Its order pipeline has reached AUD 2.3 billion, supported by military contracts in Europe, the US, and the Middle East. The company is also expanding production capacity to AUD 2.4 billion per year by 2026 to meet rising demand. The stock has gained over 286% in the past year, boosted by strong growth in its software (SaaS) segment, which increases recurring revenue and margins.
What does DroneShield produce?
DroneShield specializes in C‑UAS (Counter‑Unmanned Aerial Systems) technologies—systems designed to detect, identify, and neutralize hostile drones. It produces:
Portable anti‑drone systems, including handheld devices, accessories, and software updates, such as those involved in recent AUD 49.6 million European contracts.
Advanced sensors, including RF, acoustic, and optical detectors, capable of identifying drones at long distances.
Jamming systems and “drone‑defeat” technologies used by militaries and critical infrastructure in over 70 countries.
Software and SaaS platforms for threat analysis, control, and management—one of the company’s fastest‑growing segments, up more than 300% in a year.
----
Analysis
The price is currently moving within a symmetrical compression triangle that has now reached its apex. A breakout could occur today or, more likely, next week.
The breakout from a compression triangle generally leads to a strong move in the direction of the breakout, making this a good time to start monitoring the setup.
Updates will follow.
If you appreciate my ideas, I’d be grateful for a like.  Short
Short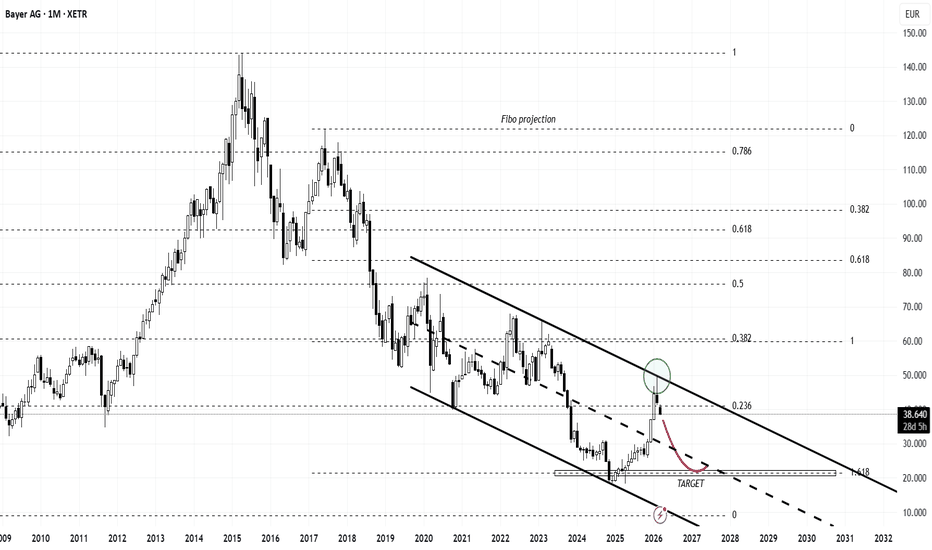
 Long
Long
 Long
Long
Milk the cow?GFT Technologies is looking fundamentally interesting at the moment.
Revenue has grown by around 3 percent in the latest report. The forward P/E ratio is not particularly attractive, but most other metrics appear stable.
From a technical perspective, the volume profile is showing a P-shaped structure. This typically signals short-covering or responsive buying after a sell-off. On the chart, the value area high and the point of control are positioned close to each other, while the value area low sits below as the lower boundary.
This structure can indicate potential for upside continuation, but it still requires confirmation.
Currently, we have several technical factors aligning. Price is interacting with the volume-weighted average price, the point of control, and the P-shaped volume profile. That cluster makes this area technically important.
From a longer-term perspective, I am viewing this as a multi-year setup. The horizon I am watching extends into the early 2030s, with a potential target implying significant upside if execution and market conditions align.
Historically, the stock has shown a pattern of recovering after pullbacks. Looking back to the early 2000s, the broader trend has been structurally upward, though of course past behavior does not guarantee future performance.
On the financial side, the company has continued to grow, though debt has increased in recent years, rising from roughly $82 million to about $160 million. This is not necessarily a red flag, but it is a metric that should remain under observation.
GFT is a technology firm providing IT services primarily to the financial industry. It operates across the Americas, the UK, Continental Europe, and other regions. The company is headquartered in Stuttgart, Germany.
Leadership continuity is another supportive factor. CEO Marco Santos has deep internal experience, having progressed from regional leadership roles to the top position. He has stepped back from outside commitments and is now fully focused on leading the company, which is generally a constructive signal.
Bottom line.
Fundamentally, the company looks stable but not flawless. Technically, price is sitting in an interesting zone that could develop into a larger move if confirmed.
Whether it is a buy depends on your own framework, risk tolerance, and validation process. Always run your own analysis and peer comparisons.
From a top-down perspective, remember that the German economy is closely linked to both the broader European cycle and the U.S. environment. Monitoring macro conditions across these regions remains important for this name.
Disclaimer:
This content reflects personal market opinions and is shared for educational and informational purposes only. It does not constitute financial, investment, or trading advice. Always conduct your own research and assess your risk before making any investment decisions. Past performance is not indicative of future results.
 Long
Long
Drink your pain away with Pernod Ricard?During the pandemic, Pernod Ricard, one of the largest spirits producers, saw strong upside. Recently, however, the stock has been correcting.
The angle I am watching is more defensive in nature. In weaker economic environments, alcohol demand has historically shown resilience as consumer behavior shifts during periods of stress. That is the broader thesis behind this setup.
Despite the broader market pressure, we are starting to see early attempts to push higher. That said, the overall market has not fully stabilized, so this level needs to be monitored carefully.
Fundamentally, the company looks solid. Net margins are around 14 percent, which may appear modest, but for this industry it is within a reasonable range.
From a strategic standpoint, Pernod Ricard continues expanding its distribution footprint, particularly in China and other international markets. The brand portfolio is well established.
There are, however, some demand headwinds. Consumer momentum in China has softened, and there have been some pressures in the U.S. market. Even so, the broader fundamental picture remains stable.
For me, this is more of a defensive or downturn-resilience play. There is significant resistance overhead, but structurally the global demand for premium spirits remains intact over the long term.
Bottom line.
This is a quality compounder at a reasonable valuation, currently moving through a softer demand phase. It is not a deep value situation, and it is not clearly overvalued either. It leans more defensive than high growth.
The stock looks more attractive on pullbacks rather than on strength. Chasing momentum here does not offer the best risk profile.
Technically the structure is acceptable. Fundamentally the business remains sound. What is missing right now is a clear catalyst.
This is likely a longer-term setup, in the two to three year horizon, rather than a fast momentum trade.
Disclaimer:
This content reflects personal market opinions and is shared for educational and informational purposes only. It does not constitute financial, investment, or trading advice. Always conduct your own research and assess your risk before making any investment decisions. Past performance is not indicative of future results.
 Long
Long
 Long
Long
Bayer AG Seeks to Close the Roundup Legal FrontIon Jauregui – Analyst at ActivTrades
German pharmaceutical and agrochemical giant Bayer is back in the spotlight after announcing a new effort to resolve the long-running litigation in the United States over the herbicide Roundup. The company has proposed a settlement of up to $7.25 billion to resolve approximately 65,000 claims related to alleged cancer cases, a direct legacy of its 2018 acquisition of Monsanto for $63 billion.
The Monsanto deal, conceived as a strategic move to consolidate global leadership in crop science, became one of the most controversial corporate episodes of the past decade. Since then, Bayer has paid nearly $10 billion in settlements and faced multimillion-dollar verdicts, including a $2.1 billion judgment. The new plan involves structured payments over 21 years and does not constitute an admission of guilt, though it explicitly recognizes the financial cost associated with the litigation.
Record Provisions and Cash Flow Pressure
From an accounting perspective, Bayer expects to raise its legal provisions to €11.8 billion. The company also anticipates negative free cash flow in 2026 due to the payment schedule. This is particularly relevant for the market, which closely monitors debt levels, dividend policy, and the company’s capacity to sustain investment in research and development.
Bayer’s strategy is to convert an uncertain and potentially unlimited legal risk into a quantified, time-distributed financial obligation. However, the settlement’s effectiveness will depend on judicial approval and the level of participation by plaintiffs. If acceptance falls short of the required threshold, legal exposure could remain.
Market Reaction and Fundamental Reading
The stock initially reacted positively, reflecting relief at the prospect of reducing the structural uncertainty that has weighed on the value since 2018. However, the initial enthusiasm gave way to caution as investors assessed the real impact on cash flow and the balance sheet.
Fundamentally, the Roundup case has acted as a persistent discount on Bayer’s valuation multiples. While its pharmaceutical and agricultural businesses remain solidly positioned globally, the legal risk has influenced perceptions of the company’s financial profile. The key question is whether this extraordinary provision marks a turning point or simply redistributes the problem over time.
Technical Analysis – Bayer AG (Ticker AT: BAYN): Structural Volatility
Technically, the stock has continued an upward trend, expanding the distance between its 50-, 100-, and 200-day moving averages. The value remains highly sensitive to any judicial developments. Yesterday’s session lows, following the news, rested near the 50-day moving average, acting as a critical short- and medium-term support around €45.10. A breakdown could reignite selling pressure toward the 200-day moving average near €41.30. On the upside, the last highs of €49.78 on Tuesday acted as resistance; this price level has not been seen since September 2023.
RSI has corrected strongly toward the mid-zone at 56.28%, while MACD shows a negative histogram but its signal line remains above, suggesting consolidation rather than a trend reversal. These resistance levels coincide with previous legal news announcements, where initial rebounds triggered selling. If the market responds positively to this management of an adverse ruling after upcoming earnings, prices could move above €50. Otherwise, the technical bias may remain constrained by the legal front, generating corrections to support zones at €41.47 and €32.78, respectively.
An Attempt to Turn the Page
Bayer is seeking to close one of the most burdensome chapters in its recent corporate history. The proposed settlement aims to transform an open legal risk into a structured, time-bound financial obligation, providing greater market visibility. However, this certainty comes at a cost: higher provisions and short- to medium-term cash flow pressure.
For now, investors remain cautious. The final judicial outcome and the company’s ability to stabilize its balance sheet will be key to redefining its stock narrative in the coming years.
Nonetheless, the stock’s performance in recent years suggests that, despite adverse rulings and the high legal cost, the market has gradually internalized much of this risk. The share price has repeatedly shown resilience after periods of high volatility, indicating that much of the impact may already be priced in. From this perspective, unless new disruptive factors arise, the legal front is unlikely to threaten the company’s long-term potential.
*******************************************************************************************
The information provided does not constitute investment research. The material has not been prepared in accordance with the legal requirements designed to promote the independence of investment research and such should be considered a marketing communication.
All information has been prepared by ActivTrades ("AT"). The information does not contain a record of AT's prices, or an offer of or solicitation for a transaction in any financial instrument. No representation or warranty is given as to the accuracy or completeness of this information.
Any material provided does not have regard to the specific investment objective and financial situation of any person who may receive it. Past performance and forecasting are not a synonym of a reliable indicator of future performance. AT provides an execution-only service. Consequently, any person acting on the information provided does so at their own risk. Political risk is unpredictable. Central bank actions can vary. Platform tools do not guarantee success.