• Products
  • Community
  • Markets
  • Brokers
  • More
Get started
  • Markets
  • /Germany
  • /Stocks
  • /Ideas
BASF: Attractive risk-reward profileScenario A: Triggered at a price of €39, offering a minimum upside potential of 39% Scenario 1: Attractive risk-reward profile. There is a potential for the consolidation to be broken. +45% from current price Scenario 2: The long-term optimistic target is set at €75. +71% from current price
XETR:BASLong
by GGekko
Should you panic now?TKA took a heavy dip today — and let’s be honest, it probably won’t be the last. The reason lies in the company split: TKMS, its naval division, is now tradable on its own. Naturally, when a split like that happens, market capitalization shrinks, and the price reacts accordingly. Add a few investors who missed the news and panic sold, and you get today’s selloff. But does that mean our 16 € target is dead and we’re all doomed? Not quite. We got rejected cleanly off the resistance line (-0.236 Fib) right as the blue structure completed — a selloff was inevitable. When the market reacts that fast, it often seeks a deeper retracement, and that’s exactly what I’m watching. The 0.618 level is where I plan to reload. I like that zone because it would align with the target line, creating a healthy lower low that still holds as a higher low on the larger structure — a textbook sign of a market that’s simply completing its formation, not collapsing.
XETR:TKALong
by xSamu_TA
Updated
DBK swing viewAfter bearish low volatility month with 13% pullback towards daily Demand zone. We can see price starting to consolidate.Swing high on Weekly TF has swept the liquidity but didnt break the structure, that means we didnt change a character yet, After closing bellow our Demand we can tell we changed the character and this stock will be bearish in my eyes. Now I'am still looking for buy opotturnities fron the Demand area, with potencial targets of Daily Supply(Weekly Swing high) Tell me your opinion...
XETR:DBKLong
by martosfx
SAP SE – Wave 3 Macro Rally in Progress🚀 SAP SE – Wave 3 Macro Rally in Progress | Fibonacci Targets & Institutional Accumulation in Play 💼 📅 Timeframe : 3W (Macro Outlook) 📍 Current Price: 238.85 🎯 Wave 3 Target: ~1743 (2.618 Fibonacci Extension) 📊 Wave Structure & Elliott Theory SAP SE appears to be mid-way through a major Elliott Wave cycle , where: Wave 1 formed during the late 90s tech boom 📈 Wave 2 brought a deep correction post-2000 crash, respecting the 0.5 Fibonacci retracement Wave 3 now underway, projected toward the 2.618 extension at ~1743 , suggesting a strong impulsive leg fueled by fundamentals and institutional accumulation Wave 4 and 5 to come, but we are early in the Wave 3 journey – historically the most powerful wave in terms of price growth and investor sentiment ⚡ 🧠 Smart Money Concepts (SMC) ✅ Reaccumulation Range: After an extended period of sideways price action (2001–2019), the chart shows clear signs of Smart Money accumulation – long-term positioning by institutions. 📈 Break of Structure (BOS): Clean break above prior macro highs indicates the end of reaccumulation and the start of a markup phase . This aligns with the SMC concept of entering trades after BOS and mitigation of supply zones. 📦 Liquidity Grab: Previous dips served to collect liquidity before major impulsive moves – a classic institutional playbook. 📐 Fibonacci Confluence 🔹 0.5 Retracement from Wave 1 → Wave 2 provided a textbook correction 🔹 2.618 Extension from Wave 1–2 projects a long-term Wave 3 target of ~1743 , giving this move macro-level significance 🔹 No visible divergence yet – momentum is supporting continuation 🌀 🔎 Price Action Higher Highs & Higher Lows structure confirmed on multi-year view 📶 Strong bullish candles breaking historical resistances No major supply zones overhead on the macro chart until much higher levels – suggests room for exponential upside Pullbacks remain shallow, indicating strong buy-side pressure 🧾 Fundamental Outlook SAP SE is Europe’s largest software company and a global ERP leader. It’s undergoing a digital transformation into cloud-based SaaS, improving recurring revenue and margins. 💻☁️ Strong balance sheet Growing enterprise customer base Cloud revenue growing YoY Excellent positioning in AI and digital infrastructure themes going forward 🔮 Fundamentals support a multi-year bullish cycle , aligning perfectly with the current Wave 3 structure. 📌 Conclusion: SAP is entering a potentially parabolic phase as part of a long-term Wave 3 impulse, supported by: 📈 Elliott Wave alignment 🔁 Institutional reaccumulation (SMC) 🔍 Strong technical structure & price action 📐 Fibonacci confluence 💼 Solid fundamental trajectory As long as price holds above previous structure highs and no macroeconomic shock disrupts the tech cycle, SAP could be heading for an exponential breakout over the coming years. ⚠️ Disclaimer: This is not financial advice. For educational purposes only. Always manage risk and use proper position sizing. 🛡️ #SAP #SAPSE #ElliottWave #WaveAnalysis #Fibonacci #SmartMoney #PriceAction #LongTermInvestment #SwingTrading #TechnicalAnalysis #BullishSetup #MacroView #FibonacciExtensions #StockMarket #TradingStrategy #InstitutionalTrading #Breakout #Reaccumulation #ChartPattern #Fundamentals
XETR:SAPLong
by fibcos
11
The Wyckoff Accumulation Nears CompletionThe technical picture indicates strong signs of accumulation, as per both Weinstein and Wyckoff methodologies. The weekly chart places the asset firmly in Stage 1 (Basing/Accumulation). Furthermore, a detailed Wyckoff Accumulation pattern is unfolding. The pattern has now entered its final and critical phase, where the price, having already demonstrated a Sign of Strength (SOS), is undergoing a test of the Last Point of Support (LPS).
XETR:PUM
by loorko
22
AMD - Wonderful ascending triangle formationFundamentals are great, earnings in 16 days likely to outperform. Pair that with a bullish ascending triangle out of a textbook and you have a bull entry like no other.
GETTEX:AMDLong
by enakocapital
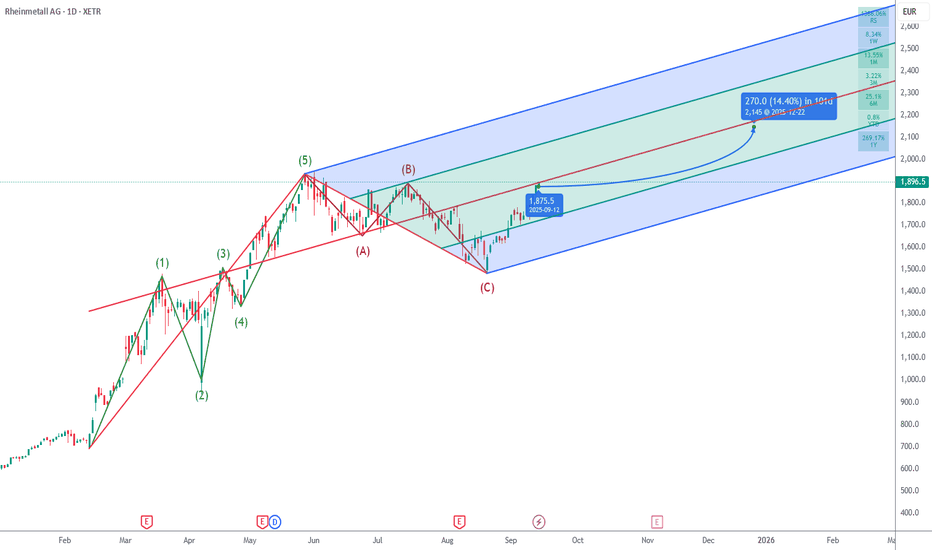
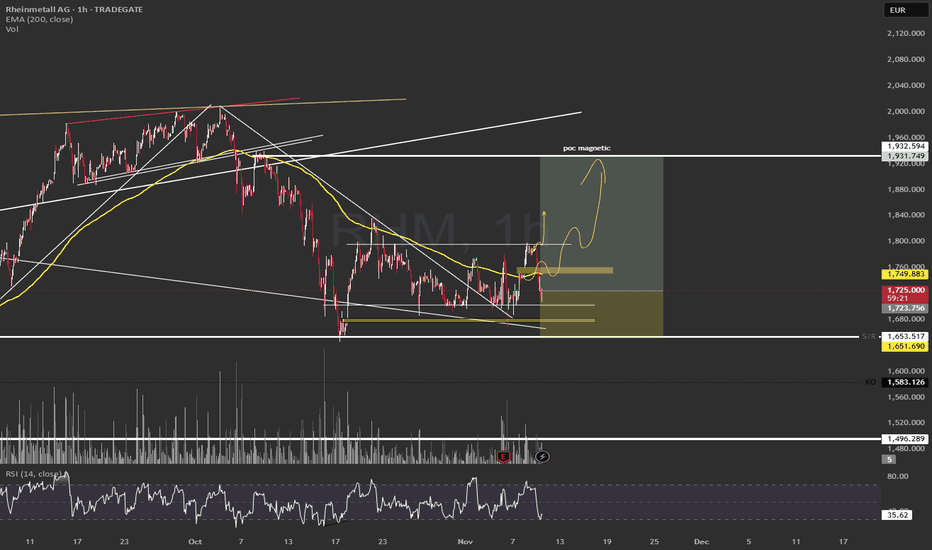
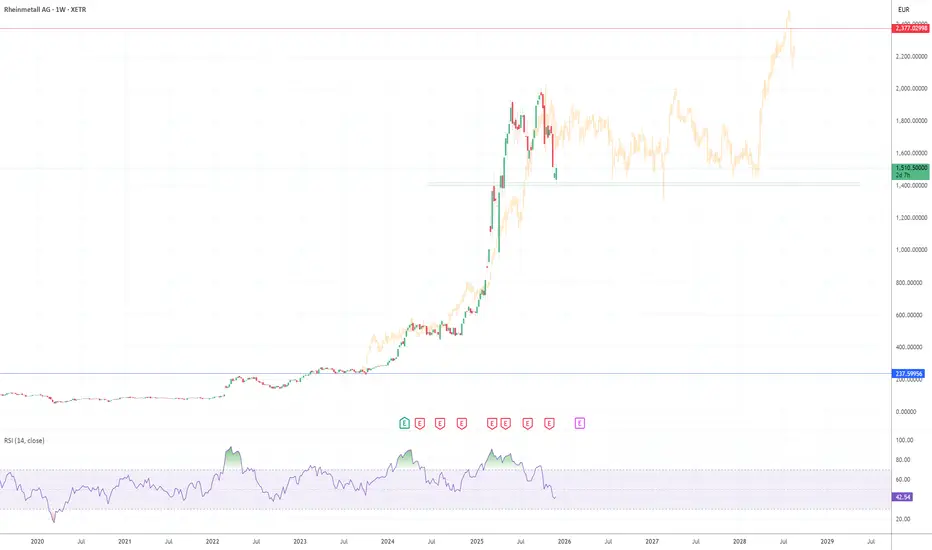
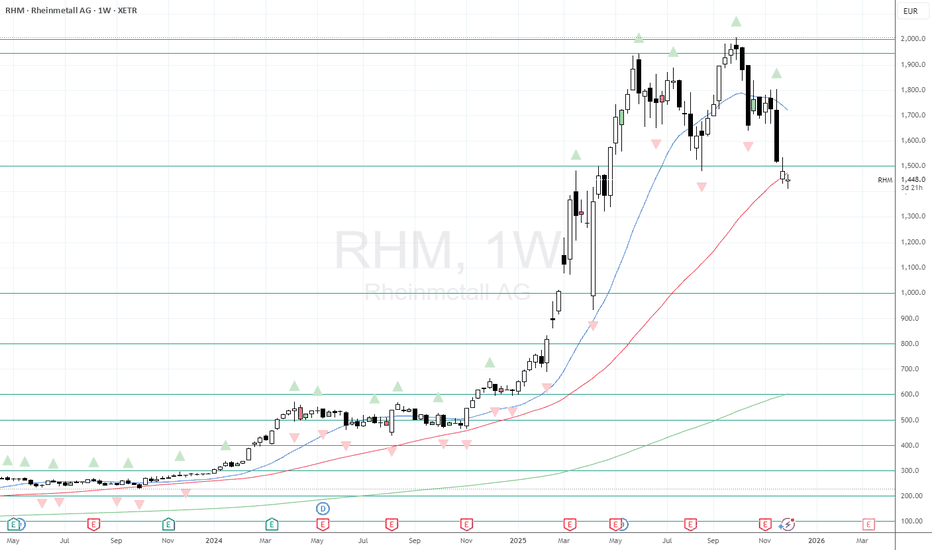
Great opportunity to buy RHM at discountPYTH:RHM fell down from its ATH and this is a golden opportunity to dip buy. Within no time it will already be above 2000 euros as this is the backbone of German and perhaps also EU defense industry. Remember folks there is a big push to churn out defense equipment, weapons in the EU and across the world and it only accelerates in the next 5 years. This stock will go to 5000 euros in next 5 years. News alert: Rheinmetall Joint Venture Gets $4 Billion Combat Vehicle Order www.tradingview.com
XETR:RHMLong
by warenabuff
HOCHTIEF AG – Technical Breakout Confirms Long-Term UptrendCompany Overview HOCHTIEF AG is a historic German construction and infrastructure company with over a century of engineering heritage. Founded in 1873 and headquartered in Essen, Germany, HOCHTIEF is one of the world’s leading infrastructure groups with four core divisions: HOCHTIEF Americas, HOCHTIEF Asia Pacific, HOCHTIEF Europe, and Abertis Investment. The company is a 100% subsidiary of the Spanish construction group ACS S.A. 🔹 In North America, HOCHTIEF focuses on large-scale transportation and infrastructure projects across the U.S. and Canada. 🔹 In the Asia-Pacific region, it engages in mining, engineering, infrastructure, and maintenance services, including PPP (public-private partnership) projects. 🔹 The European division specializes in transportation, energy, social, and urban infrastructure, and actively promotes digital construction and intelligent project management. 🔹 The Abertis Investment arm manages toll road assets across France, Spain, North and South America, Chile, and Mexico. 📊 Financial Performance Between 2023 and 2025, HOCHTIEF showed a steady improvement in profitability. In Q2 2025, the company achieved a remarkable earnings surge — the Earnings per Share (EPS) rose above €4.0, nearly doubling from the 2024 average of €1.5–2.0. This reflects solid growth in global infrastructure projects, strong PPP performance, improved cost control, and higher project efficiency across all major markets. 📈 Technical Chart Analysis (1D timeframe) Since early 2024, the stock has maintained a strong upward staircase pattern, breaking out consecutively from consolidation zones A, B, and C. Each correction phase occurred with declining volume, while breakout phases were accompanied by significant volume increases — clear evidence of institutional accumulation. ➡ In recent price action, the stock consolidated within the C-zone, absorbing short-term profit-taking pressure. ➡ In early October, the price broke above the C-zone with strong momentum and is currently holding above that breakout level — a technical confirmation of trend continuation. ➡ The MACD indicator remains well above the zero line, forming a Golden Cross, suggesting continued bullish momentum. ➡ Short-term EMAs (5, 10, 20) are positively aligned, further strengthening the support structure. 📍 Key Technical Levels Support: €252 Resistance: €280 Bias: Bullish — Uptrend continuation likely ⚠️ This analysis is for educational and informational purposes only. It does not constitute financial advice or an investment recommendation.
XETR:HOTLong
by Panagiotis_Trader
STRABAG SE – Breakout confirmed, early bullish phaseSTRABAG SE – Breakout confirmed, early bullish phase After a period of consolidation, STRABAG SE has confirmed a breakout above the upper boundary of Zone C on October 7th. The structure remains bullish, supported by increasing volume and a MACD golden cross. Technical Outlook • Timeframe: 1D • Support: €79.7 • Entry zone: €85.2–86.7 • Resistance/Target: €92.9–93.5 Momentum continues to strengthen, with price holding above key EMAs (20/50/100). Institutional participation appears to increase as volume expands on up-moves. ⚠️ Disclaimer: This idea is for educational purposes only and does not constitute financial advice. Always conduct your own research before investing. #STRABAG #TechnicalAnalysis #Breakout #GermanStocks #TradingView #Investing
GETTEX:XD4Long
by Panagiotis_Trader
KRKA d.d.: Geopolitical Tail Risk Constrains ValuationI. Executive Summary & Investment Recommendation A. Rating and Target Price Summary The analysis concludes that KRKA d.d. presents a fundamental duality: it is an exceptionally well-managed, high-margin European generic pharmaceutical company whose valuation is structurally depressed by high, unmitigable geopolitical risk concentrated in its largest regional market. B. Core Investment Thesis Summary KRKA’s core business, centered on specialty generics, particularly in the cardio segment , benefits from favorable European demographic trends and superior cost management, driving high profitability (ROE 16.1%). On a relative valuation basis, the stock trades at an attractive multiple (P/E 17.33x) compared to European generic peers.   However, approximately 19.5% of group revenue originates from the Russian Federation , a jurisdiction where the government has established legal precedents for seizing foreign assets and neutralizing intellectual property rights. The valuation framework must therefore account for a sudden, binary loss of nearly one-fifth of the company's enterprise value. The recommendation is driven by the fact that the current price (€215.00) offers only marginal upside to the weighted target (€224.20), failing to provide sufficient risk premium for the extreme potential downside defined by the De-risked Target Price (€182.50).   II. Company Overview: A Resilient European Generic Leader A. Corporate Profile and Product Focus Krka, d. d., Novo mesto, is a Slovenian pharmaceutical firm specializing primarily in prescription (Rx) generic drugs. The company is characterized by vertical integration and a focus on high-volume therapeutic areas. Its core product portfolio includes specialized generics, with the firm noting its leading producer position in the crucial cardiovascular segment in key markets. This product specialization is strategically aligned with one of the primary secular growth drivers in the European healthcare market: the increasing prevalence of chronic conditions and the imperative to manage costs via low-price, high-efficacy generics.   The Krka Group demonstrated exceptional operational performance in the most recent reporting period, recording its highest sales and profitability to date. In 2024, the Group generated revenue of €1,909.5 million, marking a 6% increase year-over-year, alongside a record EBITDA of €520.1 million.   B. Geographic Exposure and Concentration Risk Krka maintains a global market presence, characterized by significant dependence on export markets. A substantial 94% of product and service sales are generated outside Slovenia. The company’s geographic exposure is segmented into five regions, with the East Europe Region representing the critical anchor.   The East Europe Region recorded the highest sales contribution, accounting for 34.0% of total Krka Group sales in the first quarter of 2025. Within this region, the Russian Federation stands out as the single largest national market. In 2024, sales in the Russian Federation amounted to €373 million, representing approximately 19.5% of the total Group revenue.   The company's strategy in the region includes operating a local production facility in Russia, a crucial component that covers approximately 80% of local needs. This operational strength, designed to guarantee seamless business operations and adapt efficiently to market circumstances , unfortunately creates a profound strategic vulnerability. Unlike businesses that rely solely on imports, Krka’s significant physical and immobile asset structure, built to ensure stable domestic supply of critical drugs (such as cardio treatments) under local rules, simultaneously renders the company an optimal, readily manageable target for nationalization or the imposition of 'temporary administration' by the Russian state. The operational stability in the region, confirmed by management's continuous reporting of smooth collection of receivables and repatriation of Euros , is, therefore, a politically contingent privilege that amplifies the potential uncompensated loss risk.   Table 1: KRKA Group Sales Contribution and Geopolitical Risk (2024) Segment/Region 2024 Revenue (€M) % of Total Sales YoY Growth (EUR) Geopolitical Risk Assessment East Europe (Total) ~649.2 34.0% 10% High Concentration Russian Federation 373.0 19.5% 8% Extreme (Nationalization Target) KRKA Group Total 1,909.5 100% 6% Dual Risk Profile Export to Sheets C. Implications of Operational Strategy and Growth Krka's historical performance shows a five-year revenue compound annual growth rate (CAGR) of approximately 5.9%, and an earnings CAGR of 5.4%. When this growth is benchmarked against the projected overall European generic market CAGR of 8.4% , the company exhibits a growth rate lag. This disparity suggests two possible structural issues: either Krka is over-concentrated in slower-growth, mature Western and Central European markets, or its massive local currency growth in Russia is being destroyed by currency translation. Sales growth in the Russian Federation, for instance, was 19% in local currency in 2024, but this translated into only 8% growth in Euro terms due to an 8% depreciation of the rouble. The company requires accelerated successful penetration in Western markets or sustained currency stabilization to align its growth profile with the broader sector expansion. This mandates the use of a conservative long-term growth rate in the Base Case valuation model, remaining below the sector average.   III. Sector & Industry Analysis: European Generic Pharmaceuticals A. Industry Structure and Growth Drivers The European Generic Drugs Market is supported by powerful structural tailwinds. The market size was valued at USD 119.99 Billion in 2024 and is projected to nearly double to USD 228.77 Billion by 2032, representing a robust 8.4% CAGR over the forecast period (2025–2032).   The demand is primarily fueled by shifting demographics, specifically Europe's aging population, which drives chronic medication use. Simultaneously, national healthcare providers consistently push for specialized, low-cost generic alternatives to manage escalating expenditures. Regulatory momentum, demonstrated by the surge in FDA approvals for generic drug manufacturers, also contributes to market acceleration. While high manufacturing costs are cited as a significant structural restraint on the market , Krka’s superior profitability metrics suggest its highly efficient, vertically integrated production model is capable of mitigating this pressure.   B. Competitive Landscape and Peer Analysis Krka competes globally against large regional players and specialty generic firms. Key publicly traded peers include Sandoz, a major specialty generic manufacturer, and Teva Pharmaceutical Industries, which is often characterized by restructuring or distressed assets. The company maintains a strong competitive position marked by resilient profitability, achieving a net margin of 19.3% and a high return on equity (ROE) of 15.2%.   However, comparison with broader pharmaceutical industry giants is misleading. Firms like AstraZeneca, Roche, and Sanofi command premium valuations based on patented drug pipelines and high R&D expenditures. As a generics specialist, Krka must be primarily benchmarked against specialty generics peers. The previously noted disparity—Krka’s 5.4% earnings growth CAGR versus the general pharmaceutical industry's 10.3% CAGR —suggests that Krka’s stock should inherently trade at a discount to these high-growth, R&D-driven majors. If dedicated generic peers like Sandoz can capture the 8.4% market growth more effectively, Krka’s current multiple discount relative to the median peer valuation is fundamentally justified.   A secondary but critical competitive threat in the Russian market stems from the erosion of intellectual property (IP) protection. The Russian government’s 2022 decree effectively eliminated compensation (setting it at 0%) for the unauthorized use of patents held by entities from "unfriendly states". This policy fundamentally destroys the long-term competitive advantage of any IP-reliant pharmaceutical business operating in Russia, even generic firms that rely on process patents and regulatory exclusivity to protect their high margins. This legal change supports the decision to model the Russian operations as having zero long-term residual value in the valuation analysis.   IV. Financial Analysis: Performance Trends (2020–2024) A. Revenue Growth and Trends The Krka Group has demonstrated resilient revenue growth over the past five years, achieving a CAGR of 5.9%. After a brief dip in 2023, the Group rebounded strongly, achieving €1,909.5 million in revenue in 2024, a 6% increase year-over-year. This positive momentum has continued into the current year, with Q1 2025 sales reaching €521.5 million, representing 8% year-on-year growth. This trajectory indicates stable demand for its core product lines across global markets.   B. Profitability, Margin Quality, and Return Metrics Krka’s profitability is consistently superior within the generics sector. In 2024, the Group reported a net profit of €356.2 million, a 14% increase over the €313.7 million reported in 2023. This translates to a strong net margin of 18.6% in 2024, slightly below the previously cited 19.3% historical net margin. Furthermore, the company reported an impressive ROE of 16.1% in 2024 , confirming excellent capital efficiency.   A crucial observation, however, emerges from the differential growth rates across the income statement. While net profit surged 14% year-over-year, the underlying operational performance showed slower growth: EBITDA grew only 3% to €520.1 million, and Operating Profit (EBIT) grew 7% to €427.6 million. This divergence indicates that the impressive net profit growth was substantially reliant on favorable non-operational factors. Specifically, the Q1 2025 results highlight a positive net financial result totaling €56.8 million, driven largely by net foreign exchange gains of €57.6 million.   This reliance on non-operational income for margin expansion suggests a normalization of profitability is required for reliable future forecasting. When modeling future Free Cash Flow (FCF) for intrinsic valuation, projected margins should be anchored to the more conservative, lower historical operational growth rate (EBIT CAGR of 9.3%) , rather than the volatile surge reported in net profit, providing a more reliable, conservative intrinsic valuation.   Table 2: KRKA Group Historical Financial Summary (€ Millions) Metric 2023 (Reported) 2024 (Reported) Index (2024/2023) 5Y CAGR (EBIT) Revenue 1,806.4 1,909.5 106% 5.9% (approx) EBITDA 504.2 520.1 103% NA Operating Profit (EBIT) 399.6 427.6 107% 9.3% Net Profit 313.7 356.2 114% 7.8% Net Margin 17.4% 18.6% NA NA   C. Leverage and Cash Flow Profile The Krka Group maintains a strong capital structure, characterized by exceptionally low financial leverage. The reported Debt-to-Equity (D/E) ratio is minimal at 7.18% , suggesting minimal financial risk. This balance sheet strength allows the company substantial capacity for potential debt financing, should it pursue diversification or large-scale acquisitions.   The combination of high profitability, superior margins, and low leverage structurally translates into robust Free Cash Flow generation. Management’s routine execution of share buyback programs reinforces the view that the company generates excess capital beyond its internal investment needs and believes its shares are undervalued. This capital allocation strategy provides technical support for the stock price.   Furthermore, management commentary confirms that operational processes in Eastern Europe remain fluid, with the smooth collection of receivables and consistent repatriation of Euros from the Russian market. While positive for current liquidity and cash flow, this operational continuity is not a mitigation of the fundamental sovereign risk. Rather, it suggests the Russian state, by maintaining the supply of essential cardio generics, is choosing not to disrupt Krka's operations—a choice that could be reversed instantly, rendering the 'smooth operation' status a near-term benefit only, without addressing the binary geopolitical risk.   V. Geopolitical Risk Deep Dive: Russian Segment De-risking A. Assessing the Geopolitical Risk Magnitude The quantification of risk exposure is critical. With 19.5% of 2024 group sales (€373 million) originating directly from the Russian Federation , the potential revenue loss is significant. Although Krka does not disclose regional segment operating profit , assuming the Russian segment margin is equivalent to the Group’s 2024 EBIT margin (22.4%), approximately €83.5 million in 2024 EBIT is directly exposed to state action.   The legal and political environment in Russia has been demonstrably hostile towards foreign assets. Presidential decrees signed in 2023 and 2024 grant the Russian state the authority to seize assets and impose "temporary administration" on firms from "unfriendly states" in retaliation for Western sanctions. This framework was executed against multinational corporations, notably leading to the seizure of shares in Danone Russia JSC and Brewing Company Baltika LLC (Carlsberg). These precedents confirm the tangible, execution risk inherent to Krka's large, localized asset base in Russia. Coupled with the erosion of IP value through decrees eliminating patent compensation , the value of the Russian market contribution must be structurally impaired.   B. Modeling the De-risked Scenario To establish a valuation floor that accounts for this tail risk, a separate, De-risked DCF scenario is mandatory. This scenario models the financial impact of a sudden, uncompensated loss of all operational cash flows and the terminal value associated with the Russian Federation market. The key adjustments in the De-risked Model are: FCF Adjustment: Net Operating Profit After Tax (NOPAT) and subsequently FCF are immediately reduced by the estimated 19.5% contribution of the Russian segment from Year 1 onward. Growth Assumption: The terminal value calculation excludes any contribution from this market, and the remaining business growth rate is conservatively lowered to reflect slower growth potential in mature Western markets. WACC Consideration: The cost of capital (WACC) remains stable, as the reduction in geographic risk is considered offset by the increased execution and diversification risk faced by the smaller remaining core business. While international investment treaties (BITs) may eventually provide a potential avenue for recovery or compensation for foreign investors , such legal processes are lengthy and politically fraught. Therefore, the De-risked DCF assumes zero immediate recovery in the 0-5 year modeling horizon, capturing the immediate, irreversible balance sheet impairment.   VI. Valuation Analysis A. Cost of Capital (WACC) Derivation Accurate intrinsic valuation requires a robust Weighted Average Cost of Capital (WACC) that reflects both the operating market risk (Europe) and the concentrated geopolitical risk. 1. Cost of Equity (R e ​ ): The Capital Asset Pricing Model (CAPM) is utilized. Risk-Free Rate (R f ​ ): Assumed at 3.0%. This rate accounts for the standard 10-year German Bund yield proxy, adjusted slightly upward for the Slovenian country risk premium. Market Risk Premium (MRP): 6.00%, based on reliable European market proxy data.   Levered Beta (β): We adopt the market-implied levered beta of 0.800. This value is significantly higher than the mathematically calculated levered beta of 0.66 derived from Krka's low 7.18% D/E ratio. The higher implied beta suggests that the market has already factored in an additional risk premium—most likely reflecting the systemic geographic concentration risk in Eastern Europe.   R e ​ =R f ​ +(β×MRP)=3.0%+(0.800×6.00%)=7.8%. 2. Cost of Debt (R d ​ ) and Tax Rate (T): Krka maintains minimal debt; however, a required cost of debt is still necessary. R d ​ is estimated at 5.0%. The effective corporate tax rate (T) is estimated conservatively at 20%. 3. WACC Calculation: Given the exceptionally low leverage, the WACC is heavily weighted toward R e ​ . Utilizing the market-implied cost of equity and balancing the risk profile, the Base Case WACC is set at 7.0%, consistent with industry benchmarks for stable, low-debt specialty pharma firms, adjusted for geopolitical exposure. B. Relative Valuation (Peer Multiples) Krka currently trades at multiples that suggest it is undervalued relative to the median specialty generic peer, an indication that the market is already applying a discount for the company's geopolitical risk profile. Company P/E (x) EV/EBITDA (x) P/B (x) Net Margin (%) KRKA d.d. (KRKG) 17.33 ~9.1 Est. 2.6 18.6% Sandoz (SDZ) Est. 19.5 Est. 12.0 Est. 3.0 Est. 12.5% Teva Pharm. (TEVA) N/A (Neg. Earnings) 19.96 3.38 Negative Peer Median (Excl. Teva) 18.4 10.55 2.8 15.55%   Based on the median multiples of financially healthy generic peers, Krka trades at a noticeable discount in terms of P/E (17.33x vs. 18.4x) and EV/EBITDA (9.1x vs. 10.55x). This discount is likely attributed to the geopolitical concentration risk. However, the company’s superior net margins (18.6%) should fundamentally justify a higher multiple than the peer median, indicating the discount applied by the market is significant and reflects the binary nature of the Russian risk, not operational inefficiency. C. Intrinsic Valuation: Dual DCF Scenario Analysis The intrinsic valuation utilizes a two-pronged Discounted Cash Flow (DCF) model, projecting normalized FCF from a 2024 NOPAT baseline of €350 million (approximating Net Profit due to low debt levels). The estimated number of shares outstanding is approximately 32.8 million. 1. Base Case DCF (Current Operations, Risked) This scenario assumes Krka successfully maintains operational continuity and repatriation in Russia, with the geopolitical risk reflected solely in the 7.0% WACC. Growth Rate: FCF is assumed to grow at an average of 6.5% for the explicit 5-year period, slightly above the historical revenue CAGR, reflecting operational leverage and ongoing share buybacks. Terminal Value (TV) Growth (g): A conservative long-term normalized growth rate of 2.5% is used, reflecting mature market dynamics and geopolitical saturation. Implied Valuation: Discounting the projected FCF yields an Enterprise Value (EV) of approximately €8,267 million. Given the minimal net debt, Equity Value ≈ EV. Base Case Target Price: €8,267 million / 32.8 million shares ≈ €252.00 per share. 2. De-risked DCF (Excluding Russia/CIS Exposure) This scenario establishes the valuation floor by modeling the total, uncompensated loss of the Russian segment. FCF Deduction: Baseline FCF is reduced by 19.5% immediately. Year 1 FCF is projected at approximately €300 million. Terminal Value (TV) Growth (g): Reduced to 2.0% to reflect the reliance of the remaining business on more mature, slower-growing Central and Western European markets. Implied Valuation: Discounting the reduced FCF at 7.0% WACC and a 2.0% TV growth rate yields an EV of approximately €6,000 million. De-risked Target Price: €6,000 million / 32.8 million shares ≈ €182.50 per share. Table 4: Discounted Cash Flow (DCF) Summary and Sensitivity Valuation Scenario WACC (%) Terminal Growth (%) Russia/CIS Exposure Implied Target Price (€/Share) Base Case (Current Operations) 7.0% 2.5% 100% Retained 252.00 (Anchor) De-risked Case (Excl. Russia/CIS) 7.0% 2.0% 0% Retained 182.50 (Floor) Weighted Target Price NA NA Weighted Risk (40%) 224.20 Export to Sheets VII. Investment Thesis & Risks A. The Bull Case (Upside Catalysts) Sustainable High Margins and FCF Generation: Krka’s structural competitive advantages translate into high, defensible net margins (19.3%) and ROE (16.1%). Continuous operational efficiency and capital expenditure optimization should consistently generate superior FCF.   M&A Capacity and Capital Allocation: The company’s minimal leverage (D/E 7.18%) provides substantial dry powder for accretive merger and acquisition activity aimed at diversifying away from the Eastern European concentration. Furthermore, routine share buybacks act as consistent technical price support.   Geopolitical Stabilization: Although highly improbable, any significant stabilization in Russian/EU relations or a resolution allowing Western firms to operate with assured legal safety would immediately justify a normalization of Krka’s multiples closer to specialty pharma peers, driving the stock toward the €252.00 Base Case target. B. The Bear Case (Downside Risks) Geopolitical Expropriation (Tail Risk): This remains the defining risk. The uncompensated seizure of Krka's local production assets and market access in Russia, supported by recent decrees and precedents against Danone and Carlsberg , would fundamentally reset the company’s valuation to the €182.50 floor, representing a 15% immediate downside from the estimated current price (€215.00).   Chronic Rouble Volatility: Even in the absence of asset seizure, persistent depreciation of the Russian rouble will continue to erode the value of highly successful local sales. The 19% local currency growth in Russia translating to only 8% growth in Euro terms in 2024 underscores the acute currency risk that structurally dampens consolidated revenue and profit reporting.   Competitive Lag and R&D Deficit: Krka’s earnings growth (5.4% CAGR) trails the broader industry (10.3% CAGR). This signals potential structural underinvestment in high-growth R&D projects or a failure to diversify product portfolios effectively, which could lead to margin compression as older generic portfolios face increased competition.   VIII. Final Recommendation Based on the dual valuation methodology, the weighted target price for KRKA d.d. is calculated to be €224.20. A. Reasoning The current estimated market price of €215.00 places the stock relatively close to the implied weighted target price. While the operational excellence and high margin profile of Krka provide a clear anchor for value (Base Case: €252.00), this value is structurally capped by the significant probability of an unmitigable tail risk that sets the valuation floor (De-risked Case: €182.50). The current market valuation appears to reflect a rational, moderate degree of skepticism regarding the permanence of the Russian segment's cash flows (approximately a 40% probability of eventual loss). For an investment to warrant a Buy rating, the required upside margin should significantly compensate the investor for holding a financially high-quality asset whose future is politically contingent. Since the upside to the weighted target is marginal (4.3%), while the downside risk to the valuation floor is material (15%), the risk/reward ratio is balanced but lacks the compelling skew required for an aggressive rating. Final Recommendation: HOLD. This rating reflects the view that the stock is fairly valued given the conflicting fundamental strength and extreme geopolitical exposure. Investors already holding Krka should maintain their position, recognizing the superior profitability of the core business, while new investors should await a more favorable entry point closer to the De-risked floor to ensure adequate compensation for the concentration risk. B. Sensitivity Analysis The intrinsic valuation is highly sensitive to changes in the terminal growth rate and the cost of capital, particularly because the vast majority of the company's value resides in the terminal period. Table 5: DCF Sensitivity Matrix (Target Price €/Share, Base Case FCF) WACC (Cost of Capital) g = 1.5% g = 2.0% g = 2.5% 6.5% 215.38 237.33 265.67 7.0% (Base) 196.50 216.00 252.00 7.5% 181.00 199.11 219.82 Export to Sheets The sensitivity matrix confirms that the current stock price (€215.00) implies a market expectation of a 7.0% WACC combined with terminal growth slightly below the 2.5% modeled in the Base Case. If sovereign or market risk were to increase, pushing the WACC to 7.5%, even optimal growth scenarios would yield a valuation below the current trading price. This structure demonstrates that the valuation is not built on overly aggressive growth assumptions but is instead highly susceptible to minor perturbations in the cost of capital stemming from external, geopolitical factors.
FWB:KN8
by iglanbo1899
Stock Surges 165% After Weekly Close Above €9Prise will rise up to €24 aber a weekly close over €9. This will be the next major stop (+165%)
XETR:TUI1Long
by GGekko
Updated
33
VW Bottoming Out? Long-Term Target at €186 Signals Major UpsideVolkswagen appears to have reached its bottom. The current risk-reward ratio is highly favorable. A potential retest of the €83 support level (−11%) remains possible, while the long-term upside target stands at €186, representing a potential gain of +99%.
XETR:VOWLong
by GGekko
Updated
22
Hensoldt (HAG) - Overly optimistic? [Bear Case]Business model: Hensoldt is a German defence-electronics pure-play: ground/air radars, optronics/periscopes, electronic warfare. Their order book and revenue backlog is benefiting from Europe’s continuing rearmament. Why pricing looks rich: At ~€100+/share, the market appears to discount flawless conversion of the rearmament wave into sales and cash, sustained high-teens margins, and minimal programme/approval risk well beyond 2030. My GAAP-based DCF (9% discount, –1% terminal) values equity ≈ €20/share (DCF model snapshot), far below the market. Trading multiples at today’s price (as of Sep ’25): - EV/Rev: ~5× FY25. - EV/E (GAAP): ~116× FY25, ~85× FY26, ~72× FY27 - Compared to other defence companies, these current and future multiples are far above the average, requiring much greater growth in income, which seems unlikely. For today’s price to be ‘fair’, the market is effectively assuming: - Hensoldt’s 2030 revenue guidance is exceeded and margins significantly improve from current levels. - Contract wins versus close competitors in various revenue drivers, for example vs. Thales/Saab on large NATO sensor programmes (not just German programs). Technicals: The stock is approaching a recent all-time high, also corresponding with a Fib level as resistance, but with fading momentum, future defence spending globally already priced in, entering a short at €104.
XETR:HAGShort
by lucisafferens
Updated
Attractive Risk-Reward Ratio with BASFBASF remains in a consolidation phase, with a potential downside to €38 (−10.2%), where strong trendline support is expected. This level would likely mark a solid bottom. On the upside, a breakout could first reach €63 (+48.9%), with a medium-term target of €75 (+77.3%). The setup offers limited risk and strong upside potential.
XETR:BASLong
by GGekko
ORCL / ORACLE / Bullish scenario / fractal / SeasonalityHere is my view on ORCL: Until mid of November we should see a bullish seasonal move to the upside. My target is on the chart. SL at your discretion but i highly doubt that there will be a deeper pullback before next year... This is not a trade call, this is no financial advice. I am just a dude trading Oracle and good luck to all! Cheers! Feel free to leave a comment and discuss this analysis. I am happy to learn, exchange thoughts and chat.
XETR:ORCLong
by Amazing-Fractals
Updated
RHM - Parabola intactParabola still intact, but starting to look highly irraltional. Once this breaks, the short opportunity will be immense. I'm sidelined.
XETR:RHM
by enakocapital
CASELA WASTE SYSTEMSHere are my Thought on Casela Waste Systems: - from a seasonal perspective it should be bullish from early october until mid of january with an expected gain of median 8% and average 15%. - from a fractals perspective i am not sure which of the three entry points will work out. maybe this is more a complete entry area. feel free to contact me, leave a comment or/and support my idea by clicking that rocket. cheers!
GETTEX:WA3Long
by Amazing-Fractals
Updated
Nemetschek / Fractal and Seasonality / LongHere is my view on that stock: Until end of november we should see a bullish seasonal move. There might be some retracements but a drastic extended bearish period I expect to start June 2026 (PE+2). The target areas are derived from the spotted fractal. Did I pick the right one? Did I alling it right? Let's discuss.
GETTEX:NEMLong
by Amazing-Fractals
11
Turnaround 2025Not much to analyze yet as the stock doesn't show a lot of movement lately. I expect a major uptrend correlating with the release of the fiscalreport for the year 2024 and half year 2025 (expected this month). Revenue should be around 16-17m for last and around 26-27 for this year, making 2025 the first profitable year ever. Chart patterns: -crossed the triangle (marked by two major highs, 1st is the spike of the all time high) At the moment hovering around the ATL and looking at the projected numbers, the current stock price is a bargain.
TRADEGATE:SBXLong
by robschulz
11
Verbio $VBK improving fundamentalsVerbio’s weekly chart shows a repaired base after a long decline. Price has been making higher lows and is pressing the range top near 13. A weekly close above 13 would confirm a breakout, opening room toward ~15–16 and then ~18.8. First supports sit around 10–10.5, with 7.8 as the key line to hold; a break below 7.25 would invalidate the base. Fundamentals are turning more supportive. Biofuel and feedstock prices (UCO, tallow, RSO) have been firm for the last six months; the share price looks to be lagging that improvement. In Germany, GHG quota (“THG-Quoten”) prices have recovered, which should lift realized revenues and margins. Into the 25 Sep report, the set-up is straightforward: strength above 13 signals a new up-leg with improving spreads as a tailwind; failure there likely keeps the 10–13 range intact. Overall, a constructive technical picture with improving industry pricing makes this an interesting spot ahead of earnings.
XETR:VBKLong
by Cryptovicci
Borussia Dortmund BVB SELLBorussia Dortmund is a leading German club that has developed a reputation for nurturing and selling elite players. Its financial model is built on developing talent and selling players like Jadon Sancho, Erling Haaland, and Jude Bellingham for high transfer fees.
XETR:BVBShort
by ConnectmyCurrency
3350, MTPLT & DN3 : Bottom is inWe have a clear 5 down in c of 2 !!! 3 has usually an extreme price action, but to confirm we need a micro 5 up and a correction for the completion of (1) & (2) in 3
GETTEX:DN3Long
by darth.stocks
Updated
22
NOW Servicenow Service Now - Long scenarioI bought Service Now here. Building up a first position. There is a scenario where the two equal lows may be broke first to reverse afterwards but i am a medium to long time investor / large seasonal swing trader maybe, so I dont need too exact entries and Servicenow is a Quality stock... this is not a trade call, no financial advice. for educational purpose only.... I d be happy about a like/rocket or comment and a chat with you guys!
GETTEX:4S0Long
by Amazing-Fractals
Updated
112233445566778899101011111212131314141515161617171818191920202121222223232424252526262727282829293030313132323333343435353636373738383939404041414242
…999999

Made by humans

Select market data provided by ICE Data Services. Select reference data provided by FactSet. Copyright © 2026 FactSet Research Systems Inc.Copyright © 2026, American Bankers Association. CUSIP Database provided by FactSet Research Systems Inc. All rights reserved. SEC filings and other documents provided by Quartr.© 2026 TradingView, Inc.

More than a product
  • Supercharts
Screeners
  • Stocks
  • ETFs
  • Bonds
  • Crypto coins
  • CEX pairs
  • DEX pairs
  • Pine
Heatmaps
  • Stocks
  • ETFs
  • Crypto coins
Calendars
  • Economic
  • Earnings
  • Dividends
  • IPOs
More products
  • News Flow
  • Portfolios
  • Fundamental Graphs
  • Yield Curves
  • Options
  • Macro Maps
  • Pine Script®
Apps
  • Mobile
  • Desktop
Community
  • Social network
  • Wall of Love
  • Refer a friend
  • House Rules
  • Moderators
Ideas
  • Trading
  • Education
  • Editors' picks
Pine Script
  • Indicators & strategies
  • Wizards
  • Freelancers
  • Paid Spaces
Tools & subscriptions
  • Features
  • Pricing
  • Market data
  • Gift plans
Trading
  • Overview
  • Brokers
  • Brokers comparison
  • The Leap
Special offers
  • CME Group futures
  • Eurex futures
  • US stocks bundle
About company
  • Who we are
  • Space mission
  • Blog
  • Help Center
  • Careers
  • Media kit
Merch
  • TradingView store
  • Tarot cards for traders
  • The C63 TradeTime
Policies & security
  • Terms of Use
  • Disclaimer
  • Privacy Policy
  • Cookies Policy
  • Accessibility Statement
  • Security tips
  • Bug Bounty program
  • Status page
Business solutions
  • Widgets
  • Charting libraries
  • Lightweight Charts™
  • Advanced Charts
  • Trading Platform
Growth opportunities
  • Advertising
  • Brokerage integration
  • Partner program
  • Education program
Community
  • Social network
  • Wall of Love
  • Refer a friend
  • House Rules
  • Moderators
Ideas
  • Trading
  • Education
  • Editors' picks
Pine Script
  • Indicators & strategies
  • Wizards
  • Freelancers
  • Paid Spaces
Business solutions
  • Widgets
  • Charting libraries
  • Lightweight Charts™
  • Advanced Charts
  • Trading Platform
Growth opportunities
  • Advertising
  • Brokerage integration
  • Partner program
  • Education program
Look FirstLook First