Long
Long
 Long
Long
Changes in the EU's Green Deal could spur growth for VolkswagenVolkswagen’s shares have been on a downward trajectory for about three years now, dropping by more than 50%. However, after finding a bottom (presumably) in October 2023, the company’s stock has been ticking higher and forming an upward-sloping channel. While it is yet to be seen whether these shares have really bottomed out, certain developments might boost the company’s outlook going forward. Due to mounting protests from farmers and others, discussions about the European Union’s Green Deal and its feasibility have emerged recently. It is becoming increasingly apparent that ambitious plans might not be achievable within the initial deadline set in the deal. Furthermore, the question of the cost of achieving these goals has become a major subject of talks among members of the European Parliament. So far, European lawmakers have scrapped some of the initial rules, mainly affecting the agricultural sector. Nevertheless, it is possible that phasing out of combustion engine cars and reducing emissions will undergo a similar reassessment that could positively affect European carmakers, including Volkswagen, which is somewhat behind in electrifying its fleet compared to its competitors.
Illustration 1.01
Illustration 1.01 shows the daily chart of Volkswagen stock. Currently, the price is trading near the lower bound of the upward-sloping channel that acts as a support. If this support holds, it will be positive for the stock in the short term.
Technical analysis gauge
Daily time frame = Slightly bearish
Weekly time frame = Neutral
*The gauge does not necessarily indicate where the market will head. Instead, it reflects the constellation of RSI, MACD, Stochastic, DM+-, ADX, and moving averages.
Please feel free to express your ideas and thoughts in the comment section.
DISCLAIMER: This analysis is not intended to encourage any buying or selling of any particular securities. Furthermore, it should not be a basis for taking any trade action by an individual investor or any other entity. Therefore, your own due diligence is highly advised before entering a trade.  Long
Long
 Long
Long
Long 
 Long
Long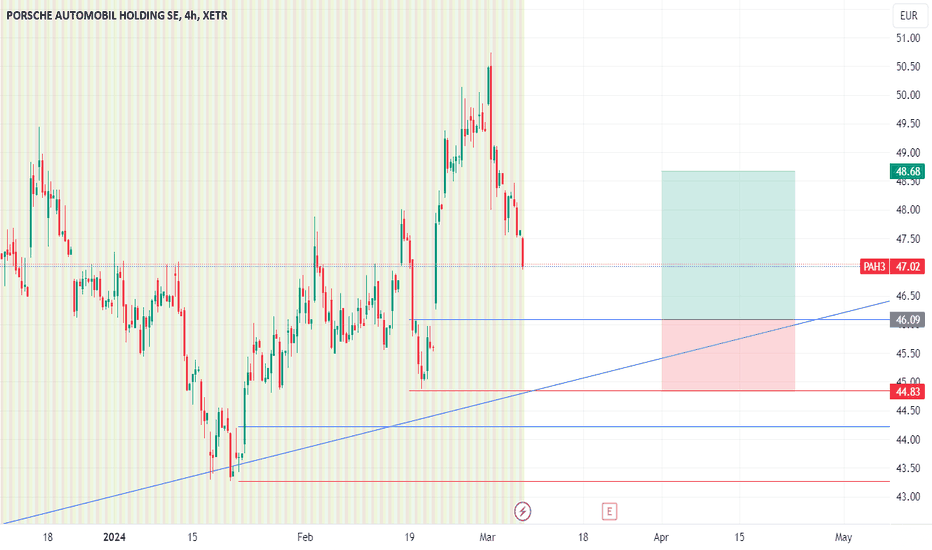
 Long
Long
Long 
 Long
Long
 Short
Short
Porsche Automobil Holding (PAH3): On the Fast TrackPorsche (PAH3): XETR:PAH3
Our analysis of Porsche Automobil Holding focuses on the stock's price movement since the lows during the COVID-19 crisis at 28.48 EUR. Since then, Wave (1) in blue has expanded to 102 EUR, currently serving as a local high. Subsequently, a remarkably unusual and complex Wave (2) has been observed, which appears atypical at first glance. Upon closer examination, this phase is identified as a flat correction, which falls just above the 78% level, slightly insufficient for a regular flat. In Elliott Wave analysis, as well as in other analyses, it is sometimes necessary to stretch certain rules to reach a conclusion. Whether this is invalid or not is difficult to say at this point.
Currently, the stock suggests that Wave C in red has not yet been fully completed, as the extension of Wave (iii), as expected, took a corrective trend reversal at 41.48 EUR. If this is the case, we are currently witnessing the formation of Wave (iv), with the stock possibly falling one last time with Wave (v) before finally bidding farewell to the overarching Wave (2). The exact timing for this remains open and uncertain. However, as long as Wave 1 does not become invalid, a downward trend is expected for Porsche stock. Potential significant entry points for us could lie in a retest of the Wave (iii) area at 41.90 EUR or even lower. The exact coordinates are yet to be determined, but until then, we anticipate a declining price for Porsche stock. Long 
FlatexDEGIRO - Technical AnalysisA flatex degiro follows an upward trend, with a oblique trendline that has served as support for it twice, in October 2018 and in October 2022.
In the steepest declines it experienced, it corrected in both instances to the algorithmic level of 0.79, both with the confluence of an order block on the 3-month timeframe:
The price, since it made the recent low at 5.58, reversed and started an uptrend, respecting the bullish arrays and retracing to the expected algorithmic levels (0.5/0.618). It struggles with the resistance of a monthly bearish FVG, which it has already touched and reacted to four times without fully breaking it.
In the weekly timeframe, it can be observed that the price is currently retracing from the last reaction at the mentioned bearish FVG. It came to the 0.5 retracement level. Despite having a propulsion block below with confluence of algorithmic levels 0.705/0.79, there isn't much liquidity in the recent upward movement to rebalance, as the movement was executed fairly.
So far, the price remains bullish in the long term, respecting the bullish arrays on higher timeframes. It gave a positive signal by recently breaking structure. Looking ahead, the price range between 15.10 and 18.66 appears to pose some resistance.
 Long
Long
 Long
Long
Long 
Rheinmetall - the time for profit-taking has comeThe ongoing war in Ukraine has driven Rheinmetall's stock to new record highs since 2022. Today, unexpectedly aggressive remarks from French President Macron led to a volatility explosion, which could signal the end of the uptrend. Year-to-date, the German arms manufacturer's stock has risen by more than 72%. A double top formation is evident in the OBV, which is noteworthy as the OBV has consistently confirmed the previous increase. Therefore, in our view, a good opportunity for profit-taking in Rheinmetall stock has arisen. Here we present a short idea, but we emphasize that Rheinmetall's stock is in a very strong uptrend, making short positions particularly risky. Nonetheless, in our opinion, investors should consider realizing at least a substantial portion of their profits at this price level.  Short
Short
Porsche Automobil Holding (PAH3): On the Fast TrackPorsche (PAH3): XETR:PAH3
Our analysis of Porsche Automobil Holding focuses on the stock's price movement since the lows during the COVID-19 crisis at 28.48 EUR. Since then, Wave (1) in blue has expanded to 102 EUR, currently serving as a local high. Subsequently, a remarkably unusual and complex Wave (2) has been observed, which appears atypical at first glance. Upon closer examination, this phase is identified as a flat correction, which falls just above the 78% level, slightly insufficient for a regular flat. In Elliott Wave analysis, as well as in other analyses, it is sometimes necessary to stretch certain rules to reach a conclusion. Whether this is invalid or not is difficult to say at this point.
Currently, the stock suggests that Wave C in red has not yet been fully completed, as the extension of Wave (iii), as expected, took a corrective trend reversal at 41.48 EUR. If this is the case, we are currently witnessing the formation of Wave (iv), with the stock possibly falling one last time with Wave (v) before finally bidding farewell to the overarching Wave (2). The exact timing for this remains open and uncertain. However, as long as Wave 1 does not become invalid, a downward trend is expected for Porsche stock. Potential significant entry points for us could lie in a retest of the Wave (iii) area at 41.90 EUR or even lower. The exact coordinates are yet to be determined, but until then, we anticipate a declining price for Porsche stock. Long 
 Long
Long
 Long
Long
 Long
Long
Long