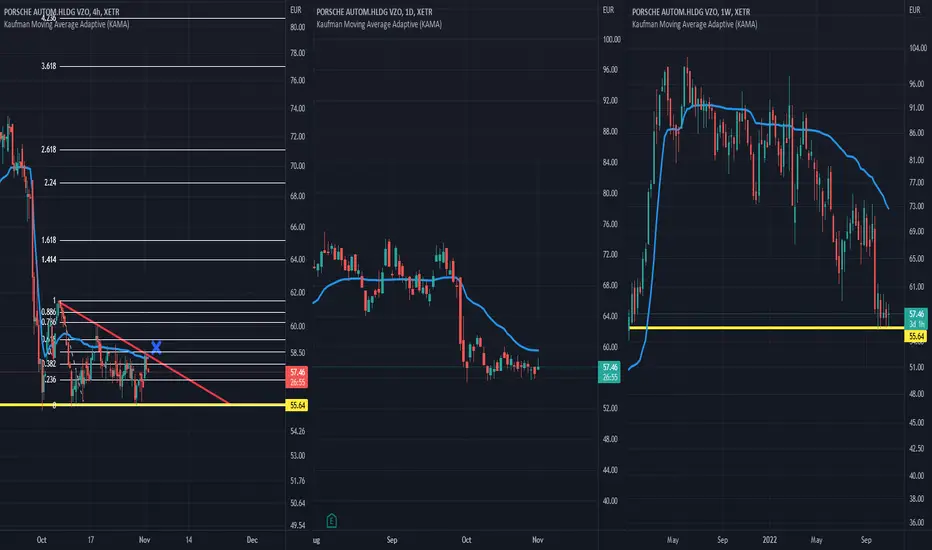
Porsche: Ready to Race?Instead of stepping on the gas pedal, the Porsche stock corrected as soon as it touched our tourqoise target zone. We predict that the course continues to drop into the red zone between 56.44€ and 44.06€, until it completes the red wave (2). Following the correction, the trend should head towards the resistance at 69.20€.
In an alternative scenario with a 35% chance, the Porsche stock has the opportunity to push for a rapid turnaround now and exceed the 69.20€ resistance mark to gain further pa
Volkswagen (VOW3.de) bullish scenario:The technical figure Triangle can be found in the daily chart in the German company Volkswagen AG (VOW3.de). Volkswagen AG, known internationally as the Volkswagen Group, is a German multinational automotive manufacturer. The company designs, manufactures and distributes passenger and commercial vehicles, motorcycles, engines and turbomachinery, as well as offering related services, including financing, leasing and fleet management. In 2016, it was the world's largest automaker by sales, and kee
Broadening rising wedge - and company future perspectiveAfter the DMP Stock touched and rebounced from it's 52-Week support at 36,00€, it is now creating a broadening rising wedge formation. As from market perspective, this formation can be attributed to high uncertainty as well as worsening growth perspective for the Euro-Zone.
Mid-term perspective for the stock is bearish. Rising broadening wedge will most probably break downwards and reach statgnation at support (36,00€).
Nevertheless, this formation can be exploited to do swing-traiding.
Keep in
Adidas - Outlook downgrade supports a bearish thesis Adidas is another company confirming what we laid out some time ago - a trouble brewing during the current earning season, supporting our notion about the stock market progressing in the second stage of the downtrend. That being said, the company reported its quarterly earnings, after which the stock fell approximately 10%. The report highlighted deteriorating demand and adjustment of the outlook for the rest of 2022 while also pointing out a build-up in inventories. We expect the same trend to
#SIEMENS long idea (+25%?)Hello dear Traders,
Here is my idea for #SIE
Price closed above yellow line (previous month high)
Price closed above purple trigger line to enter trade.
Targets marked in the chart (black lines)
Invalidation level marked with red line
Good luck!
❤️Please feel free to ask any question in comments. I will try to answer all! Thank you.
Please, support my work with like, thank you!❤️
Short-term buy until EUR 60 before falling down to EUR 40.The Elliott-Wave patter appears to be drawn on current Bayer 1h chart. Longterm, after reaching EUR 60 and going down and touching the 40 EUR area, I expect Bayer to recover and aim for its pre-Covid high of around 80 EUR. Fundamentally Bayer is undervalues, also when it comes to some new products that are in the process of being legalized.
longterm buy, short-term sell After the complete 1-5 Elliot-Wave and the correction wave Bayer is still not in an upward trend. Despite Bayer's technical improvement, the stock is still not in an upward trend, and lower lows are not excluded in the coming quarters.
Currently, it appears that Bayer is beginning to move higher, and €46 in October may have represented a bottom. Although we shouldn't get too excited yet, since Bayer isn't technically in an upward trend until the stock moves above the last high of €74 (June 2020)