• Products
  • Community
  • Markets
  • Brokers
  • More
Get started
  • Markets
  • /Germany
  • /Stocks
  • /Ideas
palantir on the downPalantir Technologies is a public American company that specializes in big data analytics. The company’s stock has been volatile in the past, and some investors believe that it is overvalued. Additionally, the company’s listing on the Nasdaq Global Select Market is currently in question due to the exchange’s disapproval of the company’s plan to consolidate the financial results of Canopy USA at one point. If Canopy chooses to continue with its plan and speed up its entry into the U.S. cannabis m
XETR:PTXShort
by ralffritz21
Breakout of the wedge on the support.In the figure, you can see the support marked with a purple color, which is the defense of the previous LOW. There is also a wedge on this support. If the trend line is broken, and the wedge is broken at the same time, there is a possibility of entering a trade and achieving a risk to reward ratio of four to one.
XETR:P911Long
by czasnaefekty
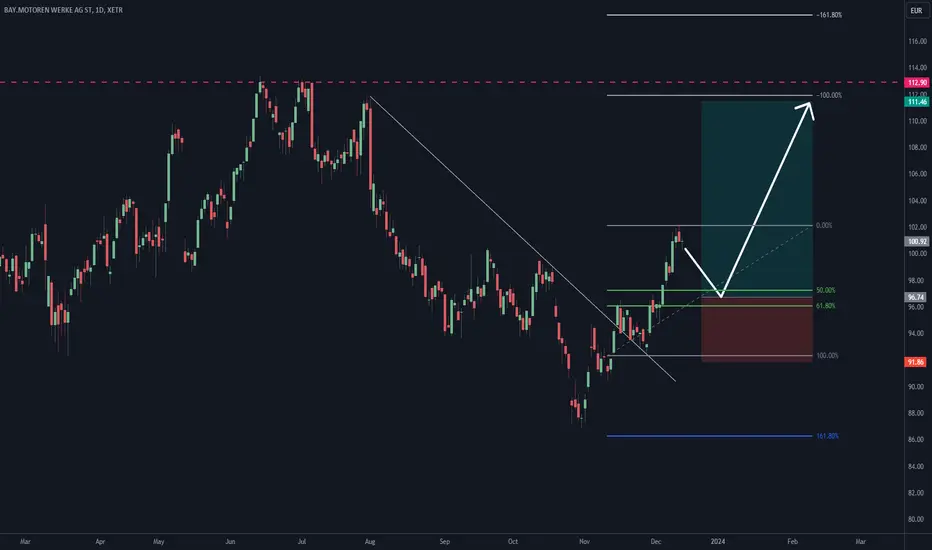
[Scenario] I am waiting for a correction to the 50% Fibonacci retracement, then there is a possibility of entering with a risk to reward ratio of three to one. Remember that you can create many scenarios in the market. This is just one of the possibilities. I am waiting for it because it will be a kind of entry after the correction, there will also be a retracement of our movie, and a probable conference of the trend line and clouds, which already gives us several confluences in one trade. Therefore, th
XETR:BMWLong
by czasnaefekty
ENR halfway to partial recovery, mid-term, still time to runTo Mid and long term investors: (day traders, swingers, flippers and gamblers...this is not for your weak hearts) The stock never really had meaningful reasons to devalue. Just rumors behind a solid company with plenty of assets and cashflow. Hard times with energy wars waging and still new plans for expansion are being drawn in Starnberger lake houses. Hopefully the full acquisition of GAMESA will clear the path to renewables, which are the future considering all the pledges to go carbon neutra
XETR:ENRLong
by DGDM
Updated
Sell opportunity for MBG (Mercedes Benz group)Hello guys There is sell order in MBG stock . I hope you enjoy it
XETR:MBGShort
by mosadeqbahrami
2
G24 Long SwingJP Morgan announces their optimistic insight about European Internet Stocks. -Consolidation area. -High volume bullish breakout. -Confirmative pullback. TP on a previous reference point. SL below the pullback low. r/r 3-5 based on the reference point used.
XETR:G24Long
by koumkouat
VW to target 136 after crossing 119Daily chart, the stock is forming a chart pattern, and after crossing the resistance line (blue) at 119, the target will be 136 soon Technical indicators RSI and MACD support this view. Stop loss 117 to be considered
XETR:VOWLong
by snour
Updated
4
$MBG after a great fall comes the revival.MBG showing extreme SHORT moves past couple weeks. We can clearly see a strong band between 50$ and 57$. It seems like LONG positions entered anywhere in this area would generate a good profit. Be aware that this would be a "Buy and forget for a couple of weeks." trade.
XETR:MBGLong
by KaanUralAksu
Updated
2
AIXA • AIXTRON SE • XETRA LONG TF H4#AIXA • AIXTRON SE • XETRA LONG TF H4, TP = 33.40 , SL = 25.80 The trend continues, the nearest support level according to my calculations TP = 33.40
XETR:AIXALong
by MagyarPenztarca
Updated
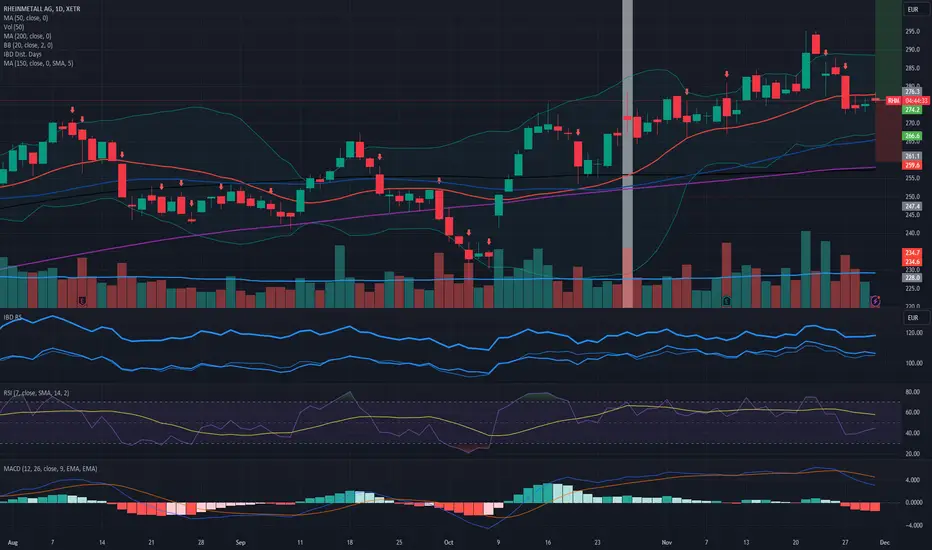
Momentum, Growth and Innovation: RHMWe have just added a new position (RHM) to our 'Growth, Momentum and Innovation' portfolio with 11% of total equity. Here is the link to our updated portfolio, which is up > 18% in the last month: www.tradingview.com Technical Analysis According to Minervini’s Principles Trend: Rheinmetall's stock should be evaluated against the major moving averages. Minervini looks for stocks trading above their 50-day and 200-day moving averages to indicate an overall uptrend. If RHM is above these avera
XETR:RHMLong
by JS_TechTrading
2
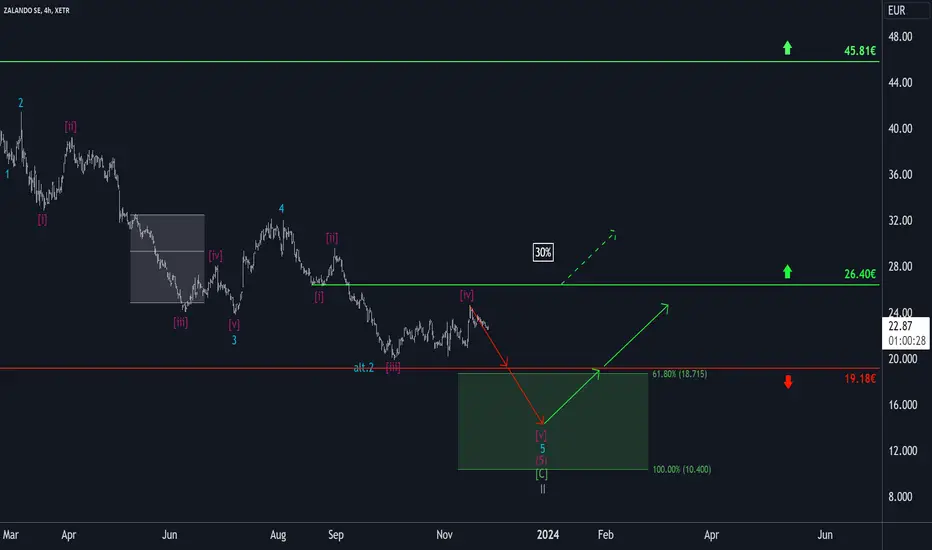
Zalando: Final Stage 🏁Zalando's stock price retreated last week, so we consider the high of the magenta wave (iv) to have been reached. We therefore locate the price in the last stage of the gray wave II and expect a descent to the green Target Zone between €18.71 and €10.40 before this movement is completed. Long entries could be made here. However, there is also a 30% probable alternative, which would see a further rise should the price exceed the resistance at €26.40.
XETR:ZALLong
by HKCM_Global
BAS • BASF SE • XETRA LONG TF H4#BAS • BASF SE • XETRA LONG TF H4, TP = 46.46 , SL = 40.20 The trend continues, the nearest support level according to my calculations TP = 46.46
XETR:BASLong
by MagyarPenztarca
AFX • Carl Zeiss Meditec AG • XETRA LONG TF H4#AFX • Carl Zeiss Meditec AG • XETRA LONG TF H4, TP = 98.90 , SL = 72.48 The trend continues, the nearest support level according to my calculations TP = 98.90
XETR:AFXLong
by MagyarPenztarca
AMZ • Amazon.com • XETRA SHORT TF M30#AMZ • Amazon.com • XETRA SHORT TF M30, TP = 125.10 , SL = 136.16 The trend continues, the nearest support level according to my calculations TP = 125.10
XETR:AMZShort
by MagyarPenztarca
1COV • Covestro AG • XETRA LONG TF H1#1COV • Covestro AG • XETRA LONG TF H1, TP = 51.31 , SL = 45.70 The trend continues, the nearest support level according to my calculations TP = 51.31
XETR:1COVLong
by MagyarPenztarca
DHL: The low has been delivered 📦Due to the current upward movement of the DHL share, we now consider the low of the green wave (1) to have been reached. Consequently, the share price is currently already in the green wave , which is likely to continue for some time. We expect this wave to end below the resistance level of €47.05 and thus the start of a new downward trend.
XETR:DHLLong
by HKCM_Global
1
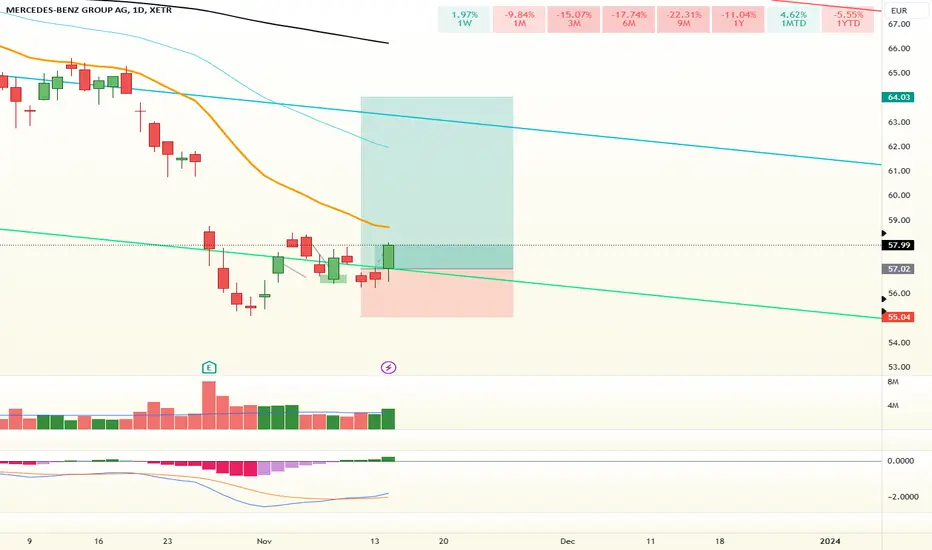
MERCEDES-BENZ Long IDEA The stock seems to have support here with a developing cup & handle patten which will target gap close at 61.40 Bullish MACD crossover Buyzone: 57-56 Stoploss: 55 A **Cup and Handle** pattern is a technical chart pattern that resembles a cup with a handle, where the cup is in the shape of a "u" and the handle has a slight downward drift. This pattern is considered a bullish signal, extending an uptrend, and is used to spot opportunities to go long. Here are some key points to consider w
XETR:MBGLong
by Trader-Dan
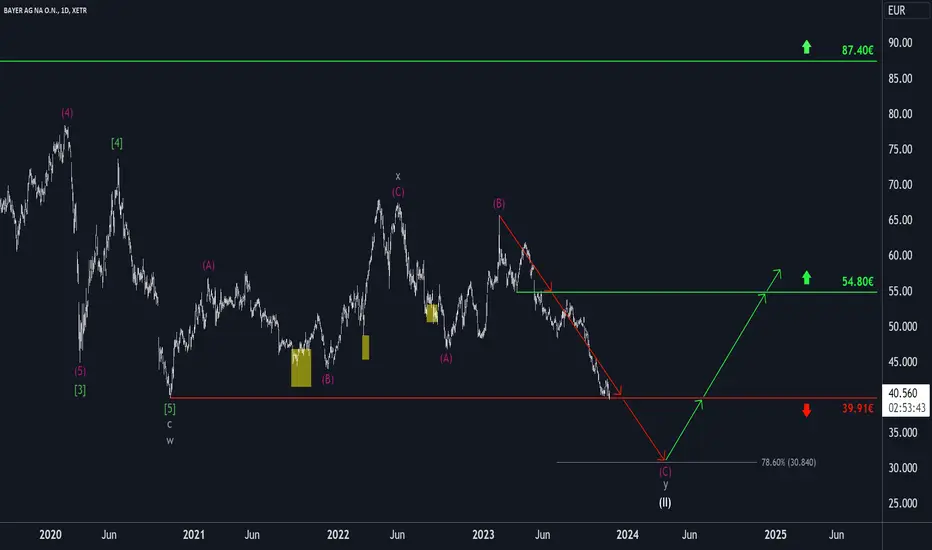
Bayer: Down the hatch! 🍺After Bayer's stock recently tried to break through the support level of €39.91, it has now made another attempt. Whether the stock succeeds in sustainably breaking below this support level - as envisaged in our primary scenario - or whether it needs further impetus in the form of a corrective upward move is irrelevant for the further course of our expectations. We therefore fully expect a sell-off below this level, as we expect the low of the major wave (II) correction underway since 2015 to be
XETR:BAYNShort
by HKCM_Global
1
$BMW on spike with reverse cup and handle.The red line indicates a good resistance spot confirmed by monthly price movements. The arc represents the reverse cup and handle that formed in the daily chart. After a wild downwards move BMW came to a good retest area of the this resistance. A good SHORT position is what i expect. On the other hand this area showed bounces in the past too so it wouldn't be surprising if we see a reversal. But mainly my expectations is within the SHORT side.
XETR:BMWShort
by KaanUralAksu
1
SAP vs. MSFTXETR:SAP shows a strong correlation to NASDAQ:MSFT , which on the surface is not very surprising. But comparing fundamental data and the general company profile can lead to some raised eyebrows. In my view NASDAQ:MSFT appears to be a much stronger company, which should have little problems capitalizing on the current AI hype for growth and also overall has a much more ubiquitous product portfolio. Meanwhile, the ongoing strength in the chart of XETR:SAP appears perplexing and one cannot
XETR:SAPShort
by bratenzwerg
2
Bavarian Motor Works (BMW) is going down from hereMonthly Time-Frame: --> Evening-Star --> target: around $72 --> 14-period Monthly RSI has steep downward slope and, like all the similar past situations, looks like a high probability of downward momentum Position: SHORT
XETR:BMWShort
by valaentius
Updated
BWD : Patience BWD : Patience Looking for the range bottom at 18eur. Following Tesla on the way up, in case this holds true would align with a bounce at 18Eur. Between 18eur and 9eur no retest happened a lack of liquidity can spiral price lower into this zone.
MUN:BY6Short
by Bavo_DB
RHM | Command and Conquer | 1 Buy scenarioOverview Rheinmetall had a great run specially fueled by the war in Ukraine. With an additional crisis forming in the Middle East i can see the price going further up. From a chart point we see that the current resistance (100% Fib Line) was 2 times pierced (yellow circle) but price never really broke it. The Buy zone is based on the confluence of the 50% Fib level and an already engulfed (blue circle) support level that lead to the current ATH / Swinghigh. Target 1: The First big resista
XETR:RHMLong
by trader_se
Sartorius: Target 180 Euro?After subsequent negative news, we see again a important floor broken and a falling knife movement. There are two different patterns indicating a move towards 180 or into a side movement corridor between 168 and 196 which is again 15 to 30% downwards potential. It's an ABC pattern (not a perfect one) as well as the side range which includes a local double top. The side range/ideal target of this is nearly the same as the ABC target: Approx. 182 Euro.
XETR:SRT3Short
by NDD46
123456789101112131415161718192021222324252627282930313233343536373839404142
…999

Made by humans

Select market data provided by ICE Data Services. Select reference data provided by FactSet. Copyright © 2026 FactSet Research Systems Inc.Copyright © 2026, American Bankers Association. CUSIP Database provided by FactSet Research Systems Inc. All rights reserved. SEC filings and other documents provided by Quartr.© 2026 TradingView, Inc.

SOC 2 CompliantGDPR Compliant
More than a product
  • Supercharts
Screeners
  • Stocks
  • ETFs
  • Bonds
  • Crypto coins
  • CEX pairs
  • DEX pairs
  • Pine
Heatmaps
  • Stocks
  • ETFs
  • Crypto coins
Calendars
  • Economic
  • Earnings
  • Dividends
  • IPOs
More products
  • News Flow
  • Portfolios
  • Fundamental Graphs
  • Yield Curves
  • Options
  • Macro Maps
  • Pine Script®
  • MCP Server
Apps
  • Mobile
  • Desktop
Community
  • Social network
  • Wall of Love
  • Refer a friend
  • Creator program
  • House Rules
  • Moderators
Ideas
  • Trading
  • Education
  • Editors' picks
Pine Script
  • Indicators & strategies
  • Wizards
  • Freelancers
  • Marketplace
Tools & subscriptions
  • Features
  • Pricing
  • Market data
  • Gift plans
Trading
  • Overview
  • Brokers
  • Brokers comparison
  • The Leap
Special offers
  • CME Group futures
  • Eurex futures
  • US stocks bundle
About company
  • Who we are
  • Space mission
  • Blog
  • Help Center
  • Careers
  • Media kit
Merch
  • TradingView store
  • Tarot cards for traders
  • The C63 TradeTime
Policies & security
  • Terms of Use
  • Disclaimer
  • Privacy Policy
  • Cookies Policy
  • Accessibility Statement
  • Trust Center
  • Security tips
  • Bug Bounty program
  • Status page
Business solutions
  • Widgets
  • Charting libraries
  • Lightweight Charts™
  • Advanced Charts
  • Trading Platform
Growth opportunities
  • Advertising
  • Brokerage integration
  • Partner program
  • Education program
Community
  • Social network
  • Wall of Love
  • Refer a friend
  • Creator program
  • House Rules
  • Moderators
Ideas
  • Trading
  • Education
  • Editors' picks
Pine Script
  • Indicators & strategies
  • Wizards
  • Freelancers
  • Marketplace
Business solutions
  • Widgets
  • Charting libraries
  • Lightweight Charts™
  • Advanced Charts
  • Trading Platform
Growth opportunities
  • Advertising
  • Brokerage integration
  • Partner program
  • Education program
Look FirstLook First