Long
Long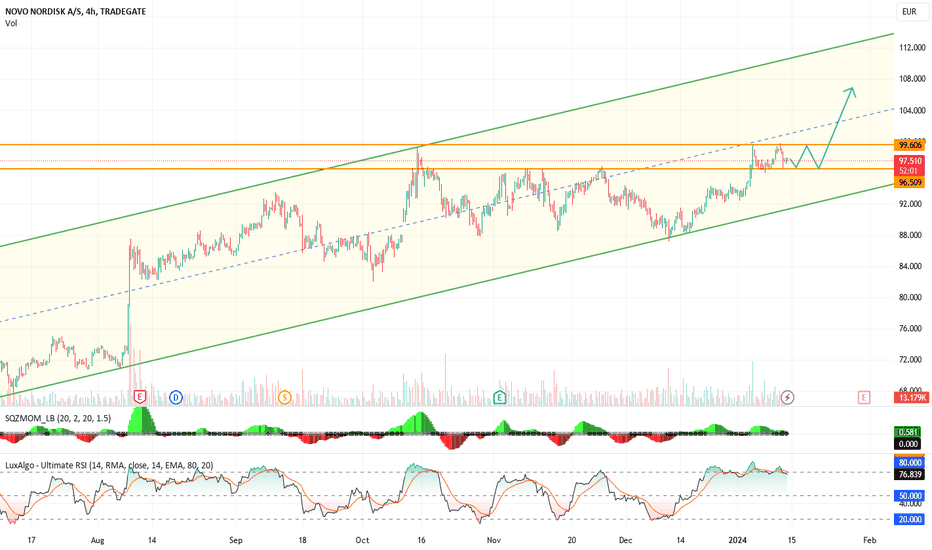
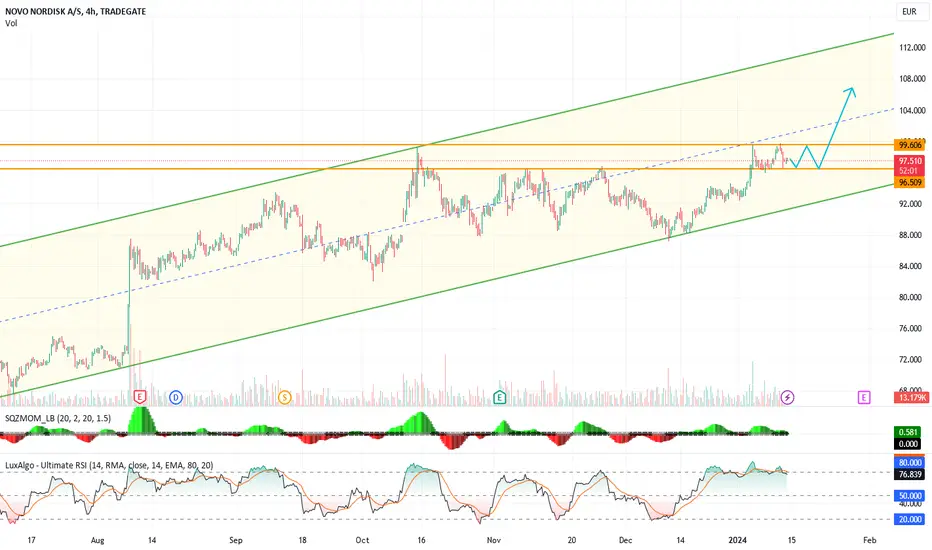
NOV Stock – An Investor’s Gold Mine?Over a billion people worldwide suffer from obesity. Physical exercise and various treatments often require a lot of effort and time to have any noticeable result. If a pharmaceutical company comes along and invents a magical drug that can help people lose weight without making any effort, that would undoubtedly revolutionize the industry.
This is essentially what happened when the pharmaceutical giant Novo Nordisk (XETR: NOV) released its weight-loss drug three years ago. The company’s market value has more than doubled, becoming bigger than the GDP of Denmark, its home country.
With recent expansions into the US obesity market, the upward trend is only expected to continue, to the point that some analysts believe Novo will join the trillion-dollar club in just a few years.
NOV Stock & the Obesity Market
Even though It’s common knowledge at this point that obesity is one of the biggest health issues facing adults in the US, the numbers can still shock you when you hear them. According to the CDC, obesity currently affects around 100 million adults and 14.7 million children. That’s approximately 61% of the total population. The costs resulting from obesity are also insane, accounting for approximately $147 billion in annual healthcare costs.
Obesity is often seen as a problem with an individual’s lifestyle or behavior. However, more and more people are coming to think of obesity as a disease that requires medical intervention, at least in some cases.
An important step in this direction was the American Medical Association’s recognition of obesity as a disease. Since then, big pharmaceutical companies have started the process of developing new weight-loss drugs that are safer and more effective than most available obesity products.
So, the current situation is that there’s a growing demand for obesity drugs, and the market is especially huge in the US. Experts estimate that around 15 million people in the US will be on obesity medication by 2030. Overall, the obesity drug market is projected by some analysts to be worth over $100 billion in less than ten years.
The obesity market is a gold mine for any pharmaceutical company capable of seizing the opportunity to develop an efficient drug to satisfy the ongoing demand. This is exactly what the Danish pharmaceutical giant Novo Nordisk has been doing with its new groundbreaking drugs, Wegovy and Ozempic.
The Magical Drugs
Both drugs were originally invented by the company to treat type 2 diabetes. This obviously means that they help control blood sugar. But by far, their most significant effect is their ability to manipulate hunger signals to the brain. This tricks the body into feeling full and slows the stomach’s emptiness rate. This effect has proven to be magical for people attempting to lose weight. Over time, studies have shown that both drugs reduce body weight by 15%. For a person suffering from obesity, this number can mean the difference between life and death.
The Food and Drug Administration approved Ozempic in 2017 for diabetes and Wegovy in 2021 for obesity. In 2022, they were joined by a new drug named Mounjaro, also introduced as a diabetes treatment with the same effects on appetite that result in significant weight loss. Novo filed for the FDA’s approval for obesity treatment and got it in November of 2023.
The effects of these drugs have been described as miraculous. Some claim that their appetite dropped so much that they started saving hundreds of dollars per month on food because they stopped ordering takeout.
The success of the drugs has also been reflected in the company’s staggering quarterly reports. Mounjaro sales, for example, saw a mind-boggling year-over-year increase of 6250% in Q3 2023, growing from merely $16 million to $1 billion.
This growth shows no signs of stopping anytime soon. Novo’s Q2 2024 reports beat expectations, with an overall increase of 31% in sales and to $33.71 billion. Net operating profit also strikingly moved up 37% to $14.89 billion. The company expected the sales growth to continue, predicting another 18% to 26% jump for the next quarter.
This only makes sense since the market is still in its infancy. The number of people actively benefiting from the drugs is less than 1% of the estimated total number of people suffering from obesity all over the world.
NOV Stock Recent Performance
The company’s recent growth has exceeded $505 billion in market value. The number is bigger than Denmark’s entire GDP, leading some to describe the country’s economy as powered mainly by this one company.
On a global scale, though, the company has fierce competitors. One of the obesity drugs making headway into the market is Eli Lilly’s Zepboud, which was approved in November of 2023. The US-based company is Novo’s main rival and the largest pharmaceutical company in the world, with a market cap of $612 billion.
Both companies are expected to be the first in the health industry to join the trillion-dollar club in just a few years.
But plans for expansion come with a host of pressing concerns that Novo must quickly address, which brings us to some of the risks you should be aware of if you decide to invest in the company’s stock.
First, it’s ironic that the drug has been very successful to the point that the company hasn’t been able to keep up with the increasing demand, the result being some supply chain issues.
For example, in late 2023, the company decided to cut the supply of starter doses of Wegovy to keep supplying people who are already taking the drug. The company expects the drug to remain restricted for some time into 2024, and has recently started easing the curb.
In response to the issue, Novo has been ferociously expanding its supply chain and investing in research and production facilities. In 2023 alone, the company invested more than $10 billion to deal with the problem. Given the drugs’ resounding success, investors probably shouldn’t worry too much about the cash burn resulting from these investments. The recently reported profits are more than enough to cover the expenses for many years.
Another issue that could slow down the company’s growth is the high price tag of the drugs, combined with the unfortunate fact that private and public insurers mostly don’t cover them.
Wegovy, for instance, costs $1,350 monthly, and Mounjaro isn’t much cheaper, with a price tag of $1,025 per month. Federal insurance programs like Medicare and Medigap don’t cover weight-loss medications by law, which has been the case since 2006. Though admittedly, some Medigap and Medicare programs for retirees do,
As for private insurers, they usually don’t cover drugs with the active ingredient contained in Novo’s products if they’re prescribed for weight loss only.
There’s reason to be optimistic when it comes to insurance, though. Recently, Novo released a multi-year study called SELECT, which shows that the company’s drugs are notably effective at preventing cardiovascular conditions, which can be worsened by diabetes or obesity.
If the drugs are approved by the FDA for cardiovascular treatment, it’s expected that many insurance providers will cover them if they are prescribed for this reason. Many insurance plans already cover some of the drugs when they’re prescribed for type-2 diabetes. So this will help many more people afford the drugs through insurance.
This is not to mention that the company is already making an effort to lower the prices, but this is probably going to take a few years, especially since it cannot even supply the drug at a satisfactory rate yet.
NOV Stock Forecast
Overall, these difficulties don’t seem to be particularly difficult to overcome. Even if the drugs remain expensive, the recent boom in sales will probably continue for the next few years, given how huge the market is. As for the supply issues, we’ve seen that the company has more than enough time and cash to handle them.
Patents for this kind of medicine have lasted ten years, so we can expect the company to keep growing until at least 2031. If the drug becomes available in pill form, which is an active research project for Novo, the patent will last ten more years, and we can safely assume that the upward trend will keep going until then. Overall, Novo could probably be the next gold mine for investors.  Long
Long
 Long
Long
Long 
 Long
Long
 Long
Long
Long 
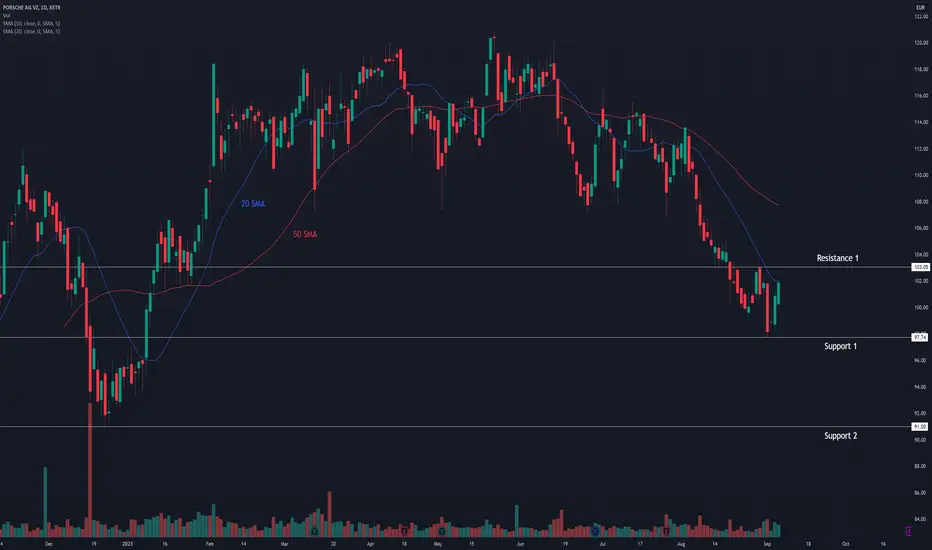
One luxury carmarker is down 20%, a buying opportunity?Although founded in 1948, Porsche became a public company in late September 2022. Initially, the company started to float on the market with an opening price of €84. However, shares rose as high as €120.80 in the coming months. Yet despite these impressive gains since the IPO, shares of the company began to decline in May 2023, losing about 20% of their value through the summer.
In its recent financial report, Porsche AG Group revealed that its operating profit rose 10.7% YoY and sales revenue 14% YoY in the first six months of 2023. Meanwhile, cash and cash equivalents decreased by 52% (by €2.466 billion to €2.244 billion), and the deliveries went up by 14.7% YoY to 167,354 vehicles, with increases in all sales regions. Based on the report, the biggest demand was for models Macan and Cayenne, with 46,842 and 46,399 cars sold, respectively.
Going forward, the company cited supply chain challenges related to auto parts and their quality while noting that risks associated with gas shortages and the Russia-Ukraine conflict decreased. On top of that, the report states: “The explanations on the liquidity risks presented in the risk reporting section of the 2022 combined management report remain unchanged… The overall conclusion that, based on the information and assessments currently available, a development jeopardizing the group’s ability to continue as a going concern is sufficiently improbable in the fiscal year 2023, remains unchanged."
Based on these and other factors, we consider Porsche shares attractive below €100 (with ideal entry around €90 to €92) for the long term (talking about years). However, at the moment, we believe it would be proper to start only with incremental purchases and leave some capital aside for better opportunities.
Technical analysis
Daily time frame = Bearish
Weekly time frame = Bearish
Please feel free to express your ideas and thoughts in the comment section.
DISCLAIMER: This analysis is not intended to encourage any buying or selling of any particular securities. Furthermore, it should not be a basis for taking any trade action by an individual investor. Therefore, your own due diligence is highly advised before entering a trade. Long 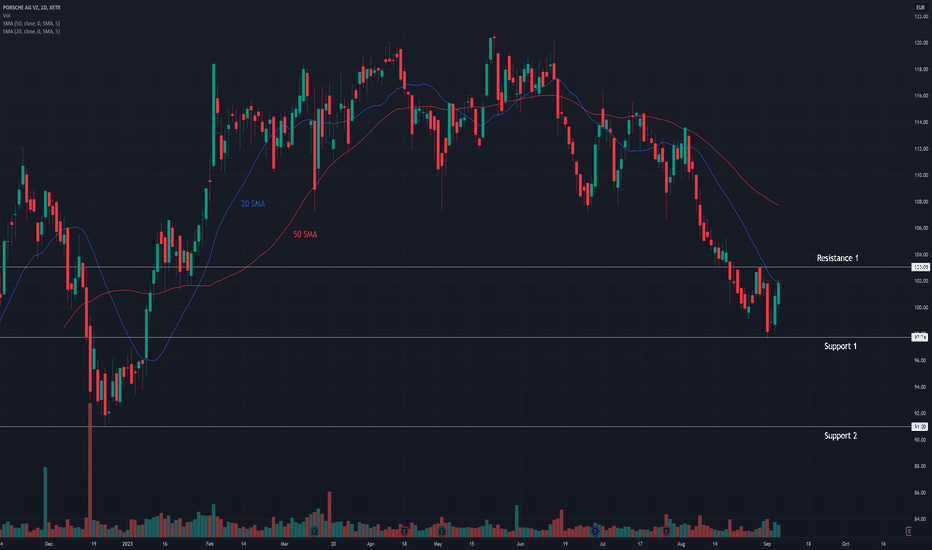
 Long
Long
Long 
KWS SAAT SE & CO. KGAA - Long opportunityAccording to the Elliott Wave Theory, KWS is currently showing potential for a rally, coinciding with the beginning of a new long-term impulse. Since September 2018, KWS has been undergoing a correction, graphically represented by the drawn ABC. The C wave is not yet complete, but the final 5th wave is underway and forming a wedge pattern. Its completion could coincide with the breaking of the wedge. In this case, it would signal the end of wave 5 < wave C and the beginning of wave 1 < wave 1 of a new impulse. Moreover, another reversal signal is provided by the divergence between RSI and the price.
The entry point for this trade should be the breaking point of the wedge, approximately €53 - €53.5, or the breaking of the 56.22 level of the RSI. I am going to set a stop loss 1.5% below the first static support, at €49.65. The first take profit is set at €61.1 (a profit of 14.2%). This is considered a prudent scenario, in case the breaking of the wedge forms wave 4 < wave 5 < wave A. Otherwise, it is possible to play this trade with a trailing stop loss and see if the price could reach the first important resistance at €67.5 (a profit of 26.17%).
NB: trade with €€€ (it could be a chance to diversify)
 Long
Long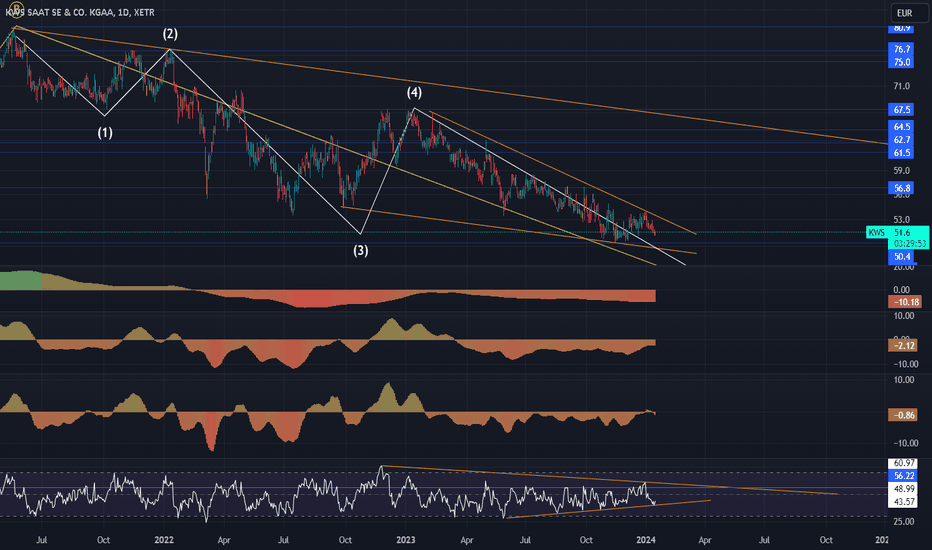
 Long
Long
 Long
Long
Long 
 Long
Long
 Short
Short
Long 
 Long
Long