Long
Long
 Long
Long
SAP has exited an uptrend and is now forming two peaksSAP has exited an uptrend and is now forming two peaks. I would not call this a double-top formation since there is no supporting evidence in the volume. However, one should be aware that the price has support around 213 (see also the 3-year volume profile). If the support holds, this is positive for the price. But if there is a breakdown with increased volume, it would be a sell signal in the medium term (1–6 months) for investors with that time horizon.
The price currently has negative momentum as it is trading below all moving averages (50, 100, 200), the Ichimoku cloud, and the RSI 21 is trending downward.
Fundamental analysts remain broadly positive on the stock. My assessment is that the valuation has been too high for some investors, prompting profit-taking. Whether the valuation — with a P/E of around 40–50 — is still considered too high remains to be seen. It should also be noted that while annual results are positive, they fluctuate significantly.
Disclaimer: I hold a position in SAP. I do not use a stop loss regarding a potential breakdown below 213, but I have set an alert. I will only consider selling if there is a breakdown with strong volume, and in that case I would look to buy back at a lower level. My overall position is long on SAP.
Commerzbank hardens its defense against UniCredit’s takeover bidBy Ion Jauregui – Analyst at ActivTrades
Commerzbank has intensified its defensive offensive against the public takeover bid launched by UniCredit, in a corporate battle that has become one of the main focal points of the European financial sector. The German entity has formally asked its shareholders to reject the proposal from the Italian bank, arguing that the operation significantly undervalues Commerzbank and presents high strategic and operational risks. UniCredit officially launched its offer in May with a valuation close to €35-39 billion, depending on the evolution of its share price. The proposal consists of an exchange of 0.485 UniCredit shares for each Commerzbank share. Taking UniCredit’s closing price prior to the formal launch of the offer as a reference, the proposal implied an approximate valuation of between €30.8 and €31.1 per Commerzbank share. However, shares of the German bank have traded above €34-35, even positioning themselves above the implied price of the Italian offer. This market behavior reflects that part of the market expects an improvement in the terms of the operation or considers it likely that UniCredit will end up increasing its stake through additional market purchases.
Currently, UniCredit controls close to 30% of Commerzbank’s capital between direct participation and financial derivatives, while voting rights linked to additional positions raise its potential influence to approximately 38.9%. The German government continues to be one of the main obstacles to the operation. Berlin maintains around a 12% stake in Commerzbank since the 2008 financial rescue and has repeatedly shown its rejection of a hostile absorption by the Italian group. Commerzbank’s management maintains that the entity can generate more value independently and recently presented new strategic objectives through 2030 to reinforce that narrative among shareholders. The bank also announced internal adjustments and cost reductions to improve profitability and strengthen its stock market position.
CBK Technical Analysis
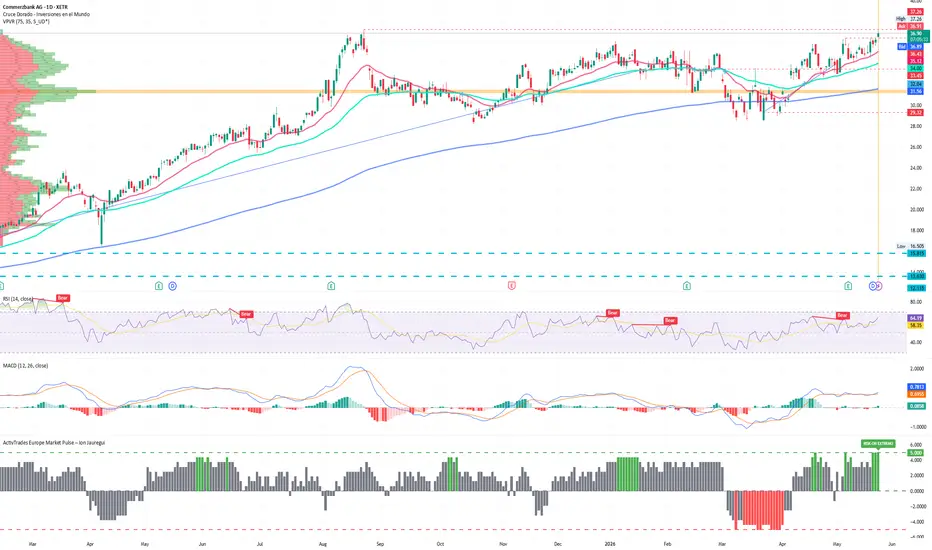
Shares of XETRA started the session with a strong bullish bias following the market’s positive reaction to the defensive measures adopted by the entity against UniCredit’s offensive. During the first trading hour, the stock moved around €36.85-36.87, remaining close to recent highs and consolidating the buying pressure seen over recent weeks. From a technical point of view, the price has managed to break above the key resistance located at €36.43, corresponding to the highs recorded on May 7. This breakout leaves the stock with room to attack the April 22 highs area, whose breakout would confirm the continuation of the dominant bullish structure.
If a solid breakout above those levels is consolidated during the coming sessions, the market could begin pricing in an extension scenario toward the psychological €39 area, potentially entering free upward movement. This move would also reinforce Commerzbank’s market capitalization in the middle of its defensive process against the takeover bid, increasing its financial and negotiating capacity against UniCredit.
The technical structure continues to be supported by moving averages clearly oriented upward since mid-April, reflecting a positive underlying trend. The RSI remains in overbought territory, although it still maintains an upward slope, indicating that buying momentum remains active despite the high accumulated acceleration.
However, the MACD is beginning to show certain signs of deceleration in momentum. Although the indicator remains in positive territory and its main line continues above the signal line, the histogram is beginning to lose intensity, suggesting a possible partial exhaustion of short-term momentum.
Below the current price, the market maintains a relevant technical support zone between €33.45 and €29.32, where the point of control (POC) is also located around €31.24, a level that concentrates high trading volume over recent months. If the stock loses strength after the latest gains, a corrective movement toward the €33.45 area before attempting a new bullish extension cannot be ruled out.
The ActivTrades Europe Market Pulse risk indicator points to an extreme Risk-on environment for the third consecutive session, signaling a high overbought tendency in the European market.
From the market’s point of view, the operation is interpreted as a decisive test for European banking consolidation. Brussels has spent years defending the creation of large pan-European financial groups capable of competing with U.S. banks, but national political resistance continues to be one of the main limits for cross-border mergers. In the stock market, XETRA maintains a bullish evolution driven by corporate speculation and expectations of new negotiations. Meanwhile, BIT continues to be supported by solid financial results, although investors remain attentive to the impact that a large acquisition could have on its capital position and regulatory exposure.
*******************************************************************************************
The information provided does not constitute investment research. The material has not been prepared in accordance with the legal requirements designed to promote the independence of investment research and such should be considered a marketing communication.
All information has been prepared by ActivTrades ("AT"). The information does not contain a record of AT's prices, or an offer of or solicitation for a transaction in any financial instrument. No representation or warranty is given as to the accuracy or completeness of this information.
Any material provided does not have regard to the specific investment objective and financial situation of any person who may receive it. Past performance and forecasting are not a synonym of a reliable indicator of future performance. AT provides an execution-only service. Consequently, any person acting on the information provided does so at their own risk. Political risk is unpredictable. Central bank actions can vary. Platform tools do not guarantee success.
 Long
Long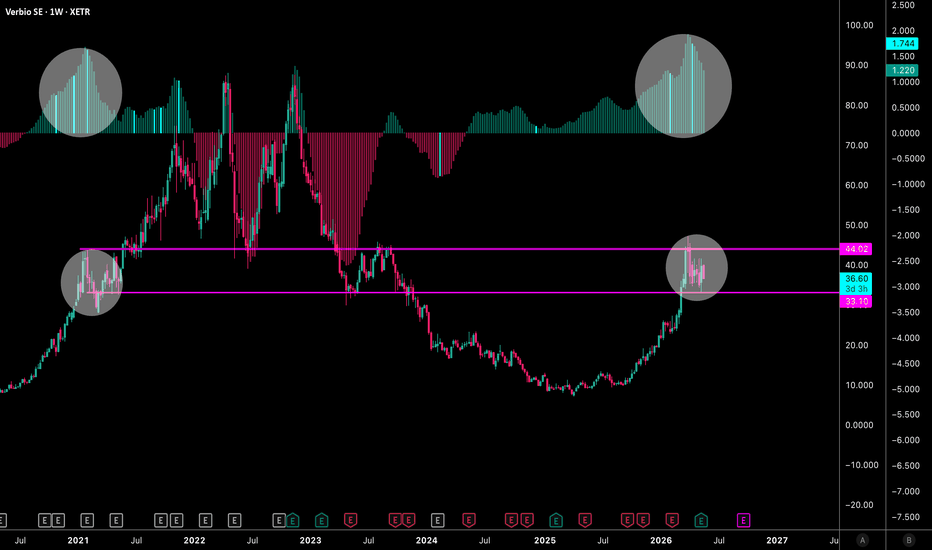
Volkswagen:While union tightens its stance,BYD arrives Dresden**Volkswagen (VOW3): While the union tightens its stance, BYD arrives in Dresden**
By Ion Jauregui – Analyst at ActivTrades
Volkswagen (VOW3) is once again at the center of the European market focus following recent reports on a potential industrial collaboration with BYD in Germany and growing tension between the group’s management and German trade unions.
The German manufacturer is going through one of its most challenging periods in recent years. The slowdown in demand in Europe, strong Chinese competition in electric vehicles, and the threat of new US tariffs are forcing the company to rethink its industrial structure.
## The union maintains its “red line”
According to Reuters, Volkswagen’s union representatives have reiterated their absolute rejection of plant closures in Germany, maintaining a firm stance against the restructuring plans pushed by group management.
The company is seeking to reduce production capacity to improve efficiency and protect margins, particularly in a context where the European industry is facing overcapacity against weaker demand.
However, IG Metall and the works council consider that any factory closures would represent a direct threat to German industrial employment, increasing political and social pressure on the manufacturer.
## BYD and the Dresden plant
At the same time, the market remains highly attentive to reports regarding BYD’s interest in partially using the historic Dresden plant, known as the *Gläserne Manufaktur*.
The factory stopped producing the ID.3 and currently some of its facilities have limited activity, which has fueled speculation about possible industrial agreements between Volkswagen and Chinese manufacturers.
Although Volkswagen has officially denied the existence of a definitive agreement, the possibility reflects the profound structural shift taking place in the European automotive sector. A few years ago, it would have been unthinkable for Chinese manufacturers to operate within historic German group facilities.
BYD’s potential entry also highlights the growing competitive pressure from China on European automakers, particularly in the EV segment, where Asian groups maintain significant advantages in production costs and battery development.
## The threat of US tariffs
This situation is further complicated by the commercial risk coming from the United States. The threat of imposing 25% tariffs on European automobiles could seriously affect German manufacturers such as Volkswagen, especially at a time when the sector is already facing margin deterioration and slower global growth.
The market fears that these trade tensions could force European companies to further accelerate industrial restructuring and cost-cutting processes.
---
## Technical analysis of VOW3
From a technical perspective, VOW3 continues to show a medium-term sideways structure after finding a double technical support in the impulsive zone formed in December 2024. The stock is currently trading within a wide consolidation range between €82.66 as key support and €98.76 as major resistance, while the most recent high remains at €109.15 recorded in December 2025. The uncertainty around the electric transition, combined with margin pressure and industrial costs, continues to limit the stock’s ability to develop a sustained bullish trend.
On the daily chart, a point of control zone stands near €91, where price action appears to have stabilised after recent volatility phases. The bearish moving average crossover remains in place, although the price has managed to trade sideways around the 50-day moving average, showing some short-term stabilisation.
In terms of indicators, RSI remains in neutral territory after recovering from oversold levels, while MACD is still below the zero line, although with a positive histogram, suggesting fading selling pressure without a clear return of bullish momentum.
Key resistance levels remain concentrated around the psychological €100 area, where institutional selling and profit-taking have previously emerged. On the downside, the €82–83 support zone remains the critical level to preserve the current medium-term sideways structure.
On the other hand, the ActivTrades Europe Market Pulse indicator showed a clear “risk-on” environment in previous weeks, driven by strong corporate earnings in Europe, supporting upside moves in companies such as Volkswagen. However, in the current session, the indicator has shifted back to a neutral reading, reflecting a more cautious market stance amid macroeconomic and sector uncertainty.
From a fundamental perspective, the potential rapprochement between Volkswagen and BYD at the Dresden plant adds a relevant strategic dimension. Although there is still no confirmed agreement, the market interprets this potential collaboration as a sign of industrial pragmatism: optimisation of underutilised capacity in Europe and indirect entry of Chinese manufacturers into the German production ecosystem. If materialised, this factor could act as an additional medium-term catalyst for the stock.
In the coming months, investors will remain focused on industrial agreements, union pressure, and the impact of US tariffs, all of which could define the next directional move for VOW3.
*******************************************************************************************
The information provided does not constitute investment research. The material has not been prepared in accordance with the legal requirements designed to promote the independence of investment research and such should be considered a marketing communication.
All information has been prepared by ActivTrades ("AT"). The information does not contain a record of AT's prices, or an offer of or solicitation for a transaction in any financial instrument. No representation or warranty is given as to the accuracy or completeness of this information.
Any material provided does not have regard to the specific investment objective and financial situation of any person who may receive it. Past performance and forecasting are not a synonym of a reliable indicator of future performance. AT provides an execution-only service. Consequently, any person acting on the information provided does so at their own risk. Political risk is unpredictable. Central bank actions can vary. Platform tools do not guarantee success.
 Long
Long
 Short
Short
VERBIO ahead of Q3 report Why Q3 Could Be the Inflection Quarter for Verbio SE
When management spoke during Q2, the biggest overhang was regulation.
CEO Claus Sauter repeatedly highlighted the uncertainty surrounding Germany’s implementation of RED III. That uncertainty has now materially changed.
In April 2026, Germany formally adopted RED III implementation, raising the greenhouse gas reduction quota from 12% in 2026 to 17.5% in 2027.
This step is designed to absorb the previously suspended carry-over volumes that will re-enter the market in 2027. Just as importantly, double counting of advanced biofuels has been abolished, directly addressing one of the largest distortions in the German THG market.
For Verbio, this matters enormously.
Management has previously indicated that roughly 70–80% of production is conventional biofuel that generate THG certificates. These before DC, was underpriced vs advanced fuels. With double counting now removed, the market is shifting from “paper compliance” toward real physical molecules.
The impact is already visible:
• THG 2026 contracts are trading around €470/t
• THG 2027 contracts have rallied from roughly €270/t to €375/t within weeks
That pricing action suggests the market is beginning to reprice actual scarcity of compliant renewable volumes.
Structural demand is no longer theoretical
One of the strongest comments from Sauter during Q2 may have been:
“Our raw materials do not have to pass through the Strait of Hormuz.”
That statement becomes even more relevant as geopolitical risk pushes fossil energy prices higher.
While crude markets remain exposed to Middle East supply disruptions, Verbio’s feedstock is regionally sourced biomass. That creates:
• More stable input costs
• Lower supply chain risk
• Potential margin expansion when fossil benchmarks rally
This is exactly the type of pricing asymmetry investors should focus on.
Operations: Multiple catalysts into Q3
Q2 already showed operational momentum:
North America
Nevada reached record production levels, despite extreme weather conditions.
If utilization continues to improve in Q3, North America could become a larger EBITDA contributor than consensus currently models.
Europe
Verbio reported record biodiesel production in Europe during Q2.
Additionally:
• Planned maintenance is now behind them
• Biodiesel production should normalize upward in Q3
• Higher THG pricing should support stronger realized margins
India
India remains an underappreciated optionality story.
Management continues ramping operations, but the bigger strategic question is the consortium for CBG (compressed biogas) plants.
India’s accelerating transport decarbonization framework—particularly its ethanol blending ambitions, could create a multi-year growth runway for Verbio’s technology and feedstock expertise.
Specialty Chemicals: The hidden growth engine
Another major development is Verbio’s specialty chemicals business, still on track for H2 2026 startup.
This should not be viewed as a margin story initially.
This is about:
• Revenue diversification
• Higher value-added products
• Reduced dependence on commodity biofuel cycles
If executed well, this could fundamentally change how the market values Verbio over time.
My Q3 view
My base case is that Q3 could be the quarter where operational execution finally meets regulatory clarity.
My estimates:
Q3 EBITDA: €60M+
Driven by:
• Higher THG pricing
• Higher Ethanol prices followed by higher crush margins
• Full benefit from removal of double counting
• Recovery in biodiesel production post maintenance
• Sourcing of rapeseed 2-3 months in advance before the biodiesel price took of due to war
• Continued US ramp-up
FY 2025/26 Guidance
Current market expectations may still be too conservative.
My upside case:
€150–200M EBITDA
If management confirms stronger spreads and demand visibility, I would not be surprised to see guidance move higher.
For most of the last year, Verbio was held back by regulatory uncertainty.
That uncertainty is now turning into policy support.
With:
• RED III now law
• Double counting removed
• THG prices repricing sharply
• Record production across multiple regions
• New chemical revenues approaching
Q3 could be the quarter where the market stops valuing Verbio on depressed trough earnings—and starts pricing structural earnings power instead.
A factual note: Q2 reported EBITDA was €30.1M, with H1 EBITDA of €45.5M, and management already firmed guidance upward after H1. Verbio also raised FY26 EBITDA guidance again in March 2026.
From here, the key question is no longer if demand returns.
The question is how quickly margins normalize.
This is analysis, not investment advice. Long 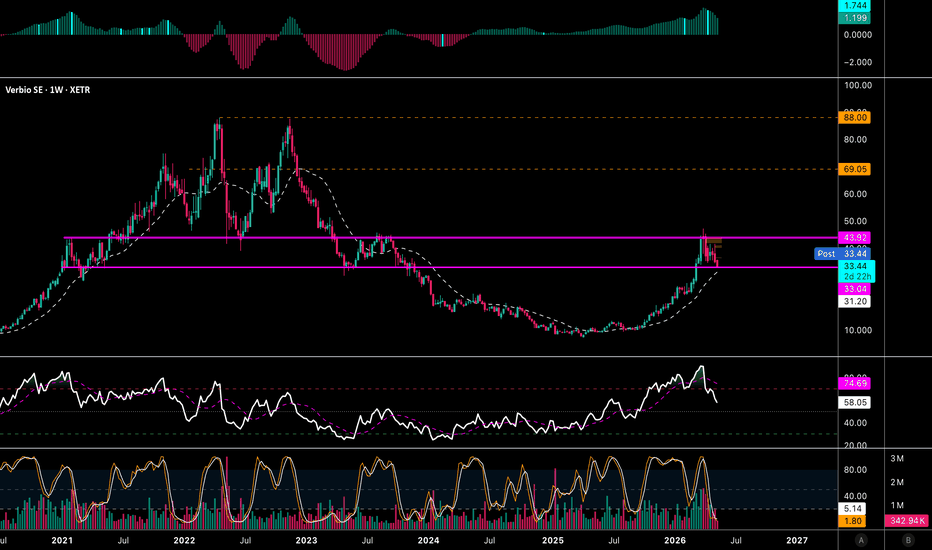
 Long
Long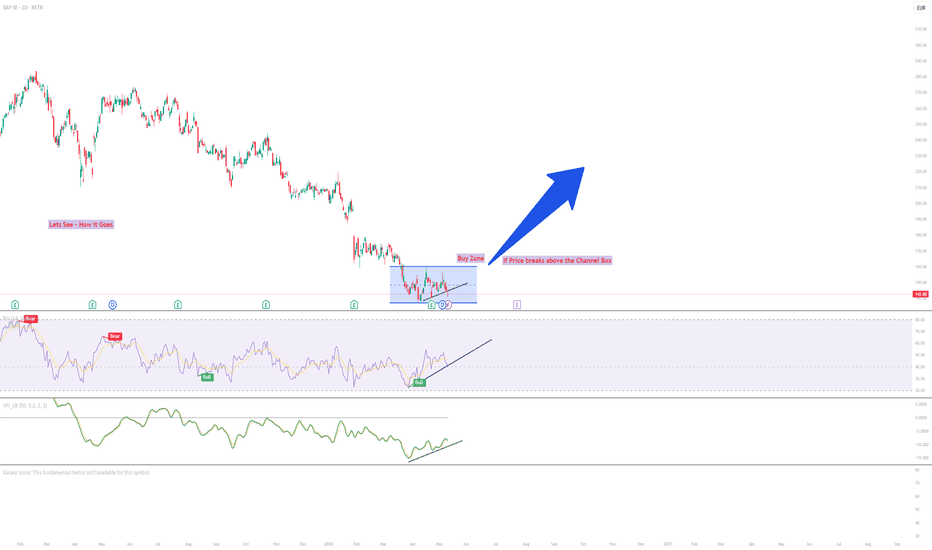
Commerzbank accelerates its restructuring amid UniCreditCommerzbank accelerates its restructuring amid UniCredit pressure
By Ion Jauregui – Analyst at ActivTrades
Commerzbank has intensified its defensive strategy against the advance of UniCredit, after announcing an efficiency plan that includes around 3,000 job cuts and an internal reorganisation aimed at strengthening profitability and its independent positioning.
The move comes in a context in which UniCredit has increased its exposure to around 30% of the capital, including direct holdings and financial instruments. From Commerzbank’s perspective, the integration project proposed by the Italian bank continues to be seen as insufficiently defined, with the German lender describing it as “vague”, referring to the lack of clarity regarding synergies and the integration model.
The German government, with a stake of approximately 12% inherited from the 2008 bailout, continues to play a relevant role in the development of the situation. Berlin is cautiously monitoring the rising foreign influence over a systemic national bank in a context of growing sensitivity around European financial autonomy.
UniCredit, for its part, argues that a potential integration would create one of the largest banking groups in Europe, delivering scale gains, cost reductions and greater competitiveness against major international financial institutions.
Fundamentals
On the fundamental side, Commerzbank has improved its financial profile in recent years, supported by the high interest rate environment in the eurozone and strict cost discipline. The bank has strengthened its net interest margin, improved capital ratios and increased profitability, which has reinforced institutional interest in the stock.
The bank also maintains relatively contained exposure to commercial real estate compared with other European peers, a relevant factor in a context of economic slowdown and tighter financial conditions.
The new efficiency plan aims to consolidate this improvement through further cost reductions and greater digitalisation, with the objective of strengthening earnings generation capacity without the need for corporate integration.
Key risks include macroeconomic weakness in Germany, credit slowdown, and the political and social impact of workforce adjustments. Nevertheless, the bank’s solid capital position continues to support its defensive profile within the sector.
Technical analysis of Commerzbank (Ticker AT: CBK)
From a technical perspective, ETR:CBK maintains a bullish structure in medium- and long-term timeframes, supported by both improving fundamentals and the speculative component linked to the corporate scenario involving UniCredit.
After reaching highs in January around €37.24, the stock entered a consolidation phase that led to support being tested twice in March around €29.32, forming a double-bottom structure. Since then, the stock has resumed an upward trend with higher highs and higher lows.
The price remains above the Point of Control at €32.05, with key support located around €33.45, preserving the broader bullish structure as long as buying interest persists.
The stock recently reached highs at €37.54, followed by a correction towards the €35.42–€35.44 area, reflecting profit-taking after the latest impulsive move.
In the short term, the technical outlook remains constructive as long as the price stays above the 50-period moving average. The 100-period moving average acts as an additional structural support. A break below €32 would represent a meaningful deterioration of the technical outlook, with downside risk towards March lows.
The RSI stands around 54.52, in neutral territory, while the MACD remains positive, although the histogram shows declining momentum. The ActivTrades Europe Market Pulse indicator reflects a moderation in risk appetite following the previous bullish phase, shifting towards a more neutral environment.
Relevant market dispute in 2026
The Commerzbank case remains one of the key corporate focus points in the European banking sector. The bank is reinforcing its independence strategy through efficiency measures, while UniCredit gradually increases its stake and keeps the option of a future integration open.
The outcome will depend on both market-driven factors and regulatory and political developments, with particular attention to the role of the German government and the evolution of the macroeconomic environment in Europe.
*******************************************************************************************
The information provided does not constitute investment research. The material has not been prepared in accordance with the legal requirements designed to promote the independence of investment research and such should be considered a marketing communication.
All information has been prepared by ActivTrades ("AT"). The information does not contain a record of AT's prices, or an offer of or solicitation for a transaction in any financial instrument. No representation or warranty is given as to the accuracy or completeness of this information.
Any material provided does not have regard to the specific investment objective and financial situation of any person who may receive it. Past performance and forecasting are not a synonym of a reliable indicator of future performance. AT provides an execution-only service. Consequently, any person acting on the information provided does so at their own risk. Political risk is unpredictable. Central bank actions can vary. Platform tools do not guarantee success.
 Long
Long
 Long
Long
LPK (1D) — LIDE breakout follow-through: +52.9% in two weeks XETR:LPK
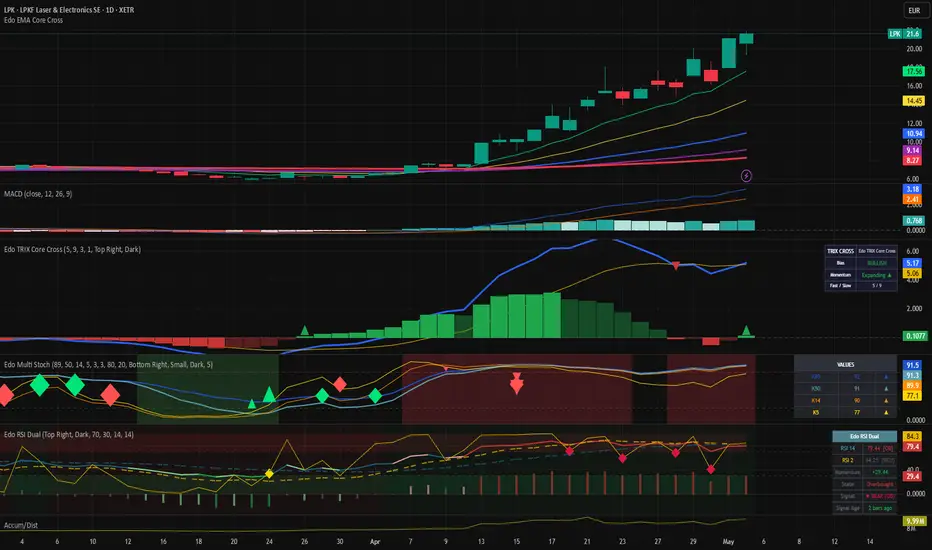
LPKF Laser & Electronics closes Friday May 5 at €21.40 after two weeks of follow-through on the structural breakout reported in the prior idea, () from April 23. Since that €14.00 close price has rallied +52.9 %, printing a fresh high at €21.90 on institutional volume and leaving the structural target at €26.80 still 25 % away. This note updates the multi-timeframe picture using the same methodology as the prior idea, now on Daily / 4H / 1H horizons, with non-essential layers removed (Liquidity Zones, SuperTrend, ZigZag) to focus the read on EMA structure, momentum (MACD, TRIX, RSI), saturation (multi stochastics) and flow (A/D + volume). Fundamental context remains intact: LIDE / glass-substrate narrative as a core piece of advanced packaging for AI chips, April 30 earnings already digested without negative surprise, and institutional accumulation confirmed in the Accumulation/Distribution flow.
Daily Analysis — close at €21.40 well above the full EMA stack: EMA9 17.52 / EMA20 14.43 / EMA50 10.93 / EMA100 9.14 / EMA200 8.27. All five averages hold positive slope with no bearish crossovers on any scale, clean 9>20>50>100>200 alignment. The price–EMA9 distance (~22 %) reflects the verticality of the post-breakout impulse: the daily candle on April 24 opened at 17.15 and closed at 18.85 on volume of 1.51M (5.5× the 60-session average), textbook institutional breakout confirmation above the 18.00 zone that had acted as ceiling since 2021. Daily MACD at 3.16 above Signal 2.41 with histogram +0.76 — momentum still expanding, no slope loss. Daily TRIX Fast 5.12 above Slow 5.05 with histogram +0.07 — bullish cross still alive. Daily Multi Stochastic in upper zone and embedded: Stoch 89 = 91, Stoch 50 = 91, Stoch 14 = 89, Stoch 5 = 76 — slows glued above 90 read as trend strength, not exhaustion, while the fast starts to relax. Daily RSI 14 at 79.2 — clear technical overbought. Daily RSI 2 at 83.4 — short-term extreme. Daily Accumulation/Distribution at +9.93M — institutional flow accumulating sustainably with no visible distribution. Macro read: primary and secondary trends fully bullish, breakout confirmed by volume and A/D, overbought present but consistent with a name in acceleration after liquidating years of bearish dominance.
4H Analysis — close at 21.40 with full EMA stack aligned: EMA9 20.10 / EMA20 18.62 / EMA50 15.61 / EMA100 12.76 / EMA200 10.36. The 18.62–20.10 cluster (4H EMA20–EMA9) is the operative reference for a first pullback, and the 15.61 step (4H EMA50) defines depth if the name needs to digest overbought before continuation. 4H MACD at 1.75 above Signal 1.56 with histogram +0.19 — still positive but the histogram stops expanding, first signal that the impulse loses acceleration even while preserving direction. 4H TRIX Fast 1.96 above Slow 1.58 with histogram +0.39 — bullish cross fully alive, no signs of bearish cross on the near horizon. 4H Multi Stochastic in extreme zone and embedded: Stoch 89 = 99, Stoch 50 = 98, Stoch 14 = 97, Stoch 5 = 93 — maximum saturation, but with all four levels glued up, classic signature of strong impulse breathing without losing pulse. 4H RSI 14 at 68.7 — high but not formally saturated above 70. 4H RSI 2 at 91.1 — short-term extreme. 4H Accumulation/Distribution at +5.77M, aligned with the daily read. Intermediate read: structure fully bullish, momentum still in favor but no longer accelerating, slow stochastics embedded validate that trend strength remains intact and that the probable pause is sideways or a healthy correction, not reversal.
1H Analysis — close at 21.40 with clean EMA stack: EMA9 21.20 / EMA20 20.60 / EMA50 19.15 / EMA100 17.38 / EMA200 14.74. Price practically resting on the 1H EMA9, the first operative intraday support. 1H MACD at 0.79 marginally below Signal 0.81 with histogram −0.024 — first negative histogram print since the impulse started, incipient bearish cross not yet fully confirmed. 1H TRIX Fast 0.41 below Slow 0.59 with histogram −0.185 — confirmed bearish cross on the hourly, short-term alert. 1H Multi Stochastic shows the first visible friction: Stoch 89 = 96, Stoch 50 = 95, Stoch 14 = 87, Stoch 5 = 81 — the fast (Stoch 5) has crossed below the classic (Stoch 14) on the latest leg, first bearish cross of the hourly macro. But the two slows (Stoch 89 and Stoch 50) stay glued above 95: fasts cooling while slows hold embedded — classic pattern of strong impulse breathing without reversing. 1H RSI 14 still high at 66.0, 1H RSI 2 already cooled to 45.0. 1H Accumulation/Distribution at +2.75M, no visible distribution. Intraday read: pause inside trend, not reversal. The "fasts cooling + slows embedded + positive A/D" combination is the typical signature of an impulse preparing to consolidate before the next extension, not a top.
Key levels
- Immediate resistance 21.90 — current high, weekly close above this opens free extension toward the structural target
- Structural target 26.80 — alive since the prior idea, +25 % away from current price; coincides with Fibonacci extension and structural projection of the breakout above 18
- Support 1: 20.10 — 4H EMA9 — first healthy pullback zone, ideal for reactivation with volume
- Support 2: 18.62 — 4H EMA20 — deeper pullback, still fully bullish, classic re-entry zone in impulses
- Support 3: 17.52 — Daily EMA9 — daily close loss would open intermediate corrective leg toward 14.43
- Support 4: 14.43 — Daily EMA20 — coincides with the prior idea's operative base, major structural support
- Partial invalidation: daily close below 14.43 would break impulse speed without invalidating the multi-month thesis
- Structural invalidation: weekly close below 10.93 (Daily EMA50) would be the first event challenging the multi-year breakout narrative
Setup Rating — 7.5/10 (Bullish with operative patience)
✅ Positive factors
- Daily and 4H EMA stack impeccable, no bearish crossovers on any scale
- Breakout candle above 18 with volume 5.5× average — textbook institutional confirmation
- Accumulation/Distribution at highs across all three timeframes — sustained institutional flow without distribution
- Slow stochastics (Stoch 89 and Stoch 50) embedded above 90 on Daily and 4H — trend strength intact
- Daily MACD histogram still expanding — primary momentum has not lost slope
- Daily TRIX in active bullish cross, no near-term bearish cross threat
- April 30 earnings already digested, no near-term binary risk
- Prior target (26.80) still 25 % away — significant potential travel still available
- Fundamental narrative (LIDE / glass substrates as core piece of AI packaging) fully intact
⚠️ Cautions
- Daily RSI 14 at 79.2 demands patience for clean entry — buying at market here is suboptimal
- Extreme stochastics on Daily and 4H simultaneously — proximity to probable pause
- 4H MACD histogram stops expanding — intermediate loss of acceleration
- 1H TRIX already in bearish cross and 1H MACD with negative histogram — first real intraday friction
- +52.9 % travel in two weeks without meaningful intermediate pullback — accumulated elasticity demands digestion
- Price–Daily EMA9 distance ~22 % — very high extension on the short-term dynamic
👍 Bullish scenario (most likely)
Technical pullback to the 18.62–20.10 cluster (4H EMA20–4H EMA9) bought with volume and reset of 4H and 1H stochastics. 4H close defending 18.62 validates a second bullish leg toward the 26.80 structural target (+25 %) on a 4–8 week horizon. Variant: sideways consolidation between 19.30 and 21.90 while overbought digests, resetting momentum without losing structure, and subsequent breakout above 21.90 reactivating the primary impulse.
🔁 Healthy consolidation / digestion scenario
19.30–21.90 range during 1–3 weeks while stochs reset on 4H and intraday EMAs catch up to support price. Weekly close above 20.00 with stable A/D maintains the thesis intact and upgrades setup rating to 8/10 once technical overbought has been purged without structural loss.
👎 Bearish scenario (healthy correction, not invalidation)
Loss of 17.52 (Daily EMA9) on daily close opens intermediate correction toward 14.43 (Daily EMA20), the zone coinciding with the operative base of the April 23 prior idea. This correction would not break the multi-month structural thesis — Daily stack would remain intact and A/D would not show distribution while price holds above Daily EMA50 (10.93). Only a weekly close below 10.93 would be the first event forcing review of the multi-year breakout narrative.
 Long
Long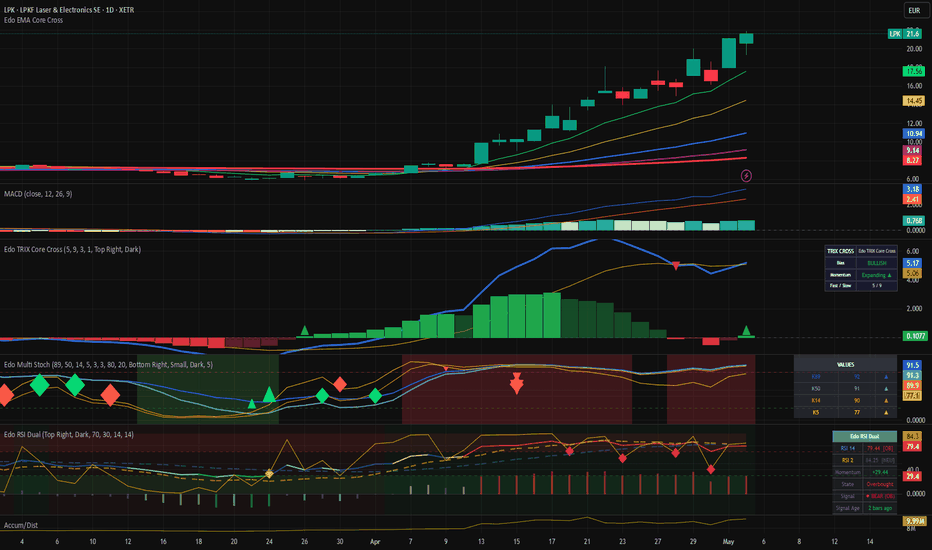
Long 
 Long
Long
Long 
Long 
LPKG (1D) – Structural breakout on LIDE technology narrativeXETR:LPK
LPKF Laser & Electronics (LPKG) has moved from the sidelines to the epicenter of the AI narrative thanks to its LIDE (Laser Induced Deep Etching) technology. This vertical move is not just an impulsive reaction; it is a structural breakout that liquidates years of bearish dominance. As glass substrates become the new standard for advanced packaging, the market is aggressively re-rating the asset.
Timeframe Monthly (1M)
At the macro level, the monthly candle shows a massive expansion of 124.33%. In this chart, we observe that the monthly MACD is crossing above the zero level (0.499), with a histogram beginning to show positive acceleration after years in negative territory. The RSI 14 (68.89) and RSI 2 (92.14) show an unprecedented inflow of momentum. Meanwhile, the monthly stochastic panel indicates a K89 at 15 (exiting the floor zone), a K50 at 30, and a K14 at 48, while the K5 is already flying at 61. This confirms that the long-term cycle is just waking up from an extreme oversold phase that lasted years.
Timeframe Weekly (1W)
On the weekly chart, volume stands at 4.14M, validating the institutional intent behind the rally. The weekly MACD shows a very strong histogram at 0.727 with signal lines at 0.940, decisively exiting the zero level.
Analyzing the weekly stochastic panel, we see a maximum strength configuration: K89 at 68, K50 at 71, K14 at 78, and K5 at 81. All are aligned upwards and entering the expansion zone. The weekly RSI 14 is at 83.45 and the RSI 2 at an extreme 99.41, confirming the verticality of the move. Capital flow in this timeframe (Accum/Dist) skyrockets to 6.2M, indicating real and sustained accumulation. Regarding the exponential structure, price has crossed above the EMA 100 (purple) at 7.68 and the EMA 200 (red) at 9.26, shifting a multi-year bias.
Timeframe Daily (1D)
After the peak at 18.10, the price is correcting -8.09% today. In this timeframe, the EMA structure shows the EMA 9 (green) at 12.46, EMA 20 (yellow) at 10.40, EMA 50 (blue) at 8.59, EMA 100 (purple) at 7.79, and EMA 200 (red) at 7.56. Price maintains dynamic support well above the EMA 9 (green), which is a sign of an extremely strong trend.
The daily MACD is at 1.933 with a histogram of 0.716. In the daily stochastic panel, we observe K89 at 82, K50 at 81, K14 at 80, and K5 at 69. The fact that the K5 is starting to turn downwards while the slow ones (K89, K50) remain in the upper part confirms that we are in a short-term technical correction within a larger impulse. Daily RSI 14 is at 76.03 and RSI 2 has dropped to 47.06, indicating that short-term overbought conditions are clearing. Daily Accumulation/Distribution remains very healthy at 8.87M.
Trend Analysis (SuperTrend)
The SuperTrend (1W) has flipped to green (bullish) after 42 consecutive sessions in bearish territory. The current value of the indicator is at 10.40, coinciding exactly with the daily EMA 20 (yellow), which reinforces this level as the most important structural and psychological support in case of a larger correction.
Structure and Fibonacci (ZigZag)
The ZigZag (1D) currently marks a bearish direction due to the rejection at 18.10. The last pivot recorded was an LL (Low Low) at 5.85. The current 13.24% retracement from highs is seeking support at Fibonacci levels. Reference levels are at 7.45 (1.000) and the current consolidation level. The swing structure shows that the impulse has easily surpassed all previous resistance pivots (LH/HH).
Liquidity Zones and Targets
The liquidity zones tool detects 2 active zones above the current price. The nearest resistance is located at 26.80, representing a target at +87.41% distance. Already 8 liquidity zones have been taken during this rally, including key levels at 15.50 and 19.95. There are no nearby tested liquidity supports below, meaning the price relies on the EMA structure and Fibonacci to find a floor.
Fundamental Context and Catalysts
The market is anticipating LPKF's strategic role in the glass substrate (TGV) ecosystem for AI chip packaging. The pilot line with TPK and ASE for 2026 is the fundamental driver of the rally. Upcoming Earnings on April 30 will be the immediate catalyst to validate if these expectations are backed by management.
Setup Rating: 8/10
✅ Macro breakout with historical weekly volume.
✅ Weekly SuperTrend flip after 42 bearish sessions.
✅ Strong institutional accumulation (8.87M) validating the move.
⚠️ Severe technical overextension relative to the EMA 200 (red) at 7.56.
⚠️ Weekly RSI at technical saturation levels (83.45).
👍 Bullish scenario
Consolidation in the 14.00 area to attempt a new attack on 18.10. If price breaks that high with volume, the next macro liquidity target is at 26.80.
👎 Bearish scenario
Continuation of the correction towards the EMA 9 (green) at 12.46. If this level is lost, the major support and institutional buying zone is at 10.40 (EMA 20 yellow and weekly SuperTrend value).
Bullish or bearish from here? Let me know below 👇 Long 
Long