Short
Short
 Long
Long
Is a 100% increase in the value of social trading stocks?The IPO market is buzzing with excitement following the hugely successful listing of eToro Group Ltd (ETOR).
This article will analyze how to identify stocks in the social trading sector and the criteria for assessing whether their market value is undervalued and offers significant growth prospects.
Social trading is one of the most significant innovations in the world of financial investment. This practice allows investors to connect, share strategies, and even replicate the trades of more experienced traders through dedicated platforms. In an era where technology is transforming every aspect of our lives, social trading offers an accessible and collaborative way to navigate the financial markets.
The boom in social trading
Social trading is an investment method based on collaboration between traders through online platforms. These platforms, such as eToro or NAGA, serve as digital spaces where users can observe the activities of other investors, discuss strategies, and, in many cases, copy the trades of experienced traders. The main goal is to make the investment process more transparent and accessible, even for those who do not have in-depth knowledge of the markets.
Understanding the social trading industry
The fundamental principle of social trading is information sharing. More experienced traders make their portfolios and trades available, allowing others to monitor their movements on the markets in real time. Users can choose to copy the strategies of these professionals, which means that every trade made by the expert will be automatically replicated in the copier's portfolio. This process, called “copy trading,” is ideal for those who want to participate in the markets but don't have the time or expertise to analyze them in depth.
The two most interesting publicly traded companies in the social trading sector are EToro and NAGA Group AG (N4G).
I decided not to invest in E Toro, as IPOs tend to drive the share price above its actual value. Statistically, out of 10 IPOs, 8 times the value of the shares decreases in the first year. As shown in the image, TW flags two warnings: the price is currently correct, indicating limited growth potential, and profit margins are low.
Why NAGA Group AG excels
NAGA Group AG is a German company that develops and markets applications in the financial technology sector. The company's main product is NAGA TRADER, a social trading application that allows users to trade foreign currencies, indices, equities, and cryptocurrencies via Contracts for Difference, copying the trades of other traders.
A notable feature of NAGA TRADER is its dual exchange function, which allows users to replicate the strategies of other crypto investors and trade cryptocurrencies.
I decided to invest in this technology company, NAGA Group AG (N4G), based on my analysis, which coincides
The stock is also very interesting from a technical point of view, as prices are rising with above-average volumes and are about to cross the 200 moving average, with prices that I believe will reach 1.50 in 2026, with a potential upside of over 100%.
If you would like to receive a notification every time I publish a new article, just click on “FOLLOW” at the top. Also, if you would like to explore a particular topic in more depth or need some advice, please comment below the article and I will be happy to help. What is Happening to Puma?Puma's stock has experienced a significant decline, dropping nearly 50% year-to-date and reaching its lowest levels in almost a decade . This downturn is attributed to several factors, including underwhelming financial performance, escalating competition, and macroeconomic challenges.
Financial Performance:
In 2024, Puma reported a 4.4% currency-adjusted increase in sales, totaling €8.82 billion . However, profitability did not keep pace; net income declined by 7.5% to €282 million, and EBIT remained flat at €622 million, falling short of analyst expectations . The company's P/E ratio stands at 17, which some analysts consider high given the current earnings yield of 2.8% .
Debt and Balance Sheet:
Puma's financial health shows a debt-to-equity ratio of approximately 48.2%, with total debt at €1.3 billion and shareholder equity at €2.7 billion . While the company has a solid capital base, increased interest payments have impacted income .
Competitive Landscape:
Puma faces intense competition from industry giants like Nike and Adidas. Nike holds a significant market share, while Adidas has recently increased its share to 8.9% . Puma's market share stands at approximately 4.94% . The company's efforts to boost sales through new product lines, such as the Speedcat trainers, have yet to yield significant results .
Macroeconomic Challenges:
Global economic factors have also played a role in Puma's struggles. Trade disputes and currency volatility have negatively impacted sales, particularly in key markets like the U.S. and China . Additionally, new U.S. tariffs on imports from China, where Puma sources 28% of its products, have created further uncertainty.
Strategic Response:
In response to these challenges, Puma has announced plans to cut 500 corporate positions globally by the end of the second quarter of 2025 to reduce costs . The company has also appointed former Adidas executive Arthur Hoeld as its new CEO, effective July 1, 2025, aiming to revitalize its performance .
In summary, Puma's recent stock decline reflects a combination of internal financial challenges and external market pressures. While the company is taking steps to address these issues, including leadership changes and cost-cutting measures, it remains to be seen how effectively Puma can navigate the competitive and economic landscape moving forward.
- *Disclaimer: This is just my personal opinion and not financial advice. I am not a professional financial advisor. Please do your own research before making any investment decisions. Any losses incurred are solely at your own risk.The figures that i found might not all be correct, as I do sometimes make mistakes, so do your own due diligence.*
Retro Editors' picks 2020As we move forward through time, we occasionally must look backward to evaluate our progress and address our shortcomings.
For years, PineCoders has voluntarily analyzed numerous published scripts, selecting the most exceptional among them as Editors' picks . To enhance our process and spotlight more high-quality work from our community, we've conducted a comprehensive review of script publications from the past five years. Through this effort, we've identified several additional scripts that deserve greater recognition than they initially received.
Below is a collection of additional scripts from 2020 that have earned a spot in our Editors' picks. These retrospective selections reflect our continued commitment to honoring outstanding contributions in our community, regardless of when they were published. To the authors of these highlighted scripts: our sincere thanks, on behalf of all TradingViewers. Congrats!
Support Resistance Channels - LonesomeTheBlue
BERLIN Candles - lejmer
Delta Volume Columns Pro - LucF
Range Filter - DonovanWall
Over the next four months, in the last week of each month, we will share retro Editors' picks for subsequent years:
June: retro EPs for 2021
July: retro EPs for 2022
August: retro EPs for 2023
September: retro EPs for 2024
They will be visible in the Editors' picks feed .
█ What are Editors' picks ?
The Editors' picks showcase the best open-source script publications selected by our PineCoders team. Many of these scripts are original and only available on TradingView. These picks are not recommendations to buy or sell anything or use a specific indicator. We aim to highlight the most interesting publications to encourage learning and sharing in our community.
Any open-source script publication in the Community Scripts can be picked if it is original, provides good potential value to traders, includes a helpful description, and complies with the House Rules.
— The PineCoders team  Education
 Long
Long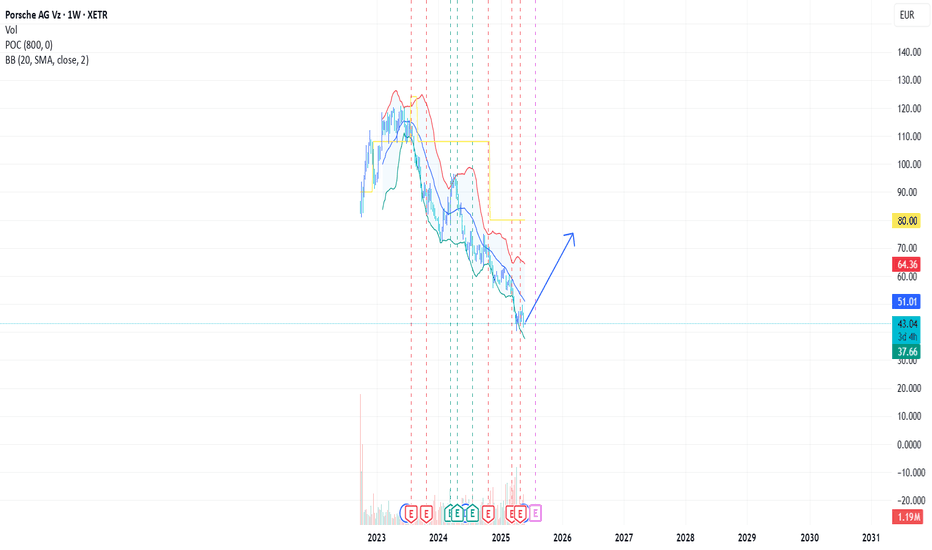
 Short
Short
 Long
Long
 Long
Long
China Strikes Industrial Plastics SectorChina Imposes Harsh Tariffs on POM Plastics: Which Companies Are Hit the Hardest?
By Ion Jauregui – Analyst at ActivTrades
China has reignited trade tensions by announcing anti-dumping tariffs of up to 74.9% on imports of polyoxymethylene (POM) copolymers—a high-performance plastic widely used in the automotive, electronics, and consumer goods industries. The measure directly affects manufacturers from the United States, the European Union, Japan, and Taiwan, with varying degrees of severity.
U.S. exporters are the hardest hit, facing tariffs of up to 74.9%, followed by European companies at 34.5% and Japanese firms at 35.5%. Taiwanese exporters are also targeted, though with variable rates depending on the supplier.
Companies in the Crosshairs
Among the most affected are U.S. giants Celanese Corporation and DuPont de Nemours, both with strong exposure to China’s engineering plastics market. In Europe, BASF and Celanese’s German subsidiary Ticona GmbH could see their competitiveness eroded by higher costs. From Japan, firms like Mitsubishi Chemical and Asahi Kasei are also likely to feel the pinch due to their significant export volumes of POM to China.
BASF Pressured to Reinvent Itself
For BASF, the move comes at a critical time. The company is already under pressure from rising energy costs in Europe and weak industrial demand. Its share price has been volatile, influenced by macroeconomic factors and its significant exposure to China, where its engineering plastics division generates a major portion of revenue. These new tariffs may further hamper profitability in the region.
BASF is facing one of its most challenging periods in years. In addition to high energy costs and sluggish demand, the Chinese tariffs now threaten its position in Asia. The company has already launched a €2 billion cost-cutting program and is restructuring non-core assets. It also plans to reduce its annual dividend to €2.25 per share from 2025 to 2028, breaking with its long-standing stable payout policy. Shares are trading near €44, in a long-term downtrend. Still, analysts are watching the development of its new China chemical complex and upcoming divestitures, which could mark a turning point in future profitability.
Technically, BASF shares have been trading between a high of €52.33 in March and a low of €35.66 in April. Its current trading zone reflects a key support-resistance area, with the RSI currently neutral at 50%.
Impact on the Global Supply Chain
POM plays a vital role in manufacturing precision components such as gears, valves, electrical connectors, and automotive parts. With these tariffs in place, many Chinese firms may turn to domestic suppliers or regional alternatives like South Korea, reducing market share for Western and Japanese exporters that previously benefited from cost advantages.
A New Front in the Trade War
This decision emerges amid an already tense global environment, particularly between the U.S. and China. For investors, it adds a layer of geopolitical risk and raises the possibility of supply chain realignment in the medium term.
*******************************************************************************************
The information provided does not constitute investment research. The material has not been prepared in accordance with the legal requirements designed to promote the independence of investment research and such should be considered a marketing communication.
All information has been prepared by ActivTrades ("AT"). The information does not contain a record of AT's prices, or an offer of or solicitation for a transaction in any financial instrument. No representation or warranty is given as to the accuracy or completeness of this information.
Any material provided does not have regard to the specific investment objective and financial situation of any person who may receive it. Past performance is not reliable indicator of future performance. AT provides an execution-only service. Consequently, any person acting on the information provided does so at their own risk.
Long 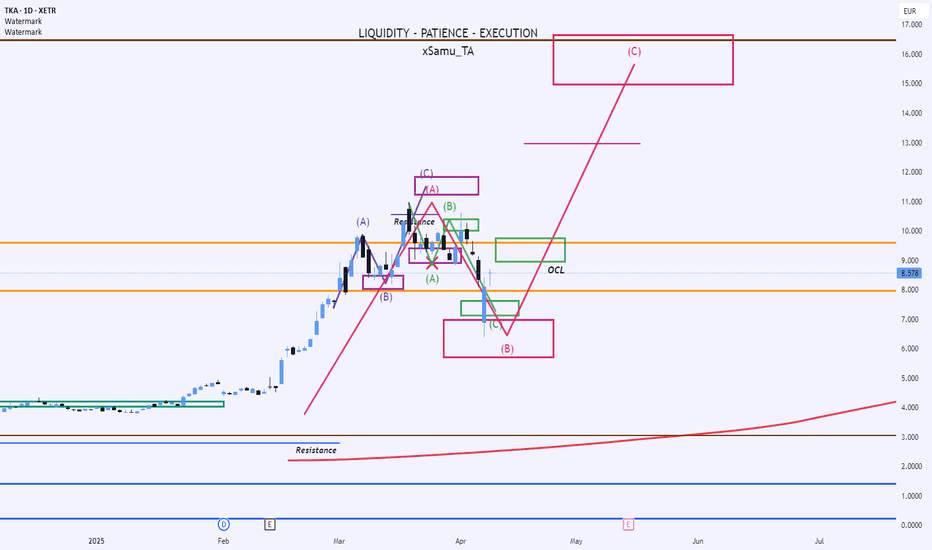
Thyssenkrupp earnings coming. Tales of two rises?1. Fundamentals:
Thyssenkrupp have suffered a lot. In 7 years it lost 90% of the market cap!
Early 2018 the stock price was €26, and it fell under €3 in 2024.
Slowdown in European industry, especially car manufacturing, and the idea of 'green steel' did hurt the price.
A quick recovery happened to €11, as European spending picked up steam. Especially, defense spending and the recovery in the car industry give hope to the car industry. Continental delivered good earnings last week.
However, the defense part might not be help earnings as soon 2025 Q1, and the car industry alone don't justify the €11 price.
2. Technicals
The first rally in one month was fast, but had volume under it.
The price of €2.768 in 2024 september was clearly a nonsense, shorters exited the stock and accumulation started.
In one month, February to March it went bananas, +140%, then Liberation day came and it fell, like everything else.
It rose again, but this time, the volume is declining.
My hunch is, a spike to 10.9-11.6 on earnings (15. May), and then straight down under €6.
Can be a good long on long-term, but it's overbought now.
Can be a good short idea on earnings, if it opens green. Short 
Indra and Rheinmetall Join Forces in Defense Alliance for IDVBy Ion Jauregui - ActivTrades Analyst
Indra has entered into a new strategic alliance with German defense giant Rheinmetall for the joint development of armored vehicles, expanding their existing cooperation beyond combat electronics for Leopard tanks. This move comes during the International Defence and Security Fair (Feindef 25) in Madrid and at a critical time: both companies are involved in the bidding process to acquire Iveco Defence Vehicles (IDV), the military subsidiary of Iveco, in a deal that could exceed €1.4 billion.
The operation has direct implications for Indra’s positioning as an industrial integrator in the land defense sector. Under the leadership of José Vicente de los Mozos, the Spanish firm is seeking to strengthen its capabilities through alliances and acquisitions, aiming to evolve from a primarily technological company into one with industrial production capacity—especially in small series manufacturing, which is vital in the NATO context.
From a stock market perspective, Indra currently trades around €29 per share, reaching an intraday high of €30.56 yesterday, with a market capitalization close to €5.1 billion. The company’s performance in recent years has been positive, driven by its shift toward the defense sector and key contracts in digitalization and military systems. However, the stock fell 1.72% following the announcement of the potential IDV acquisition, reflecting investor caution toward large-scale operations. The midpoint control area for the stock lies slightly lower, around €27.50, despite moving averages continuing to indicate bullish momentum and the RSI standing in clear overbought territory at 64%.
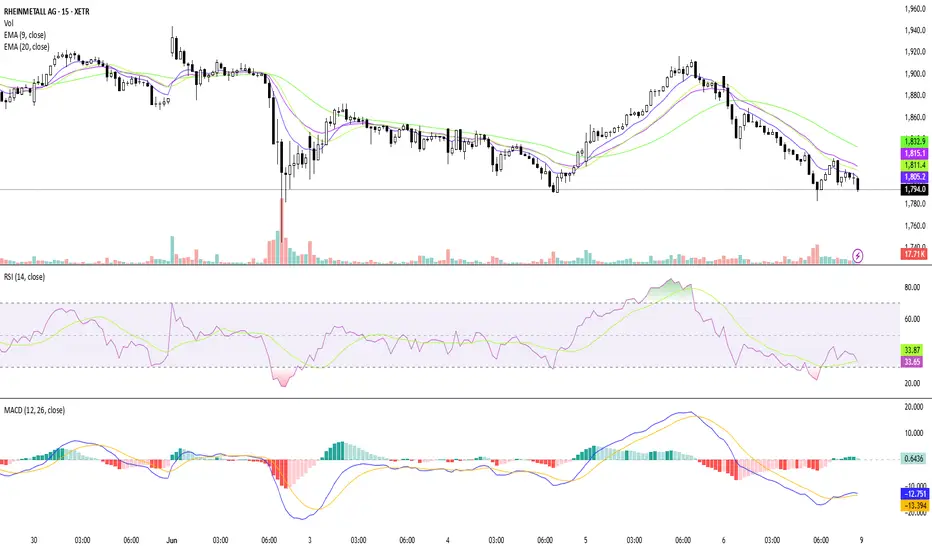
Rheinmetall, based in Düsseldorf, has been one of the major beneficiaries of the current geopolitical cycle. The stock traded at an all-time high of €1,744 per share yesterday, with a market capitalization exceeding €18 billion—doubling in value since 2022 due to the surge in European defense spending. However, following news of the IDV bid, its shares declined by 5.90%, closing the session at €1,594, reflecting market sensitivity to ambitious acquisitions. The midpoint control area for the stock stands just below at around €1,342, and once again, moving averages show no signs of trend reversal. The RSI remains clearly overbought at around 60%.
Both companies now aim to consolidate a European land defense hub capable of competing on a global scale, with support from Brussels and a strong commitment to integrating strategic industrial capabilities.
*******************************************************************************************
The information provided does not constitute investment research. The material has not been prepared in accordance with the legal requirements designed to promote the independence of investment research and such should be considered a marketing communication.
All information has been prepared by ActivTrades ("AT"). The information does not contain a record of AT's prices, or an offer of or solicitation for a transaction in any financial instrument. No representation or warranty is given as to the accuracy or completeness of this information.
Any material provided does not have regard to the specific investment objective and financial situation of any person who may receive it. Past performance is not reliable indicator of future performance. AT provides an execution-only service. Consequently, any person acting on the information provided does so at their own risk.
Long 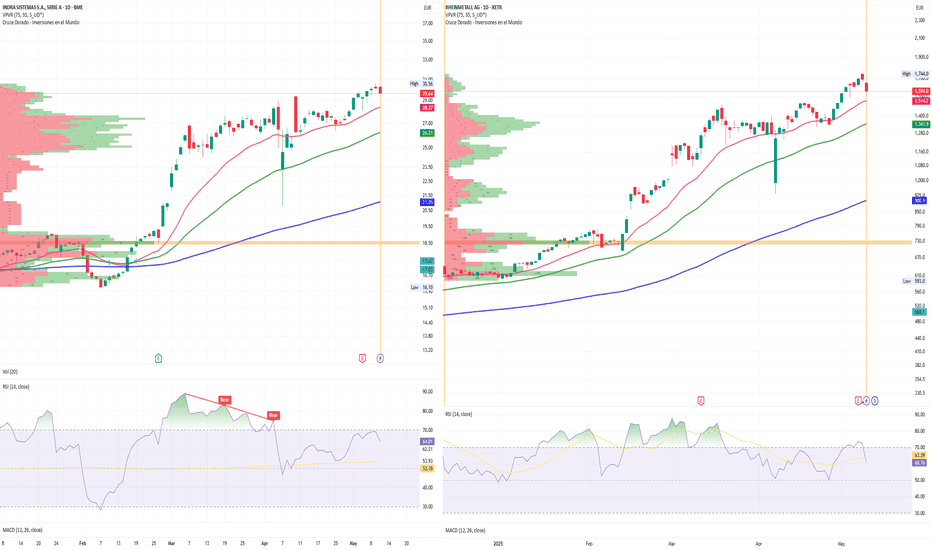
 Long
Long
Short 
Due to Geo Political changes in Europe grow expected. These types of rates are always difficult (but fun) to analyze, because there is no history. This one has gone from always low to sky high. But I can still do something with it. You see again, classically according to the Fibonacci model, that the rate has shot up from 400 to 1280, from the blue area straight through the green and yellow. The red area is the outperformance, but you don't know that because you don't know where the rate ends.
You can put a reserve Fibonacci chart against that and then you suddenly see the purple area appear up to 2700. If I subdivide that again, resistance arises on:
1884
2064
2180
2313
2459
2700
The group was promoted to the DAX, Germany's main stock market index, in March 2023. It is the largest German and fifth-largest European arms manufacturer, and produces a variety of armored fighting vehicles and armored personnel carriers, both wheeled and tracked. Long 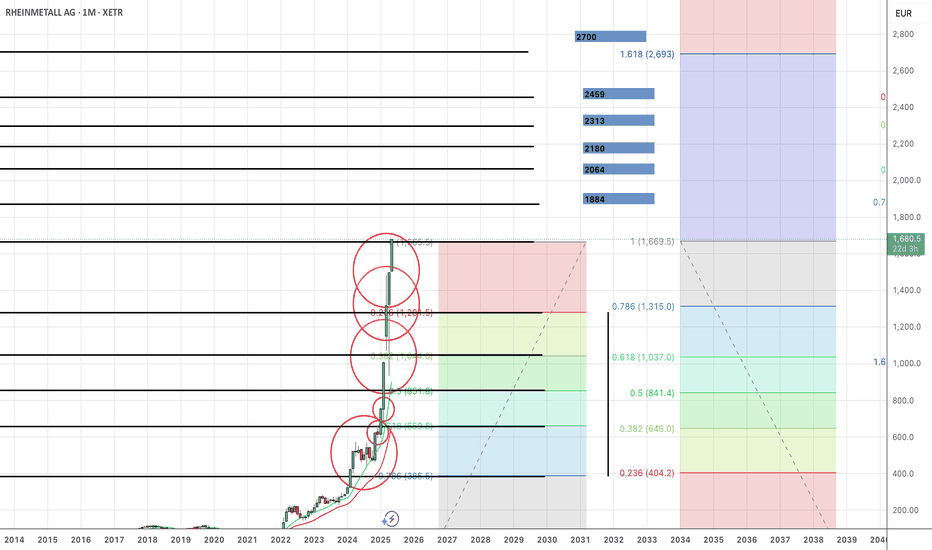
BMW: Stability, Innovation, and Opportunity in a Changing WorldIn times of market turbulence, great opportunities often lie hidden beneath temporary setbacks. Recent tariff-related ripples may have rattled BMW’s price, but for those looking to invest for the long haul, this dip is a golden opportunity to buy into one of the world’s most reliable automakers.
www.youtube.com
Resilient Amid Tariff Turbulence
Global trade frictions and tariff uncertainties have impacted many companies, and BMW is no exception. Yet, unlike many peers that retreat during such times, BMW remains steadfast—confident in its strategy and outlook. With industry insiders predicting that these tariffs are only temporary, BMW’s fundamentals remain ironclad. Its robust global presence and proactive planning have positioned it to weather these short-term shocks and bounce back stronger.
A Diverse, Future-Ready Product Lineup
While some high-profile names in the auto space chase trends with empty promises, BMW consistently delivers. Rather than focusing solely on electric vehicles like Tesla, BMW offers a balanced portfolio:
- Low-Emission Fossil Fuel Cars: Advanced, efficient engines that still serve a significant market segment.
- Hybrid and Electric Vehicles: Designed for the evolving demand for cleaner mobility, these models blend performance with environmental responsibility.
- Pioneering Hydrogen Technology: In collaboration with strategic partners, BMW is blazing a trail in hydrogen-powered vehicles—a potential game changer that ensures adaptability as the energy landscape shifts.
This diverse lineup not only meets current market needs but also positions BMW at the forefront of future mobility, delivering real, tangible products that work.
World-Class Manufacturing and Advanced Robotics
BMW’s reputation for engineering excellence isn’t just about beautiful design—it’s rooted in its state-of-the-art manufacturing. The company has embraced advanced robotics and automation, ensuring precision, efficiency, and consistent quality. With production facilities spanning the globe—including significant plants in the United States—BMW solidifies its stature as a truly international enterprise.
A Stable, Dividend-Paying Investment
In a market that often rewards volatile “meme” stocks and empty promises, BMW stands apart as a beacon of stability. Unlike Tesla, which currently pays no dividends, BMW offers a juicy dividend yield of over 5%, providing investors with regular, attractive returns. This dividend, coupled with its solid operational fundamentals, makes BMW a safe bet—one that rewards shareholders consistently even during turbulent times.
The Time to Invest Is Now
BMW is more than just a carmaker—it’s a symbol of resilience, innovation, and pragmatic progress. While market chatter may cast doubt amid temporary tariff-induced lows, the company’s diversified product mix, global manufacturing footprint, and commitment to delivering real, advanced technology create a compelling investment thesis.
For investors seeking stability, reliability, and the promise of long-term growth, BMW offers an opportunity to ride out the storm and benefit from a future where the company’s innovations in hybrids, electrics, and hydrogen continue to shape mobility worldwide. Now is the time to look beyond short-term market jitters and invest in a legacy built on quality, performance, and consistent returns.
Embrace the opportunity—BMW’s bright future is not just a promise; it’s already in motion.
XETR:BMW SIX:BMW NASDAQ:TSLA NYSE:GM NYSE:F  Long
Long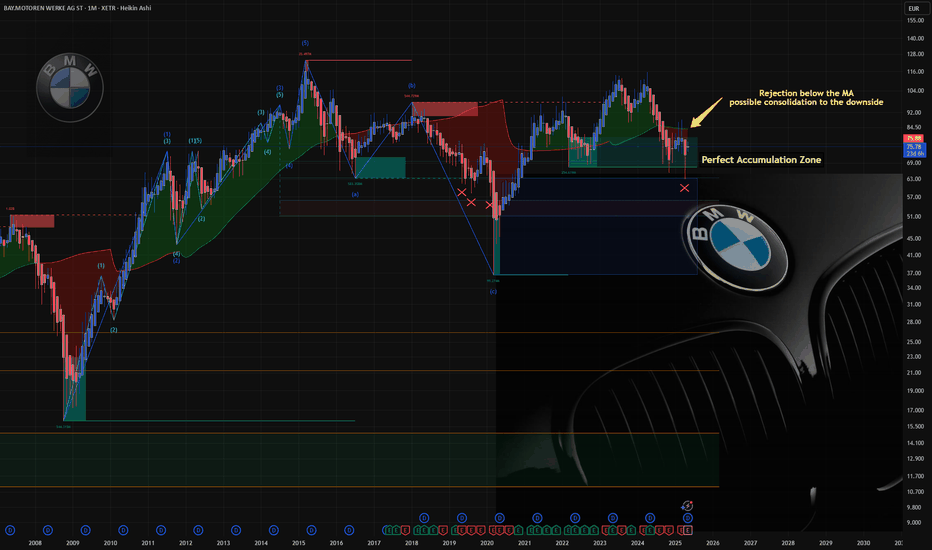
Flag Flutters Precariously: Navigating the Sky of Greed.The Siemens flag, once a symbol of ambition, now hovers in the sky of opportunistic buyers. Previously, it was plummeting toward the ground, but a swarm of butterfly-like buyers, armed with unwavering determination, managed to lift it back up using a sturdy candlestick.
However, in this latest turn of events, the flag now hangs precariously between two vast voids, abandoned by the overconfident grip of greedy crab buyers. Their hold appears too weak to keep the flag aloft, and it seems destined to fall from the lofty height of 214 euros—ironically referred to as the "golden level of the crab." It seems that gravity, much like the harsh reality of the market, inevitably prevails.  Long
Long
 Long
Long