Long
Long
 Long
Long
 Long
Long
 Long
Long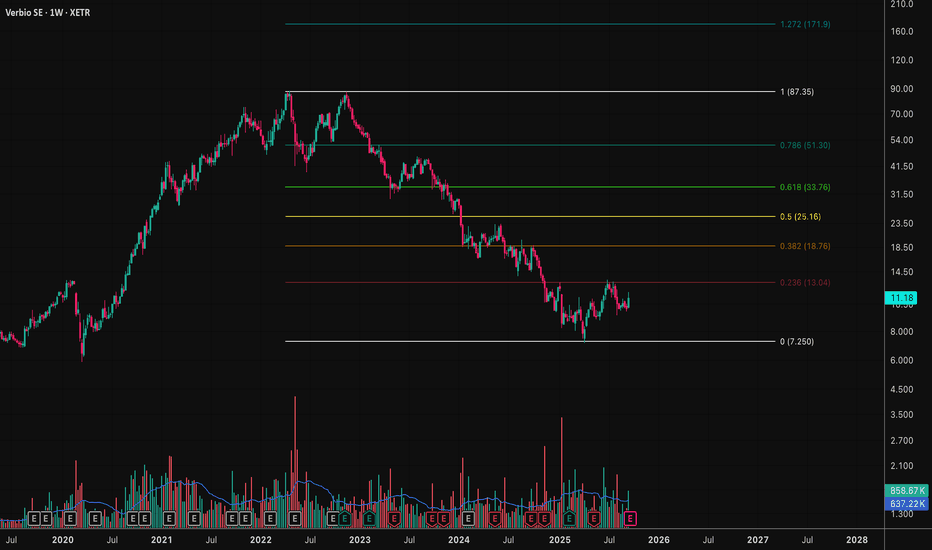
 Short
Short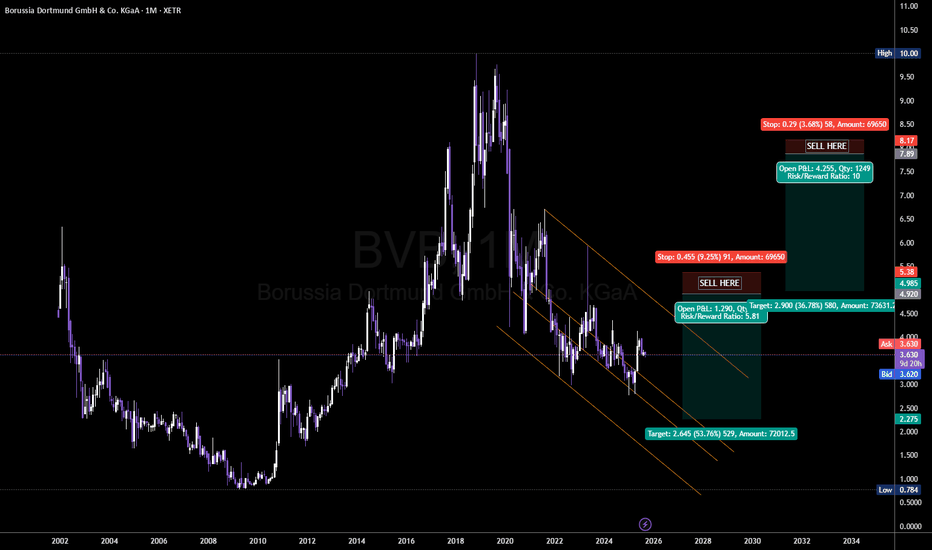
 Long
Long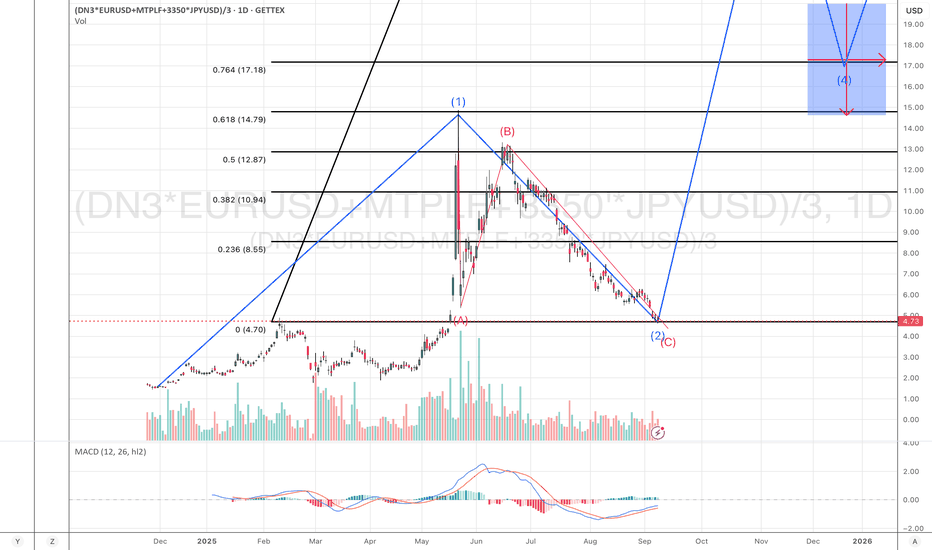
 Long
Long
 Long
Long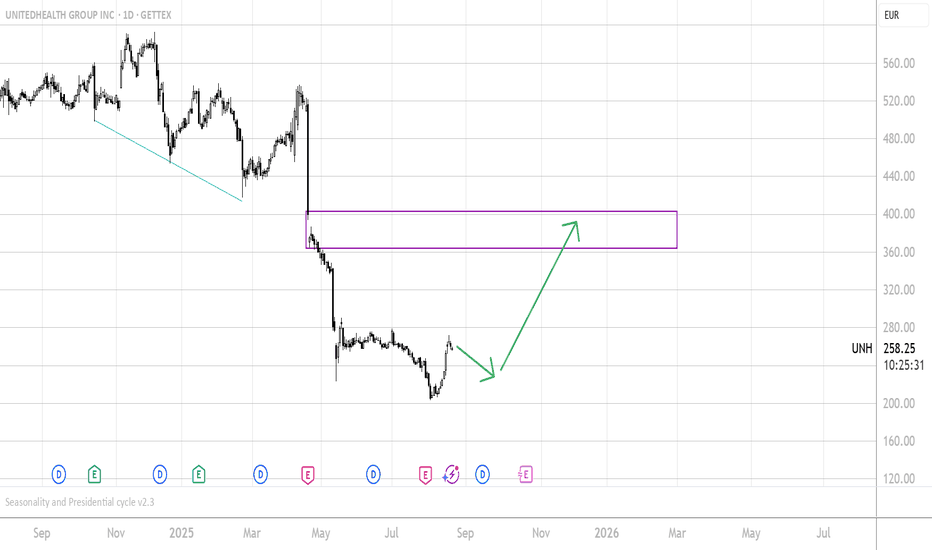
 Long
Long
 Long
Long
NVIDIA Testing Downtrend — Breakout Could Unlock UpsideNVIDIA has been trading in a corrective downtrend after its recent highs, with price compressing under the red trendline. If this downtrend breaks, a strong bullish move upward could follow, but key supports below remain critical if sellers extend pressure.
🔍 Technical Analysis
Current price: 143.04 EUR (XETR).
Price is consolidating under the downtrend line, keeping short-term bias cautious.
Immediate supports: 141.40 (short-term) and 139.44 (intraday).
A break of the red trendline would flip momentum bullish.
🛡️ Support Zones & Stop-Loss (White Lines):
🟢 141.40 – Last 15m Support (High Risk)
Weak intraday defense.
Stop-loss: Below 139.44
🟠 130.84 – 4H Support (Good Entry)
Major demand zone.
Stop-loss: Below 128.2
⚪ 128.34 – Macro Base
Strong final floor if deeper correction plays out.
🔼 Resistance Levels:
🟥 Downtrend Line (Red)
The key resistance. A break above → signals bullish reversal.
Psychological resistance: 145.00
🧭 Outlook
Bullish Case: Break above trendline → upside momentum resumes, targeting 145+.
Bearish Case: Rejection under trendline + loss of 141.40 → opens path to 139.44 and 130.84.
Bias: Neutral to bullish — watching for a confirmed trendline breakout.
🌍 Fundamental Insight
NVIDIA’s latest earnings disappointed the market, with slowing revenue growth and concerns about sustainability of its AI-driven boom. Profit margins remain high, but weaker guidance has triggered selling pressure and fueled the current downtrend.
Bearish pressure: Revenue slowdown + post-earnings profit-taking.
Bullish support: Long-term AI leadership and strong market position keep investors interested on dips.
✅ Conclusion
NVIDIA is testing a critical downtrend line after weak earnings triggered a pullback. A confirmed breakout could reignite the bullish trend, but failure and a break below 141.40/139.44 opens the way toward deeper supports at 130.84.
⚠️ Disclaimer
This analysis is for educational purposes only and does not constitute financial, investment, or trading advice. Cadeler’s Wind-Powered Surge - €2.5B Backlog to Fuel Growth Cadeler A/S (OB): Riding the Offshore Wind Wave
In a nutshell, what I see is a stock whose price declined by 33% from October 2024 to September 2025, despite the fact that the company is now in a much better position, with better ratios, much better revenue, and great value.
Company Overview
Cadeler A/S is a global leader in offshore wind farm installation and maintenance, primarily operating in European markets. Listed on Oslo Børs, the company operates a fleet of 4 jack-up vessels with 8 additional vessels in development, positioning itself to capitalize on Europe's aggressive renewable energy targets.
Market Opportunity
The offshore wind sector is experiencing a lot of growth. 2024 was a record year with 117 GW of new capacity installed globally. The Global Wind Energy Council forecasts 410 GW of new capacity by 2030, representing annual growth rates of 28% through 2029.
Europe's ambitious targets include 42.5% renewable energy by 2030 and 300 GW of offshore wind capacity by 2050, creating a massive addressable market for Cadeler's specialized services.
Financial Highlights
Strong Revenue Growth: Revenue doubled to €249M in 2024 from €109M in 2023, driven by successful project execution and the Eneti merger. Latest TTM revenue reached €465M (277.9% YoY growth). Q2 2025 revenue grew by 242%, but despite that, the stock price is trending down.
Record Backlog: Order backlog increased to €2.5B in 2024 from €1.7B in 2023, providing strong revenue visibility with key contracts including Baltica 2, Bałtyk 2/3 (Poland), US, and Taiwan 4.
Profitability Surge: EPS grew 409.5% YoY to €0.32 in Q2 2025, with a 3-year CAGR of 61.9%.
2025 Guidance: Management projects €485-525M revenue with €278-318M EBITDA.
Valuation Metrics
P/E Ratio: 6.7 (significantly compressed from the previous year)
P/B Ratio: 1.1 (37.1% decrease YoY)
Revenue CAGR (5-year): 87.6%
The combination of low valuation multiples and exceptional growth suggests potential undervaluation.
Key Risks
Project Execution: Permitting delays and cancellations (e.g., Hornsea 4 removal from backlog) can impact revenue visibility.
Cost Inflation: Rising turbine costs (+10% since 2021) and supply chain constraints could pressure margins.
Policy Dependency: Growth relies heavily on government subsidies and favorable renewable energy policies, creating regulatory risk.
My Investment Thesis
Cadeler is an opportunity in the rapidly expanding offshore wind installation market. They have a strong order backlog and prospective contracts, fleet expansion plans, and attractive valuation metrics; the company appears well-positioned to benefit from Europe's energy transition. I see it as a mix of value and growth investing.
I see Cadeler as a medium to long-term investment. I think the upside potential is anywhere between +50% and +100% from the current price.
I will allocate around 1% of my wealth into this stock.
Quick note: I'm just sharing my journey - not financial advice! 😊  Long
Long
 Long
Long
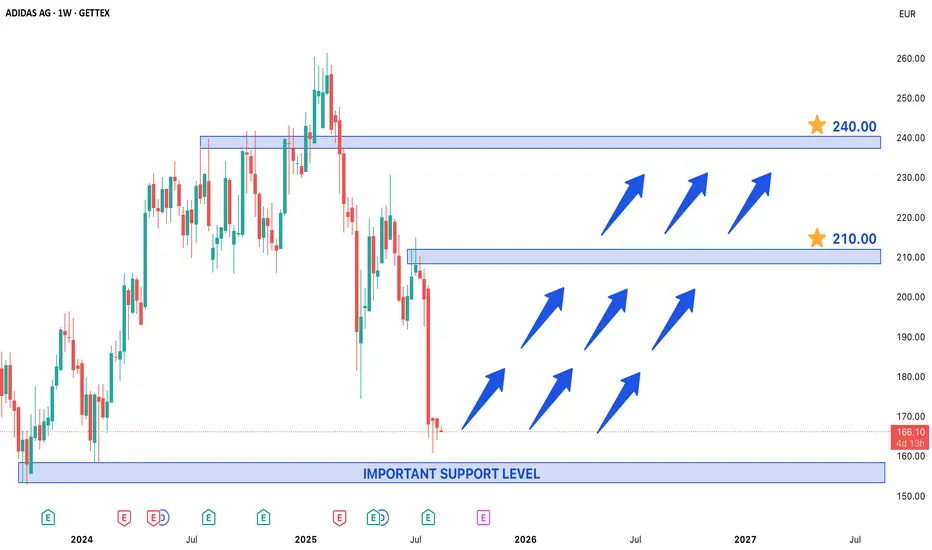
Adidas ADS Trading Near Important Support Level in Weekly ChartAdidas Stock Trading Near Important Support Level – A Potential Long-Term Entry Point
Adidas (ADS) stock is currently trading near a crucial support level, presenting a potential opportunity for long-term investors. Historically, this price level has acted as a strong base, with notable rejections observed in 2023 and 2024, indicating strong buying interest. Given the repeated bullish reactions from this zone, there is a high probability that the stock could resume its upward trajectory from here.
Price Outlook & Targets
If the support holds, Adidas stock could initiate a fresh bullish phase, with potential upside targets at 210.00 and 240.00. These levels represent key resistance zones where profit-taking or minor pullbacks may occur. Investors should monitor price action closely for confirmation of a sustained uptrend.
Risk Management Strategy
Before entering, a well-defined risk management plan is essential:
1. Stop-Loss Placement – Since the trade relies on the support level holding, a stop-loss should be placed below the recent swing low to limit downside risk.
2. Position Sizing – Allocate only a portion of the capital to avoid excessive exposure.
3. Trailing Stop for Profits – As the price moves toward 210.00, consider trailing the stop to lock in gains and protect against reversals.
4. Diversification – Avoid overconcentration in a single stock; balance the portfolio with other assets to mitigate sector-specific risks.
Conclusion
Adidas stock presents an attractive long-term opportunity near its historical support. However, disciplined risk management is crucial to navigate potential volatility. Investors should wait for confirmation of a bullish reversal before committing capital and adjust positions based on evolving market conditions.  Long
Long
 Short
Short
Adidas ADS Trading Near Important Support Level in Weekly ChartAdidas Stock Trading Near Important Support Level – A Potential Long-Term Entry Point
Adidas (ADS) stock is currently trading near a crucial support level, presenting a potential opportunity for long-term investors. Historically, this price level has acted as a strong base, with notable rejections observed in 2023 and 2024, indicating strong buying interest. Given the repeated bullish reactions from this zone, there is a high probability that the stock could resume its upward trajectory from here.
Price Outlook & Targets
If the support holds, Adidas stock could initiate a fresh bullish phase, with potential upside targets at 210.00 and 240.00. These levels represent key resistance zones where profit-taking or minor pullbacks may occur. Investors should monitor price action closely for confirmation of a sustained uptrend.
Risk Management Strategy
Before entering, a well-defined risk management plan is essential:
1. Stop-Loss Placement – Since the trade relies on the support level holding, a stop-loss should be placed below the recent swing low to limit downside risk.
2. Position Sizing – Allocate only a portion of the capital to avoid excessive exposure.
3. Trailing Stop for Profits – As the price moves toward 210.00, consider trailing the stop to lock in gains and protect against reversals.
4. Diversification – Avoid overconcentration in a single stock; balance the portfolio with other assets to mitigate sector-specific risks.
Conclusion
Adidas stock presents an attractive long-term opportunity near its historical support. However, disciplined risk management is crucial to navigate potential volatility. Investors should wait for confirmation of a bullish reversal before committing capital and adjust positions based on evolving market conditions. Long 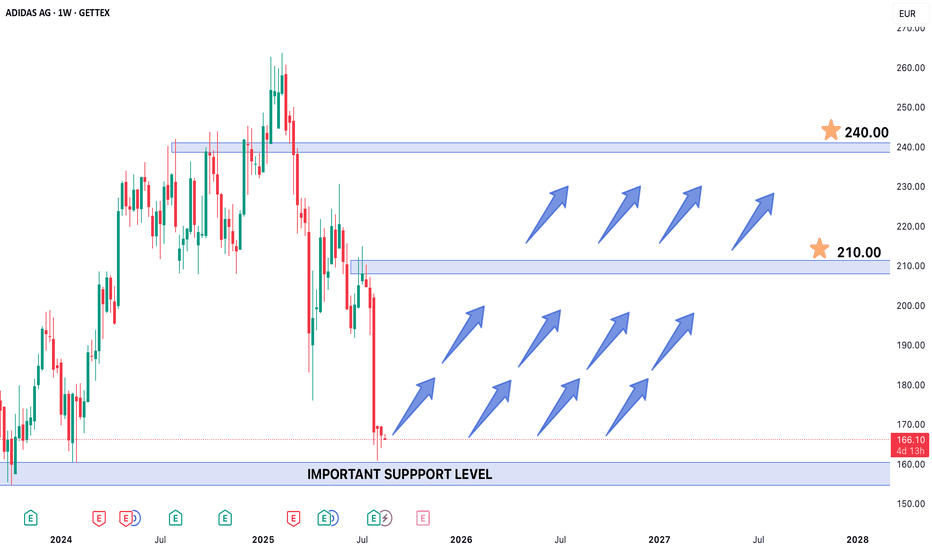
 Long
Long
Long 
 Short
Short
 Long
Long