• Products
  • Community
  • Markets
  • Brokers
  • More
Get started
  • Markets
  • /Germany
  • /Stocks
  • /Ideas
VERBIO ahead of Q3 report Why Q3 Could Be the Inflection Quarter for Verbio SE When management spoke during Q2, the biggest overhang was regulation. CEO Claus Sauter repeatedly highlighted the uncertainty surrounding Germany’s implementation of RED III. That uncertainty has now materially changed. In April 2026, Germany formally adopted RED III implementation, raising the greenhouse gas reduction quota from 12% in 2026 to 17.5% in 2027. This step is designed to absorb the previously suspended carry-over volumes that will re-enter the market in 2027. Just as importantly, double counting of advanced biofuels has been abolished, directly addressing one of the largest distortions in the German THG market. For Verbio, this matters enormously. Management has previously indicated that roughly 70–80% of production is conventional biofuel that generate THG certificates. These before DC, was underpriced vs advanced fuels. With double counting now removed, the market is shifting from “paper compliance” toward real physical molecules. The impact is already visible: • THG 2026 contracts are trading around €470/t • THG 2027 contracts have rallied from roughly €270/t to €375/t within weeks That pricing action suggests the market is beginning to reprice actual scarcity of compliant renewable volumes. Structural demand is no longer theoretical One of the strongest comments from Sauter during Q2 may have been: “Our raw materials do not have to pass through the Strait of Hormuz.” That statement becomes even more relevant as geopolitical risk pushes fossil energy prices higher. While crude markets remain exposed to Middle East supply disruptions, Verbio’s feedstock is regionally sourced biomass. That creates: • More stable input costs • Lower supply chain risk • Potential margin expansion when fossil benchmarks rally This is exactly the type of pricing asymmetry investors should focus on. Operations: Multiple catalysts into Q3 Q2 already showed operational momentum: North America Nevada reached record production levels, despite extreme weather conditions. If utilization continues to improve in Q3, North America could become a larger EBITDA contributor than consensus currently models. Europe Verbio reported record biodiesel production in Europe during Q2. Additionally: • Planned maintenance is now behind them • Biodiesel production should normalize upward in Q3 • Higher THG pricing should support stronger realized margins India India remains an underappreciated optionality story. Management continues ramping operations, but the bigger strategic question is the consortium for CBG (compressed biogas) plants. India’s accelerating transport decarbonization framework—particularly its ethanol blending ambitions, could create a multi-year growth runway for Verbio’s technology and feedstock expertise. Specialty Chemicals: The hidden growth engine Another major development is Verbio’s specialty chemicals business, still on track for H2 2026 startup. This should not be viewed as a margin story initially. This is about: • Revenue diversification • Higher value-added products • Reduced dependence on commodity biofuel cycles If executed well, this could fundamentally change how the market values Verbio over time. My Q3 view My base case is that Q3 could be the quarter where operational execution finally meets regulatory clarity. My estimates: Q3 EBITDA: €60M+ Driven by: • Higher THG pricing • Higher Ethanol prices followed by higher crush margins • Full benefit from removal of double counting • Recovery in biodiesel production post maintenance • Sourcing of rapeseed 2-3 months in advance before the biodiesel price took of due to war • Continued US ramp-up FY 2025/26 Guidance Current market expectations may still be too conservative. My upside case: €150–200M EBITDA If management confirms stronger spreads and demand visibility, I would not be surprised to see guidance move higher. For most of the last year, Verbio was held back by regulatory uncertainty. That uncertainty is now turning into policy support. With: • RED III now law • Double counting removed • THG prices repricing sharply • Record production across multiple regions • New chemical revenues approaching Q3 could be the quarter where the market stops valuing Verbio on depressed trough earnings—and starts pricing structural earnings power instead. A factual note: Q2 reported EBITDA was €30.1M, with H1 EBITDA of €45.5M, and management already firmed guidance upward after H1. Verbio also raised FY26 EBITDA guidance again in March 2026. From here, the key question is no longer if demand returns. The question is how quickly margins normalize. This is analysis, not investment advice.
XETR:VBKLong
by Cryptovicci
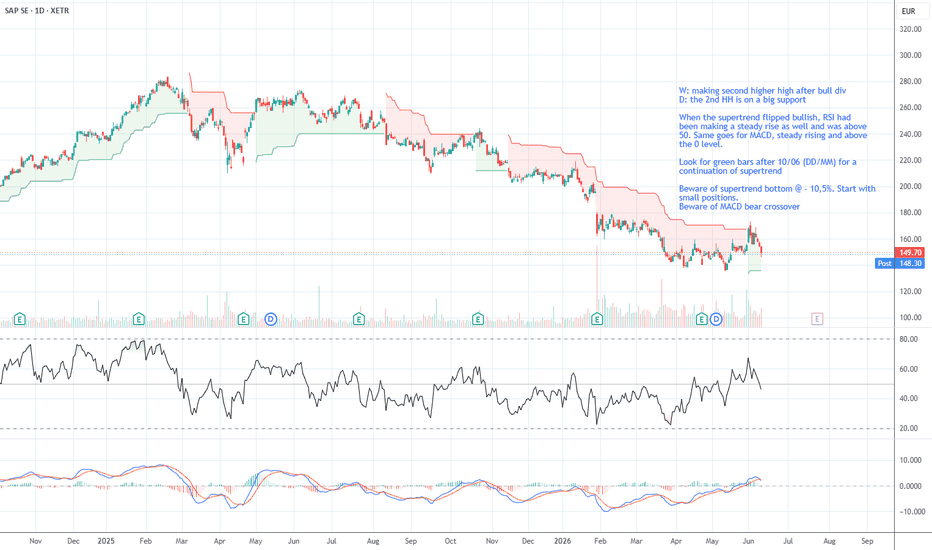
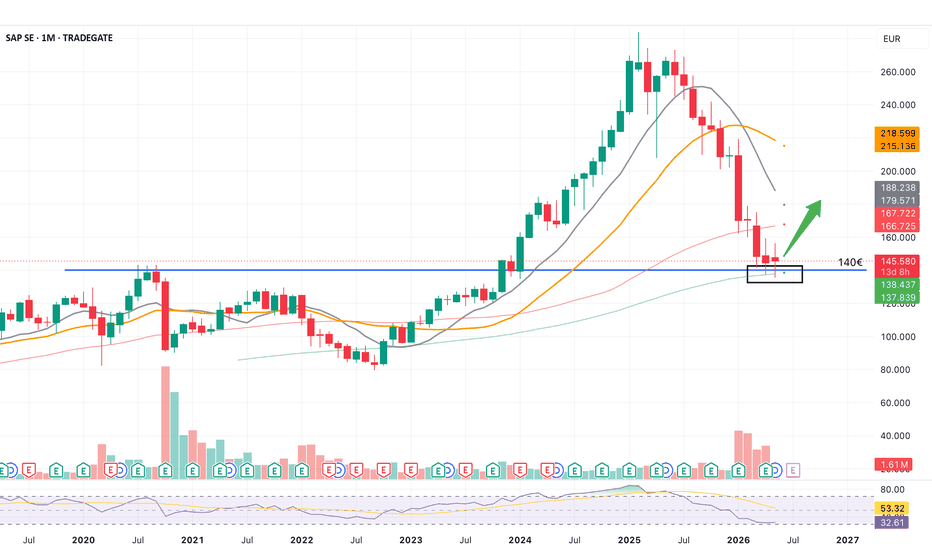
SAP is a Strong buy Latest developments in my Linkedin Post Fundamentals are super strong, technicals are beginning to interest
XETR:SAPLong
by ArfienPk92
Updated
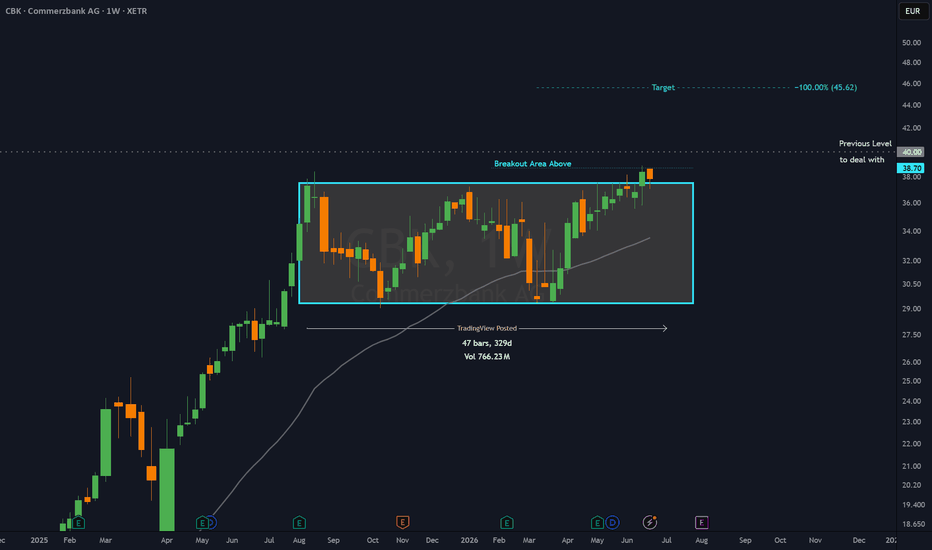
Commerzbank accelerates its restructuring amid UniCreditCommerzbank accelerates its restructuring amid UniCredit pressure By Ion Jauregui – Analyst at ActivTrades Commerzbank has intensified its defensive strategy against the advance of UniCredit, after announcing an efficiency plan that includes around 3,000 job cuts and an internal reorganisation aimed at strengthening profitability and its independent positioning. The move comes in a context in which UniCredit has increased its exposure to around 30% of the capital, including direct holdings and financial instruments. From Commerzbank’s perspective, the integration project proposed by the Italian bank continues to be seen as insufficiently defined, with the German lender describing it as “vague”, referring to the lack of clarity regarding synergies and the integration model. The German government, with a stake of approximately 12% inherited from the 2008 bailout, continues to play a relevant role in the development of the situation. Berlin is cautiously monitoring the rising foreign influence over a systemic national bank in a context of growing sensitivity around European financial autonomy. UniCredit, for its part, argues that a potential integration would create one of the largest banking groups in Europe, delivering scale gains, cost reductions and greater competitiveness against major international financial institutions. Fundamentals On the fundamental side, Commerzbank has improved its financial profile in recent years, supported by the high interest rate environment in the eurozone and strict cost discipline. The bank has strengthened its net interest margin, improved capital ratios and increased profitability, which has reinforced institutional interest in the stock. The bank also maintains relatively contained exposure to commercial real estate compared with other European peers, a relevant factor in a context of economic slowdown and tighter financial conditions. The new efficiency plan aims to consolidate this improvement through further cost reductions and greater digitalisation, with the objective of strengthening earnings generation capacity without the need for corporate integration. Key risks include macroeconomic weakness in Germany, credit slowdown, and the political and social impact of workforce adjustments. Nevertheless, the bank’s solid capital position continues to support its defensive profile within the sector. Technical analysis of Commerzbank (Ticker AT: CBK) From a technical perspective, ETR:CBK maintains a bullish structure in medium- and long-term timeframes, supported by both improving fundamentals and the speculative component linked to the corporate scenario involving UniCredit. After reaching highs in January around €37.24, the stock entered a consolidation phase that led to support being tested twice in March around €29.32, forming a double-bottom structure. Since then, the stock has resumed an upward trend with higher highs and higher lows. The price remains above the Point of Control at €32.05, with key support located around €33.45, preserving the broader bullish structure as long as buying interest persists. The stock recently reached highs at €37.54, followed by a correction towards the €35.42–€35.44 area, reflecting profit-taking after the latest impulsive move. In the short term, the technical outlook remains constructive as long as the price stays above the 50-period moving average. The 100-period moving average acts as an additional structural support. A break below €32 would represent a meaningful deterioration of the technical outlook, with downside risk towards March lows. The RSI stands around 54.52, in neutral territory, while the MACD remains positive, although the histogram shows declining momentum. The ActivTrades Europe Market Pulse indicator reflects a moderation in risk appetite following the previous bullish phase, shifting towards a more neutral environment. Relevant market dispute in 2026 The Commerzbank case remains one of the key corporate focus points in the European banking sector. The bank is reinforcing its independence strategy through efficiency measures, while UniCredit gradually increases its stake and keeps the option of a future integration open. The outcome will depend on both market-driven factors and regulatory and political developments, with particular attention to the role of the German government and the evolution of the macroeconomic environment in Europe. ******************************************************************************************* The information provided does not constitute investment research. The material has not been prepared in accordance with the legal requirements designed to promote the independence of investment research and such should be considered a marketing communication. All information has been prepared by ActivTrades ("AT"). The information does not contain a record of AT's prices, or an offer of or solicitation for a transaction in any financial instrument. No representation or warranty is given as to the accuracy or completeness of this information. Any material provided does not have regard to the specific investment objective and financial situation of any person who may receive it. Past performance and forecasting are not a synonym of a reliable indicator of future performance. AT provides an execution-only service. Consequently, any person acting on the information provided does so at their own risk. Political risk is unpredictable. Central bank actions can vary. Platform tools do not guarantee success.
XETR:CBK
by ActivTrades
JenoptikMost photonics companies have hugely pumped but Jenoptik is still only +100% since the previous bottom. It seems to be a good pick while the photonics hype is just getting started.
XETR:JENLong
by Seren222
Updated
History Repeating?Conviction is high on this: The Q4 margin strength (46% gross, 31% EBIT), robust cash generation, and optoelectronics/AI data centre tailwinds outweigh the conservative 2026 revenue guidance. Debt is extremely low (almost negligible). This is a strong European semiconductor equipment play with 20–50%+ upside potential in 12–18 months. Not financial advice, please do your own research.
XETR:AIXALong
by yoitskraft
Updated
LPK (1D) — LIDE breakout follow-through: +52.9% in two weeks XETR:LPK LPKF Laser & Electronics closes Friday May 5 at €21.40 after two weeks of follow-through on the structural breakout reported in the prior idea, () from April 23. Since that €14.00 close price has rallied +52.9 %, printing a fresh high at €21.90 on institutional volume and leaving the structural target at €26.80 still 25 % away. This note updates the multi-timeframe picture using the same methodology as the prior idea, now on Daily / 4H / 1H horizons, with non-essential layers removed (Liquidity Zones, SuperTrend, ZigZag) to focus the read on EMA structure, momentum (MACD, TRIX, RSI), saturation (multi stochastics) and flow (A/D + volume). Fundamental context remains intact: LIDE / glass-substrate narrative as a core piece of advanced packaging for AI chips, April 30 earnings already digested without negative surprise, and institutional accumulation confirmed in the Accumulation/Distribution flow. Daily Analysis — close at €21.40 well above the full EMA stack: EMA9 17.52 / EMA20 14.43 / EMA50 10.93 / EMA100 9.14 / EMA200 8.27. All five averages hold positive slope with no bearish crossovers on any scale, clean 9>20>50>100>200 alignment. The price–EMA9 distance (~22 %) reflects the verticality of the post-breakout impulse: the daily candle on April 24 opened at 17.15 and closed at 18.85 on volume of 1.51M (5.5× the 60-session average), textbook institutional breakout confirmation above the 18.00 zone that had acted as ceiling since 2021. Daily MACD at 3.16 above Signal 2.41 with histogram +0.76 — momentum still expanding, no slope loss. Daily TRIX Fast 5.12 above Slow 5.05 with histogram +0.07 — bullish cross still alive. Daily Multi Stochastic in upper zone and embedded: Stoch 89 = 91, Stoch 50 = 91, Stoch 14 = 89, Stoch 5 = 76 — slows glued above 90 read as trend strength, not exhaustion, while the fast starts to relax. Daily RSI 14 at 79.2 — clear technical overbought. Daily RSI 2 at 83.4 — short-term extreme. Daily Accumulation/Distribution at +9.93M — institutional flow accumulating sustainably with no visible distribution. Macro read: primary and secondary trends fully bullish, breakout confirmed by volume and A/D, overbought present but consistent with a name in acceleration after liquidating years of bearish dominance. 4H Analysis — close at 21.40 with full EMA stack aligned: EMA9 20.10 / EMA20 18.62 / EMA50 15.61 / EMA100 12.76 / EMA200 10.36. The 18.62–20.10 cluster (4H EMA20–EMA9) is the operative reference for a first pullback, and the 15.61 step (4H EMA50) defines depth if the name needs to digest overbought before continuation. 4H MACD at 1.75 above Signal 1.56 with histogram +0.19 — still positive but the histogram stops expanding, first signal that the impulse loses acceleration even while preserving direction. 4H TRIX Fast 1.96 above Slow 1.58 with histogram +0.39 — bullish cross fully alive, no signs of bearish cross on the near horizon. 4H Multi Stochastic in extreme zone and embedded: Stoch 89 = 99, Stoch 50 = 98, Stoch 14 = 97, Stoch 5 = 93 — maximum saturation, but with all four levels glued up, classic signature of strong impulse breathing without losing pulse. 4H RSI 14 at 68.7 — high but not formally saturated above 70. 4H RSI 2 at 91.1 — short-term extreme. 4H Accumulation/Distribution at +5.77M, aligned with the daily read. Intermediate read: structure fully bullish, momentum still in favor but no longer accelerating, slow stochastics embedded validate that trend strength remains intact and that the probable pause is sideways or a healthy correction, not reversal. 1H Analysis — close at 21.40 with clean EMA stack: EMA9 21.20 / EMA20 20.60 / EMA50 19.15 / EMA100 17.38 / EMA200 14.74. Price practically resting on the 1H EMA9, the first operative intraday support. 1H MACD at 0.79 marginally below Signal 0.81 with histogram −0.024 — first negative histogram print since the impulse started, incipient bearish cross not yet fully confirmed. 1H TRIX Fast 0.41 below Slow 0.59 with histogram −0.185 — confirmed bearish cross on the hourly, short-term alert. 1H Multi Stochastic shows the first visible friction: Stoch 89 = 96, Stoch 50 = 95, Stoch 14 = 87, Stoch 5 = 81 — the fast (Stoch 5) has crossed below the classic (Stoch 14) on the latest leg, first bearish cross of the hourly macro. But the two slows (Stoch 89 and Stoch 50) stay glued above 95: fasts cooling while slows hold embedded — classic pattern of strong impulse breathing without reversing. 1H RSI 14 still high at 66.0, 1H RSI 2 already cooled to 45.0. 1H Accumulation/Distribution at +2.75M, no visible distribution. Intraday read: pause inside trend, not reversal. The "fasts cooling + slows embedded + positive A/D" combination is the typical signature of an impulse preparing to consolidate before the next extension, not a top. Key levels - Immediate resistance 21.90 — current high, weekly close above this opens free extension toward the structural target - Structural target 26.80 — alive since the prior idea, +25 % away from current price; coincides with Fibonacci extension and structural projection of the breakout above 18 - Support 1: 20.10 — 4H EMA9 — first healthy pullback zone, ideal for reactivation with volume - Support 2: 18.62 — 4H EMA20 — deeper pullback, still fully bullish, classic re-entry zone in impulses - Support 3: 17.52 — Daily EMA9 — daily close loss would open intermediate corrective leg toward 14.43 - Support 4: 14.43 — Daily EMA20 — coincides with the prior idea's operative base, major structural support - Partial invalidation: daily close below 14.43 would break impulse speed without invalidating the multi-month thesis - Structural invalidation: weekly close below 10.93 (Daily EMA50) would be the first event challenging the multi-year breakout narrative Setup Rating — 7.5/10 (Bullish with operative patience) ✅ Positive factors - Daily and 4H EMA stack impeccable, no bearish crossovers on any scale - Breakout candle above 18 with volume 5.5× average — textbook institutional confirmation - Accumulation/Distribution at highs across all three timeframes — sustained institutional flow without distribution - Slow stochastics (Stoch 89 and Stoch 50) embedded above 90 on Daily and 4H — trend strength intact - Daily MACD histogram still expanding — primary momentum has not lost slope - Daily TRIX in active bullish cross, no near-term bearish cross threat - April 30 earnings already digested, no near-term binary risk - Prior target (26.80) still 25 % away — significant potential travel still available - Fundamental narrative (LIDE / glass substrates as core piece of AI packaging) fully intact ⚠️ Cautions - Daily RSI 14 at 79.2 demands patience for clean entry — buying at market here is suboptimal - Extreme stochastics on Daily and 4H simultaneously — proximity to probable pause - 4H MACD histogram stops expanding — intermediate loss of acceleration - 1H TRIX already in bearish cross and 1H MACD with negative histogram — first real intraday friction - +52.9 % travel in two weeks without meaningful intermediate pullback — accumulated elasticity demands digestion - Price–Daily EMA9 distance ~22 % — very high extension on the short-term dynamic 👍 Bullish scenario (most likely) Technical pullback to the 18.62–20.10 cluster (4H EMA20–4H EMA9) bought with volume and reset of 4H and 1H stochastics. 4H close defending 18.62 validates a second bullish leg toward the 26.80 structural target (+25 %) on a 4–8 week horizon. Variant: sideways consolidation between 19.30 and 21.90 while overbought digests, resetting momentum without losing structure, and subsequent breakout above 21.90 reactivating the primary impulse. 🔁 Healthy consolidation / digestion scenario 19.30–21.90 range during 1–3 weeks while stochs reset on 4H and intraday EMAs catch up to support price. Weekly close above 20.00 with stable A/D maintains the thesis intact and upgrades setup rating to 8/10 once technical overbought has been purged without structural loss. 👎 Bearish scenario (healthy correction, not invalidation) Loss of 17.52 (Daily EMA9) on daily close opens intermediate correction toward 14.43 (Daily EMA20), the zone coinciding with the operative base of the April 23 prior idea. This correction would not break the multi-month structural thesis — Daily stack would remain intact and A/D would not show distribution while price holds above Daily EMA50 (10.93). Only a weekly close below 10.93 would be the first event forcing review of the multi-year breakout narrative.
XETR:LPKLong
by EdoLab-Markets
33
VERBIO $VBKVerbio is heading towards an record Q3 report. It is structurally demand on compliance markets, built up by the energy security need in Europe. THG Quota is trading at +470 EUR/t vs 220 EUR/t previous year. Biodiesel is structurally up due to Iran war, while the feedstock is stable. Bioethanol has not seen crush margins this bullish since last bull cycle in 2022. Verbio is one of the markets most efficient company generating THG compliance quota, for every ton biodiesel = 2 tco2. Neste presented their quarterly report confirmed the market bullishness in biofuels.
XETR:VBKLong
by Cryptovicci
Sinopec – Value Confluence, Acceptance Above Trigger Price testing value (~0.48–0.50) with confluence from rising trend support. Acceptance defined as break above value (green line) → look for rotation higher; failure = continuation lower. Sector: Energy remains in relative strength - pullbacks offering structured entries.
HAN:CHULong
by VMS-Phil
Updated
LPK follow really standard upward trend pattern Higher high higher low Wait for the retest after breakout
XETR:LPKLong
by jackieeeeeeeee
11
softweare with value underpricedlets buy this dip, these softwear giants will survive
XETR:SAPLong
by stefanreiningerbusiness
LPKG (1D) – Structural breakout on LIDE technology narrativeXETR:LPK LPKF Laser & Electronics (LPKG) has moved from the sidelines to the epicenter of the AI narrative thanks to its LIDE (Laser Induced Deep Etching) technology. This vertical move is not just an impulsive reaction; it is a structural breakout that liquidates years of bearish dominance. As glass substrates become the new standard for advanced packaging, the market is aggressively re-rating the asset. Timeframe Monthly (1M) At the macro level, the monthly candle shows a massive expansion of 124.33%. In this chart, we observe that the monthly MACD is crossing above the zero level (0.499), with a histogram beginning to show positive acceleration after years in negative territory. The RSI 14 (68.89) and RSI 2 (92.14) show an unprecedented inflow of momentum. Meanwhile, the monthly stochastic panel indicates a K89 at 15 (exiting the floor zone), a K50 at 30, and a K14 at 48, while the K5 is already flying at 61. This confirms that the long-term cycle is just waking up from an extreme oversold phase that lasted years. Timeframe Weekly (1W) On the weekly chart, volume stands at 4.14M, validating the institutional intent behind the rally. The weekly MACD shows a very strong histogram at 0.727 with signal lines at 0.940, decisively exiting the zero level. Analyzing the weekly stochastic panel, we see a maximum strength configuration: K89 at 68, K50 at 71, K14 at 78, and K5 at 81. All are aligned upwards and entering the expansion zone. The weekly RSI 14 is at 83.45 and the RSI 2 at an extreme 99.41, confirming the verticality of the move. Capital flow in this timeframe (Accum/Dist) skyrockets to 6.2M, indicating real and sustained accumulation. Regarding the exponential structure, price has crossed above the EMA 100 (purple) at 7.68 and the EMA 200 (red) at 9.26, shifting a multi-year bias. Timeframe Daily (1D) After the peak at 18.10, the price is correcting -8.09% today. In this timeframe, the EMA structure shows the EMA 9 (green) at 12.46, EMA 20 (yellow) at 10.40, EMA 50 (blue) at 8.59, EMA 100 (purple) at 7.79, and EMA 200 (red) at 7.56. Price maintains dynamic support well above the EMA 9 (green), which is a sign of an extremely strong trend. The daily MACD is at 1.933 with a histogram of 0.716. In the daily stochastic panel, we observe K89 at 82, K50 at 81, K14 at 80, and K5 at 69. The fact that the K5 is starting to turn downwards while the slow ones (K89, K50) remain in the upper part confirms that we are in a short-term technical correction within a larger impulse. Daily RSI 14 is at 76.03 and RSI 2 has dropped to 47.06, indicating that short-term overbought conditions are clearing. Daily Accumulation/Distribution remains very healthy at 8.87M. Trend Analysis (SuperTrend) The SuperTrend (1W) has flipped to green (bullish) after 42 consecutive sessions in bearish territory. The current value of the indicator is at 10.40, coinciding exactly with the daily EMA 20 (yellow), which reinforces this level as the most important structural and psychological support in case of a larger correction. Structure and Fibonacci (ZigZag) The ZigZag (1D) currently marks a bearish direction due to the rejection at 18.10. The last pivot recorded was an LL (Low Low) at 5.85. The current 13.24% retracement from highs is seeking support at Fibonacci levels. Reference levels are at 7.45 (1.000) and the current consolidation level. The swing structure shows that the impulse has easily surpassed all previous resistance pivots (LH/HH). Liquidity Zones and Targets The liquidity zones tool detects 2 active zones above the current price. The nearest resistance is located at 26.80, representing a target at +87.41% distance. Already 8 liquidity zones have been taken during this rally, including key levels at 15.50 and 19.95. There are no nearby tested liquidity supports below, meaning the price relies on the EMA structure and Fibonacci to find a floor. Fundamental Context and Catalysts The market is anticipating LPKF's strategic role in the glass substrate (TGV) ecosystem for AI chip packaging. The pilot line with TPK and ASE for 2026 is the fundamental driver of the rally. Upcoming Earnings on April 30 will be the immediate catalyst to validate if these expectations are backed by management. Setup Rating: 8/10 ✅ Macro breakout with historical weekly volume. ✅ Weekly SuperTrend flip after 42 bearish sessions. ✅ Strong institutional accumulation (8.87M) validating the move. ⚠️ Severe technical overextension relative to the EMA 200 (red) at 7.56. ⚠️ Weekly RSI at technical saturation levels (83.45). 👍 Bullish scenario Consolidation in the 14.00 area to attempt a new attack on 18.10. If price breaks that high with volume, the next macro liquidity target is at 26.80. 👎 Bearish scenario Continuation of the correction towards the EMA 9 (green) at 12.46. If this level is lost, the major support and institutional buying zone is at 10.40 (EMA 20 yellow and weekly SuperTrend value). Bullish or bearish from here? Let me know below 👇
XETR:LPKLong
by EdoLab-Markets
66
Possible last push upCompleted ABC correction. Possible to have one more push up to new temporary all time high before move down.
XETR:RHMLong
by shiftpark
Double top formation and falling trendRHM has experienced both a significant and a marginal downside breakout from a double top (DT) formation, accompanied by increased volume. The stock has since rebounded, but it remains within a falling trend channel. It is therefore likely that another test and potential breakdown of the neckline of the double top formation will occur. If a significant breakout materializes, the stock could decline to 1125 or lower. A double top formation is a bearish reversal pattern. The trend is relatively short-term and is not yet fully reflected in the indicators. However, a negative volume balance and a declining RSI 21 support the bearish trend. When a stock is in a trend, it tends to remain in that trend until the opposite is proven. The stock is trading well below the red Ichimoku cloud. From a technical perspective, the stock is bearish in the medium term, i.e. 1 to 6 months. This analysis is not a long-term forecast. Fundamental analysts are clearly positive on the stock. Disclaimer: I do not own the stock directly, but I have exposure through an ETF. Note: You must conduct your own research and assessment before making any buy or sell decisions.
XETR:RHM
by scorpiris
Updated
88
SAP rebound setup as traders watch $180 support:Current Price: 181.22 (Analysis was generated on Monday Morning) Direction: LONG Confidence level: 58%(Limited trader data but slightly bullish X sentiment, strong analyst upside, and price trading near major support after a large decline) Targets Target 1: 186.50 Target 2: 191.80 Stop Levels Stop 1: 176.40 Stop 2: 171.90 Key Insights: Here’s what’s driving the setup right now. SAP has dropped roughly 30% over the past year and is trading much closer to its 52‑week low than its high. That kind of drawdown often attracts value-focused traders looking for oversold tech names, especially when fundamentals are still growing. At the same time, analysts continue to publish very optimistic long‑term targets around the $275–$300 range. For a short‑term trade this week, that doesn’t mean we expect a huge rally immediately, but it does tell us institutional sentiment toward the company is still constructive. Another piece of the puzzle is the ongoing AI integration across SAP’s enterprise software stack. Several traders highlighted how SAP is embedding AI into HR, finance, and customer‑experience workflows. That narrative has been driving interest again after the stock’s recent bounce. Recent Performance: You can see this shift in the price action. SAP recently rebounded from the $167–$170 zone and pushed back above $180. Over the last few sessions the stock gained roughly 2–4% as buying interest stepped in. Volume has also picked up compared to the monthly average, suggesting traders are beginning to defend this level. Still, the stock remains below its 50‑day moving average near $187, which means short‑term resistance is close. That’s why the targets are conservative for this week. Expert Analysis: Several professional traders are watching the $175–$180 area as a key technical support band. The reasoning is simple: it’s close to recent lows and historically where buyers stepped in during the last bounce. On the upside, many traders expect the first real test to happen near the 50‑day moving average around $186–$188. If SAP can push through that zone, momentum traders could chase the move toward the low $190s quickly. Social sentiment on X is slightly bullish as well, with more traders discussing potential rebounds than breakdowns. It’s not overwhelming conviction, but the tone is shifting from pessimism to cautious accumulation. News Impact: Recent news about SAP’s expanding AI capabilities and integration across enterprise systems has helped sentiment stabilize. Updates around the Business AI platform and acquisitions supporting its data‑cloud strategy are keeping the company positioned in the enterprise AI conversation. In addition, the company’s strong cloud backlog growth and ongoing share buyback program add another layer of support for investors watching the stock after its big correction. Trading Recommendation: Putting it all together, I’m leaning toward a short‑term LONG trade while SAP holds above the $175 support zone. The plan is straightforward: look for a bounce toward $186 first, with momentum potentially carrying it toward $191 if buyers step in. Risk management matters here because the broader trend is still recovering. If price slips below $176, momentum likely weakens quickly, which is why the stops sit under that support band. This is essentially a support‑rebound trade rather than a full trend reversal bet — a modest upside move within the next week is the realistic target.
XETR:SAPLong
by CrowdWisdomTrading
SAP Deep in AccumulationTake a look at SAP through the lens of structure. Right now, price has moved deep into the TrendGo Accumulate zone - and that is exactly where charts usually stop looking attractive. That is the point. Accumulation is not the phase where the market looks strong. It is the phase where price weakens, sentiment cools off, and the chart starts to feel uncomfortable. But structurally, that is often where the next cycle begins to build. On SAP, the current setup stands out because price has now entered a zone that previously marked an important rebuilding area. This does not mean the bottom is confirmed. It means the stock is no longer trading in a random place on the chart. It is now in a location where downside pressure can begin to transition into stabilization. What matters here: • price is deep in the Accumulate zone • the decline has already pushed the chart into a structurally important area • this is where patience matters more than emotion • the market may now start shifting from clean weakness into a rebuilding phase This is not about predicting the exact reversal. It is about recognizing where risk/reward starts to change. Most participants only become interested once recovery is already obvious. But the real opportunity often starts earlier - when price still looks damaged, when confidence is low, and when the chart has not yet made the turn visible to everyone. That is exactly why Accumulation matters. SAP is now in one of those zones. Definitely one worth watching closely from here. Free TrendGo Accumulate available on TradingView.
XETR:SAP
by StructuraMarkets
Volkswagen Shares Hold Above 88 as Rivian Partnership Boosts Shares of Volkswagen AG are trading slightly above 88.00, stabilizing within a broader market correction. Investor sentiment improved after the company announced progress in its software partnership with Rivian Automotive. ⸻ Rivian Partnership Enters New Phase Volkswagen confirmed that winter testing of vehicles using Rivian’s software platform was successfully completed: • Tested at temperatures as low as –25°C • Supports 15+ sensor systems • Compatible with 20 electronic control units The platform will be used in future models from: • Volkswagen • Audi • Scout Motors ⸻ Major Investment in Software Strategy Key project details: • Initial engineering investment: €2.3 billion • Total partnership investment: $12 billion+ • Last payment: $5.8 billion (Nov 2024) Expected benefits: • Up to 500,000 EVs annually • Level 2+ autonomous driving • Faster model development (18–24 months) The partnership strengthens competition with: • Tesla • BYD • Global EV leaders ⸻ Earnings Outlook The Q1 report will be released April 30: • Revenue forecast: €78.90B (vs €77.56B YoY) • EPS forecast: €4.43 Dividend outlook: • Previous dividend: €6.30 • Expected yield: 7–8% • Industry median: 4.64% ⸻ Technical Analysis Volkswagen is attempting to rebound: • Ascending channel support: 115–96 • Sell signal weakening Indicators: • Alligator: bearish but weakening • AO: corrective negative bars ➡️ Potential stabilization forming ⸻ Key Levels Resistance • 92.00 • 100.00 Support • 85.00 • 75.50 ⸻ Trading Scenarios Bearish Scenario Sell below 85.00 • Entry: 84.95 • Target: 75.50 • Stop-loss: 90.00 • Timeframe: 7 days or more ⸻ Bullish Scenario Buy above 92.00 • Entry: 92.05 • Target: 100.00 • Stop-loss: 89.00 ⸻ Outlook Volkswagen remains supported by: • Rivian software partnership • EV expansion strategy • Strong dividend outlook • Break above 92.00 → bullish continuation • Break below 85.00 → downside risk Short-term outlook remains neutral with bullish potential.
XETR:VOW
by John_Isige
Diagonal downtrend resistance.After hitting the 400dayli SMA wich is were institutions want to load up. Rheinmetal has found support and is now heading for ATH. We will soon break this downtrend resistance and head back to ATH and new highs. We been trading in a rectangle pattern for the past year and the price target would be €2500
XETR:RHMLong
by tisfluppe
Rheinmetal 400dsmaRheinmetal has hit the 400 dayli SMA and diagonal resistance. €1330 was the bottom where probally alot institutions has their orders ready.
XETR:RHMLong
by tisfluppe
11
PNE AG: A juicy entry point or a trap for long-term investors?XETR:PNE3 is sitting on a 'make-or-break' intersection of multi-year levels—here’s why the next move could either ignite a 60% rally or trigger a free fall Technicals: - price is testing the intersection of the lower boundary of the 2023 downtrend and that global support zone from 2021 - if market sentiment turns negative and price breaks support, a free fall toward 7.90 seems likely — that’s basically the last barrier holding the price up - if the positive scenario plays out, look for an Expanding Triangle pattern to trigger a test of the mid-range of the descending channel - the main target is the imbalance zone from Sep-Oct 2025 — expect heavy profit-taking from mid-term traders in that area - long scenario invalidated if 2 bars close below 7.90 Fundamentals: - GETTEX:PNE3 shares dropped 8% last month after the 2025 fiscal year earnings downgrade, triggered by short-term traders closing their positions - having sold their Panama windfarm portfolio in January 2026, the company signals a strategic shift toward Germany, France, and Poland. This move is backed by new capacity permits recently secured in Germany in December - in the short term these can drive short-term traders or weak hands out, but the mid-to-long-term recovery story now looks even more intact - the company is definitely not a giant and still has high debt ratio, and this is a key risk which might negatively impact the share price in case the EU decides to increase % rates - whereas European renewables sector faces headwinds and receives less support than it should, in my opinion, the limited fossil fuels might make green energy a solid long-term bet Conclusion: - the 8.50–9.10 zone plays a key role in determining the medium-term price action - if this level holds, the price could head toward 12.20, with a long-term target of 15.00 - if the support zone fails, it opens the door for a retest of 7.90 - 8.80 serves as an attractive entry price for long-term investors, but short-term traders are advised to wait for a clear outcome: a strong bullish candle, consolidation at the support zone, or a decisive breakdown # - - - - - ⚠️ Long-Term Signal - Buy ⬆️ ✅ Entry Point - 8.80 🛑 SL - 7.78 🤑 TP - 12.14 ⚙️ Risk/Reward - 1 : 3.2👌 # - - - - - Good Luck! # - - - - - DISCLAIMER: Not financial advice. Everyone must make trading decisions at their own risk, guided only by their own criteria and strategy for opening or not opening a trade
XETR:PNE3Long
by TotSamiyKaa
Updated
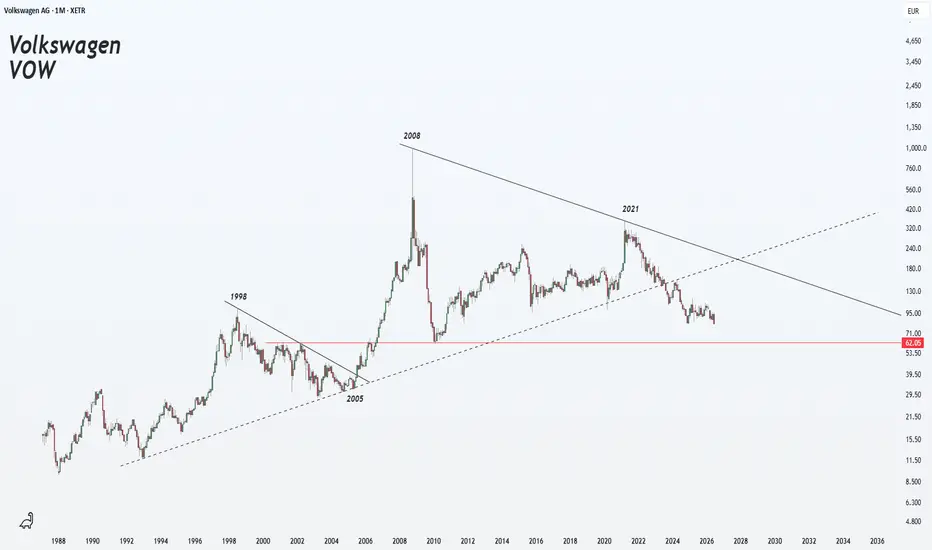
Volkswagen AG - Long-Term Opportunity DevelopingVolkswagen appears to have completed a full 5-wave impulse cycle, topping out around the 2021 highs. Since then, price action has transitioned into a broader corrective phase, likely unfolding as an ABC structure. Wave A marked the initial sell-off, followed by a Wave B recovery. Currently, price action suggests we are in Wave C, which typically represents the final leg of a correction. From a structural perspective, the trend remains weak: Lower highs and lower lows No confirmed reversal yet Price trading below key retracement levels Key Levels 61.8% retracement (~105€): First major resistance 78.6% – 88.7% zone (~55–75€): High-probability demand zone Long-term support (~34€): Historical floor My Plan (Long Setup) I am not looking to enter at current levels. Instead, I’m watching for price to move into the 55€–75€ zone, which aligns with: Deep Fibonacci retracement levels Potential completion of Wave C Long-term value area within the broader range This zone offers a high risk/reward long opportunity if: Price shows signs of stabilization Selling pressure weakens A structural shift begins (higher lows / reclaim of key levels) Invalidation / Risk A clean breakdown below ~55€ would suggest a deeper structural shift No confirmation = no position Conclusion Volkswagen is not currently in a trend phase, but rather in a long-term corrective structure. The focus is on patience and positioning in extreme value zones, not chasing price. This is a planned long setup, not an active trade.
XETR:VOWLong
by MikaDuck
Short term bearish 150€ targetTrading 60% above the 200 DMA can't be sustained for long, also big detachment from every long term volume weighted average price 1.618 fib extension at 175€ looks to be a great short term bearish entry profit-target 150€ long term bullish
XETR:NDAShort
by vvedding
Updated
VERBIO energy scarcity cycle Sentiment is flipping. The cycle is screaming. Energy scarcity is the trigger. Seed is planted, let us revisit the outcome in 1,000 days.
XETR:VBKLong
by Cryptovicci
HAG possible re-accumulationI think HAG might be showing a potential re-accumulation schematic here. But given current market conditions I'm cautious. I'd like to see some Higher-Lows form here, with a break above the diagonal. If we break above and get a potential retest, that might provide a nice entry.
XETR:HAGLong
by Martechnic
Updated
112233445566778899101011111212131314141515161617171818191920202121222223232424252526262727282829293030313132323333343435353636373738383939404041414242
…999999

Made by humans

Select market data provided by ICE Data Services. Select reference data provided by FactSet. Copyright © 2026 FactSet Research Systems Inc.Copyright © 2026, American Bankers Association. CUSIP Database provided by FactSet Research Systems Inc. All rights reserved. SEC filings and other documents provided by Quartr.© 2026 TradingView, Inc.

More than a product
  • Supercharts
Screeners
  • Stocks
  • ETFs
  • Bonds
  • Crypto coins
  • CEX pairs
  • DEX pairs
  • Pine
Heatmaps
  • Stocks
  • ETFs
  • Crypto coins
Calendars
  • Economic
  • Earnings
  • Dividends
  • IPOs
More products
  • News Flow
  • Portfolios
  • Fundamental Graphs
  • Yield Curves
  • Options
  • Macro Maps
  • Pine Script®
Apps
  • Mobile
  • Desktop
Community
  • Social network
  • Wall of Love
  • Refer a friend
  • House Rules
  • Moderators
Ideas
  • Trading
  • Education
  • Editors' picks
Pine Script
  • Indicators & strategies
  • Wizards
  • Freelancers
  • Paid Spaces
Tools & subscriptions
  • Features
  • Pricing
  • Market data
  • Gift plans
Trading
  • Overview
  • Brokers
  • Brokers comparison
  • The Leap
Special offers
  • CME Group futures
  • Eurex futures
  • US stocks bundle
About company
  • Who we are
  • Space mission
  • Blog
  • Help Center
  • Careers
  • Media kit
Merch
  • TradingView store
  • Tarot cards for traders
  • The C63 TradeTime
Policies & security
  • Terms of Use
  • Disclaimer
  • Privacy Policy
  • Cookies Policy
  • Accessibility Statement
  • Security tips
  • Bug Bounty program
  • Status page
Business solutions
  • Widgets
  • Charting libraries
  • Lightweight Charts™
  • Advanced Charts
  • Trading Platform
Growth opportunities
  • Advertising
  • Brokerage integration
  • Partner program
  • Education program
Community
  • Social network
  • Wall of Love
  • Refer a friend
  • House Rules
  • Moderators
Ideas
  • Trading
  • Education
  • Editors' picks
Pine Script
  • Indicators & strategies
  • Wizards
  • Freelancers
  • Paid Spaces
Business solutions
  • Widgets
  • Charting libraries
  • Lightweight Charts™
  • Advanced Charts
  • Trading Platform
Growth opportunities
  • Advertising
  • Brokerage integration
  • Partner program
  • Education program
Look FirstLook First