Deutsche Bank: Strong outlook 💪 Having completed the green wave B with its high in the last week of July, Deutsche Bank is now in a small correction that will complete the orange wave ii. Once this correction is over, our primary scenario is for a strong uptrend to break through resistance at 14.63€. If the price continues to fall, our alternative will be activated. According to this scenario, to which we assign a 35% probability, the price would move into our green target zone between 8.34€ and 5.60€, from where strong gains
ZALANDO BUY Hello, According to my analysis of zalando stock, there is a good investment opportunity. The stock has broken through the downward channel. It also broke the support at level 28. The double button pattern was breached. Which indicates that the stock is in a very positive condition. And confirms the strong entry of buyers. Good luck everyone
Continental CON Long term bullish cycleOur probability indicator has observed Long Term BOS (Break-of-Structure) on Daily TF.
Essentially what that means is that we closing in on bearish cycle for XETR:CON and new bullish leg is forming for longterm continuation of new bullish cycle.
We expect further bearish correction to 68.30 - 64.80 zone ( Current Inverse H&S pattern support zone ) where conditions for perfect LONG entry occur.
Take-Profit should be set within High resistance zone 114.50 - 139.30
Very undervalued H5EHelma's current assets - liabilities equals to ~120M vs ~20M market cap.
The company is profitable and projects profitability for 2023.
When market returns to normal conditions, the stock is likely to grow fast and steady to about ~30€ per share.
The company is at way better shape then at 2007-2009. However, it's trading at values that are 2.5x lower than in the worst period of the 2008 financial crisis. It would imply that the absolute lowest price for the stock is 14.3€.
Based on it's curren
HLong
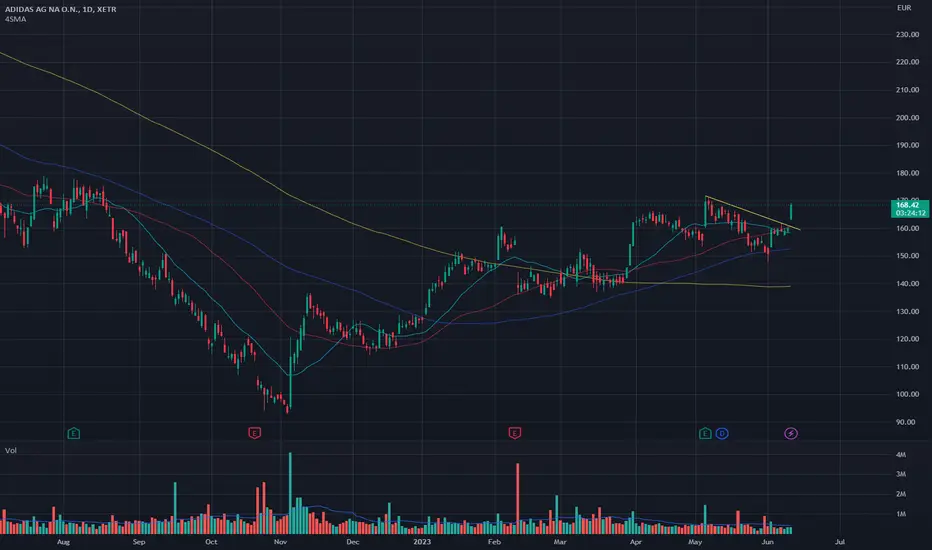
ADS BUYHi, According to my analysis of Adidas stock, there is a good chance that you will buy or invest in this stock for the long term. The stock is in a very positive condition, going in an upward channel. It also broke the strong resistance at the level of 170. It is expected that the price will return to the same area to retest the rise once again. Good luck everyone
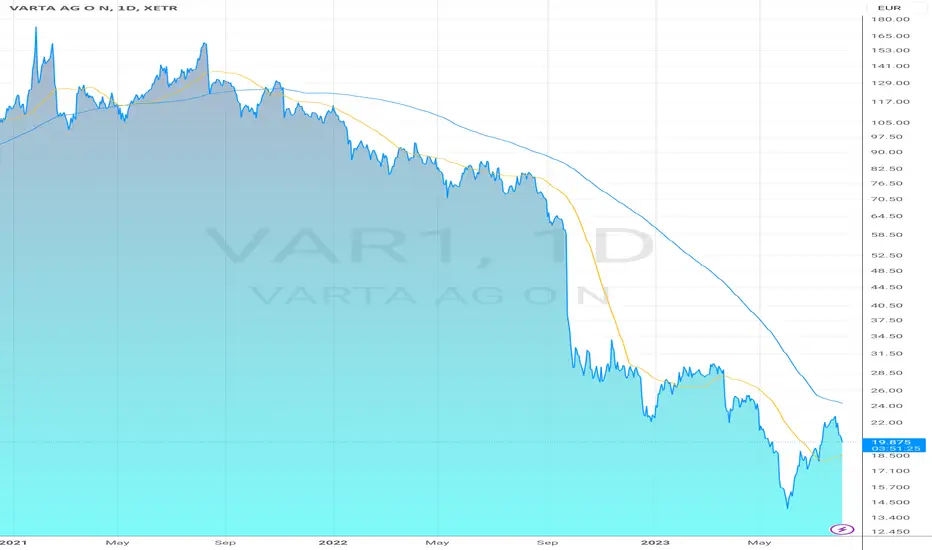
Varta : down down Anything that inflates suddenly, without logic, ends up like this... Ok batteries are the future. But the competition is great and the development companies have a lot of risk ... Despite the dip, it remains overvalued and can probably go even lower. Fund at 100 million, debt at 800. In the 10% of high-risk and contrarian stocks that a portfolio can contain...
V
F2Pool removed 200,000 LINK from Uniswap 8 hours agoAnd converted to 740 ETH and 155,000 USDC.According to Lookonchain monitoring, F2Pool co-founder Wang Chun (satofishi.eth) removed the liquidity of all 200,000 LINK (worth $1.54 million) from Uniswap 8 hours ago. He then converted these LINKs into 740 ETH ($1.38 million) and 155,000 USDC, with an average selling price of about $7.7.
Why Bayer Stock is a Great Long-Term Investment OpportunityBayer AG is a German multinational pharmaceutical and life sciences company founded in 1863. The company is headquartered in Leverkusen, Germany, and employs over 100,000 people worldwide. Bayer's core business areas are human and veterinary pharmaceuticals, consumer healthcare products, agricultural chemicals, and biotechnology products.
Bayer stock is a great long-term investment opportunity for several reasons. The first one is that its stock has created a strong weekly demand level located
Adidas: How fast are you? 👟Lately, Adidas has made fine progress in the scope of wave 2 in turquoise, moving toward the magenta zone between 157.06€ and 141.72€. Soon, the share should reach this price range and complete the current movement, before turning upwards to develop wave 3 in turquoise above the resistance at 187.78€. However, there is a 32% chance that Adidas could act faster, skipping the magenta zone and climbing above this mark earlier already.
Bottom of the RangeMunich Rueck held stable this year. Now we've seen the retracement of the rise since March by almost 38 %. However a further retracement is possible I consider the chance of a recovery from here. We have reached the bottom of the trading range which we are in since April and the current level of our favoured Moving Average.
RetestWe are trading within an old(since January) range. The stock tried to break out twice in March and April but fell back each time. Since April we are back in the original range. We may consider this range being a bulls' pannant so that more tests of the upside are more likely as long as the downside has not been challanged convincingly.
$SBX STRONG BUYXETR:SBX Analytics
15.06.2023
Consideration under WEEK
Indications
- 80% decline since its launch
- Solid levels around @EUR20, @EUR14, @EUR4 (±10%)
- Stable for around 30 days @EUR3,90 => BUY
- Weekly RSI at ATL of ~21.5 => super cheap rn => BUY
- Moving Average 9/20: 20 >> 9, crossover not predictable and could take at lease 6-8 weeks => RISK
- Moving Average 100: huge distance for crossover => RISK (bad historical stock performance)
- ZLSMA (W): Candels getting closer, crossover likely
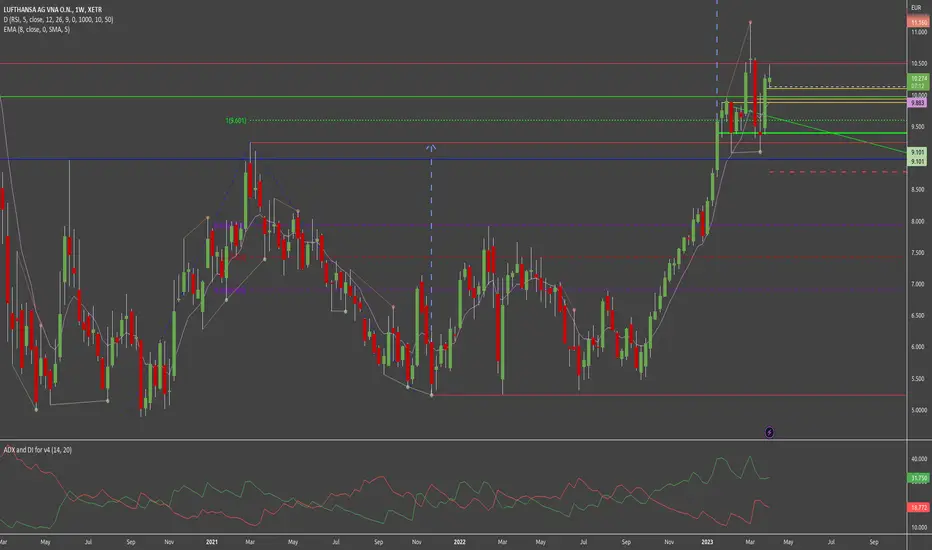
New AttemptAfter the Shooting star in the first and the following sharp decline in the second March week one might have expected a deeper correction of the rise since September. However the bulls were able to regain most of the terrain lost almost immediately. The market may have to pause after both bulls and bears are exhausted now. But it seems that there is no will to get out of the airline ahead of summer. May be not in the after Easter week but then we may be happy of new highs.