• Products
  • Community
  • Markets
  • Brokers
  • More
Get started
  • Markets
  • /Germany
  • /Stocks
  • /Ideas
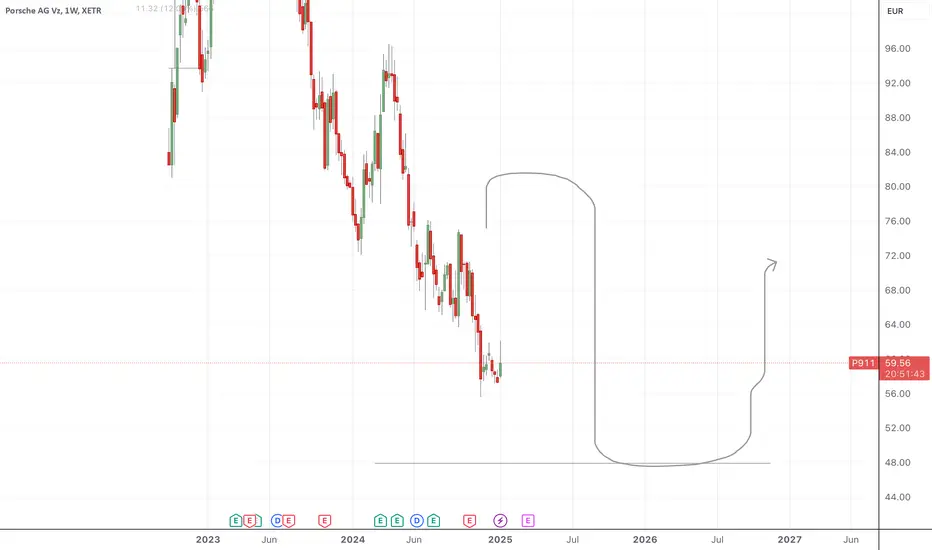
Wait 48 (buy Limit)I strongly believe that this will reach 48 and from there will bounce for the long term. It is here that I have set the best deal price.
XETR:P911Long
by treder
11
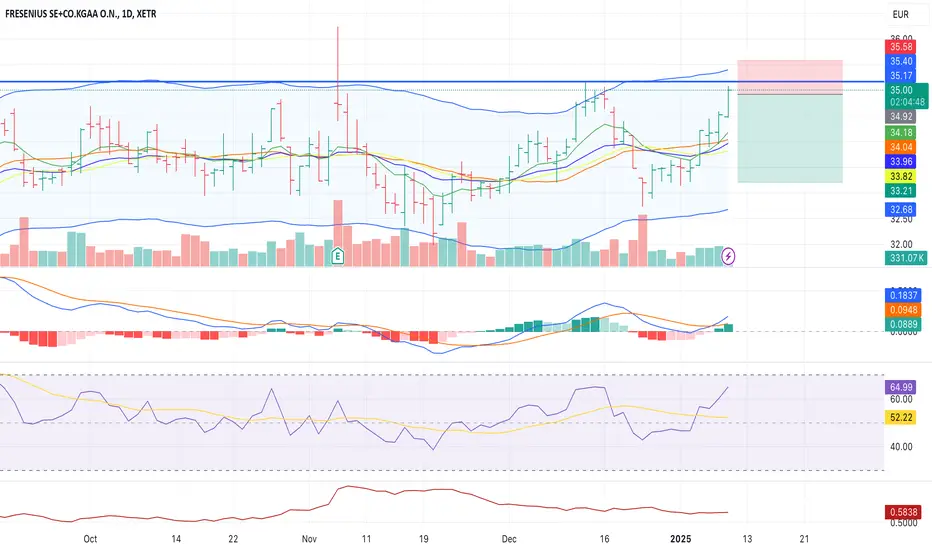
FRE Mean Reversion ShortRally has moved to range-bound market on weekly chart since September 24. RSI near 70 on the daily, and although MACD looks slightly bullish, volume behind this latest move towards the upper channel line doesn't seem strong enough. Short position near channel line with a tight stop (c. 1.0x ATR). Target is lower channel line, and if breakout to the lower side succeeds, until the next strong support at 30.7
XETR:FREShort
by lissnema83
Bayer stock : Contrarian storyBayer stock might be considered a contrarian investment: Legal overhang from Monsanto acquisition: The ongoing litigation related to the Roundup herbicide has created significant uncertainty and negatively impacted Bayer's stock price. A contrarian investor might see this as an overreaction and believe the company's long-term value will prevail. Undervalued compared to peers: Some analysts believe Bayer is undervalued compared to its competitors in the pharmaceutical and agricultural industrie
XETR:BAYNLong
by StockBlog
SAPSAP - Monthly from the beginning year 94 - Strong uptrend since '22. A few companies determine the performance of the German DAX. One of these "tanks" is SAP. The chart seems to be on its way to 310.80 EUR per share, a Fibonacci-Extension in green. This level represents the end of Cycle wave III in green. After that the chart should form in three waves a 23.6-% correction in total as a flat. In the chart you see the volume which is decreasing over a long time period. So the actually reached hig
XETR:SAPLong
by armandogui
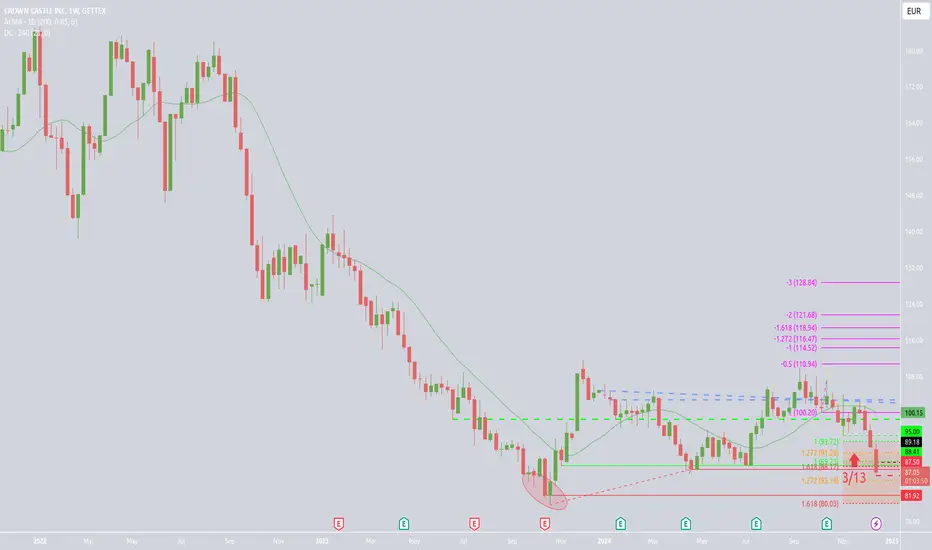
Broad BottomThe bottom seems to be a bit broader than I had expected previousely. So my stopploss had been to tight. When we see the weekly picture then we are still in region of the 2024 low that may still hold. If not then the bottom zone may be as broad as to the 2023 low at around 82.
GETTEX:8CWLong
by motleifaul
Updated
RHM is a few steaps ahead of TKARHM is already a couple steps ahead its little brother TKA, we have the same structural buildup with the only difference being that RHM already turned inside the correction zone and continued its way downward, activating the orange structure. GG to everyone who listened to my call & prediction last year.
XETR:RHMShort
by xSamu_TA
4
A bleeding week ahead?We finished the green structure, and might just be in the means to set up the orange structure. i see a nice shorting opportunity here to bring us down to the purple correction level, which is the point in the charts i plan on entering my long position for the coming months.
XETR:TKAShort
by xSamu_TA
4
DTE DT. TELEKOMDT. TELEKOM AG - 1h After eliminating its first serious retracement at 30,64 EUR, the chart shows a correction as expected. There is a chance of closing the gaps on downside mentioned in red before rallying again. Next retracement on the upper side will be at 44,82 EUR. If the chart forms higher highs again, I expect 54,68 EUR. The DAX will then reach 24500 points.
XETR:DTELong
by armandogui
Lufthansa AGLufthansa AG - weekly There is a chance of rallying prices after closing the former gaps on downside. W-X-Y pattern which intends a long lasting correction. Tha gaps are menioned in red.
XETR:LHA
by armandogui
Bayer AG Analysis: Growth Potential and Positive Buying SentimenThe history of Bayer AG shares goes through many key moments and events: Foundation and early years: Bayer was founded in 1863 by Friedrich Bayer and Johann Wagner in Germany. The company initially dealt with the production of chemicals and textile dyes. Development of aspirin: In 1897, Bayer synthesized aspirin, which became one of the most recognizable drugs in the world. This is considered one of the key moments that established the profile of the company. World War I: During World War I,
XETR:BAYNLong
by SimeonNikolaev-invest
Porsche is a hot topic for investors in 2025Porsche is a hot topic for investors in 2025, trading near historic lows. Barclays recently upgraded the stock to Overweight with a price target of €70, saying the current price could represent a good opportunity for long-term investors. Despite a 15% decline in the past month, earnings growth expectations for 2025 and 2026 remain above 10% per year, despite doubts about volume and margin targets. TRADINGVIEW INVESTING.COM Key risks include the company’s reliance on the U.S. and Chinese marke
GETTEX:PAH3Long
by SimeonNikolaev-invest
2
2.1.25 SGL carbon - 4.02 EUR: move up 15%Technical reason due of chart indicatora: - double bottom RSI - min. slow stochastic with extremal bollinger bands - OBV stabilized And I expect also, that a buyer will be find for part of carbon fibers, which brings losses. Overall, new CEO with good inhouse solution.
XETR:SGLLong
by Flyerdan
Updated
2.1.25 SGL carbon - 4.02 EUR: move up 15%Technical reason due of chart indicatora: - double bottom RSI - min. slow stochastic with extremal bollinger bands - OBV stabilized And I expect also, that a buyer will be find for part of carbon fibers, which brings losses. Overall, new CEO with good inhouse solution.
XETR:SGLLong
by Flyerdan
Impala platinum This one goes together with my previous post on PLATINUM . Same scenario , but miners always outperform the metals itself . Hitting the descending channel around Q2-Q3 . correction , and then a big move . Following the rise of platinum but better return . First target 12-15 . Retest 5-7 , on to 30-40 NFA
GETTEX:IPHBLong
by N-S-88
FRE a buy in 2025Not a buy yet but on my watchlist. Pattern of higher highs and higher lows with rising 200 day SMA seems favorable. However, stock is in consolidation for a few weeks and i would not wonder if it pulls back below 200 day SMA in the short-term.
XETR:FRE
by Viertagewoche
1
RENK Elliott-Wave AnalysisR3NK chart probaly formed the Wave(1) after IPO. Since the Top in Apr '24, we are stuck in a Downtrend. Im expecting the chart, to establish a bottom in this blue pricerange. If this support breaks, we could potentially fall much lower.
XETR:R3NK
by PF_Analysis
ALLIANZ ALV Divstock Maybe I get some at the marked area. I think about entering market at the marked area and later add more to my position when price crosses SMA(89) after broken out of the downward trend line. Feel free to like and comment.
GETTEX:ALVLong
by Amazing-Fractals
Updated
1
ELISA OYJ Reasonable priceI think that this is a reasonablke price for a good company. I m looking for entry reasons at the price right now. feel free o comment. greetings and peace!
TRADEGATE:EIALong
by Amazing-Fractals
Updated
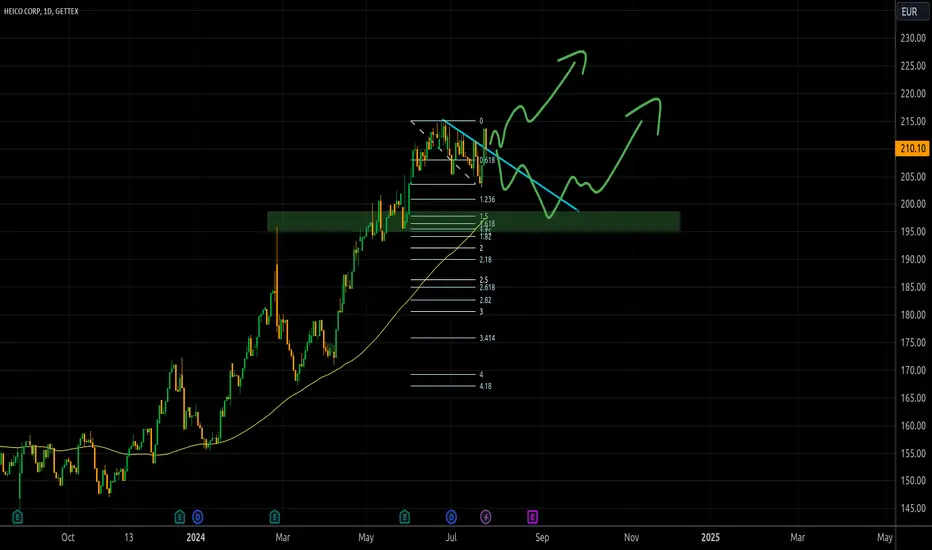
HEICO Buy IdeaPrice action looks promising. I may risk abuy when todays candle is broken to the upside. otherwise there is a nice zone as indicated in the chart where we can look for a continuation of the uptrend..
GETTEX:HC1Long
by Amazing-Fractals
Updated
WINGSTOP Buy IdeaThis seems to be a healthy stock with a good chart and i d like to use a little pull back for entry. today i placed a stop buy order above last 2 days high at 346,20. Trade not active yet. Some more downside possible from the way the chart looks. Leave a like or comment. Lets discusss.
ELong
by Amazing-Fractals
Updated
Cable One Inc. Stock Quote | Chart & Forecast SummaryKey Indicators On Trade Set Up In General 1. Push Set Up 2. Range Set up 3. Break & Retest Set Up Notes On Session # Cable One Inc - Double Formation * (Neckline) | At 350.00 EUR | Subdivision 1 * Retracement Entered At ((0.236)) & ((0)) - Triple Formation * ((Wedge Structure)) | Conditions Valid | Subdivision 2 * Retracement Numbered | Method 1| Subdivision 3 * Daily Time Frame | Trend Settings Active Sessions On Relevant Range & Elemented Probabilities; European Session(Upwards) - US-Sessi
GETTEX:XC1Long
by UnknownUnicorn87383881
NVIDIA: Higher Timeframe Bullish Construction in Play!NVIDIA is showing a bullish uptrend construction, with key levels highlighted on the weekly chart. The stock has dipped into the latest higher high level, finding support around $124. The recent range has retraced 16% from the top, reflecting a healthy pullback within an uptrend. If the $124 support level holds, there is potential for a higher timeframe bullish impulse targeting the $160 range, which aligns with the previous impulse that drove the stock to the $128 higher high. 📈 Trade Idea:
XETR:NVDLong
by Crypto21Official
ENR Elliott-Wave AnalysisSiemens Energy Skyrocketed over the course of 2024. I think the Chart finished the first full Elliott-Wave-Impulse (1-2-3-4-5). Now, im expecting the price to start retracing, and stay in the downtrend for at least a couple of months.
XETR:ENRShort
by PF_Analysis
1
Thyssen Krupp possible wave 4 in processIf the next low is higher than wave 1 or A, it means we have a probable wave 4 in process. Let's see if there is a reaccumulation. Even if this hypothesis fails, the stock is still cheap. The company is not making money, but why should we care about it? LOL. I like the stock. Germany is in the edge of a possible recession, so the economic cycle is not helping here. So, not many positive things, but that's why it's cheap now. If there wasn't any recession fears and the company would be
XETR:TKA
by NicolasRZ
123456789101112131415161718192021222324252627282930313233343536373839404142
…999

Made by humans

Select market data provided by ICE Data Services. Select reference data provided by FactSet. Copyright © 2026 FactSet Research Systems Inc.Copyright © 2026, American Bankers Association. CUSIP Database provided by FactSet Research Systems Inc. All rights reserved. SEC filings and other documents provided by Quartr.© 2026 TradingView, Inc.

SOC 2 CompliantGDPR Compliant
More than a product
  • Supercharts
Screeners
  • Stocks
  • ETFs
  • Bonds
  • Crypto coins
  • CEX pairs
  • DEX pairs
  • Pine
Heatmaps
  • Stocks
  • ETFs
  • Crypto coins
Calendars
  • Economic
  • Earnings
  • Dividends
  • IPOs
More products
  • News Flow
  • Portfolios
  • Fundamental Graphs
  • Yield Curves
  • Options
  • Macro Maps
  • Pine Script®
  • MCP Server
Apps
  • Mobile
  • Desktop
Community
  • Social network
  • Wall of Love
  • Refer a friend
  • Creator program
  • House Rules
  • Moderators
Ideas
  • Trading
  • Education
  • Editors' picks
Pine Script
  • Indicators & strategies
  • Wizards
  • Freelancers
  • Marketplace
Tools & subscriptions
  • Features
  • Pricing
  • Market data
  • Gift plans
Trading
  • Overview
  • Brokers
  • Brokers comparison
  • The Leap
Special offers
  • CME Group futures
  • Eurex futures
  • US stocks bundle
About company
  • Who we are
  • Space mission
  • Blog
  • Help Center
  • Careers
  • Media kit
Merch
  • Tarot cards for traders
  • The C63 TradeTime
Policies & security
  • Terms of Use
  • Disclaimer
  • Privacy Policy
  • Cookies Policy
  • Accessibility Statement
  • Trust Center
  • Security tips
  • Bug Bounty program
  • Status page
Business solutions
  • Widgets
  • Charting libraries
  • Lightweight Charts™
  • Advanced Charts
  • Trading Platform
Growth opportunities
  • Advertising
  • Brokerage integration
  • Partner program
  • Education program
Community
  • Social network
  • Wall of Love
  • Refer a friend
  • Creator program
  • House Rules
  • Moderators
Ideas
  • Trading
  • Education
  • Editors' picks
Pine Script
  • Indicators & strategies
  • Wizards
  • Freelancers
  • Marketplace
Business solutions
  • Widgets
  • Charting libraries
  • Lightweight Charts™
  • Advanced Charts
  • Trading Platform
Growth opportunities
  • Advertising
  • Brokerage integration
  • Partner program
  • Education program
Look FirstLook First