Long
Long
 Long
Long
 Short
Short
 Long
Long
 Long
Long
Buying DHER at 0.786 pullback.Delivery Hero - 30d expiry - We look to Buy at 31.66 (stop at 29.69)
We have a 78.6% Fibonacci pullback level of 31.00 from 23.88 to 57.16.
Levels below 32 continue to attract buyers.
The primary trend remains bearish. A higher correction is expected.
Support is located at 31 and should stem dips to this area.
Our profit targets will be 36.58 and 37.58
Resistance: 46.91 / 50.00 / 53.00
Support: 42.00 / 39.00 / 36.50
Disclaimer – Saxo Bank Group.
Please be reminded – you alone are responsible for your trading – both gains and losses. There is a very high degree of risk involved in trading. The technical analysis , like any and all indicators, strategies, columns, articles and other features accessible on/though this site (including those from Signal Centre) are for informational purposes only and should not be construed as investment advice by you. Such technical analysis are believed to be obtained from sources believed to be reliable, but not warrant their respective completeness or accuracy, or warrant any results from the use of the information. Your use of the technical analysis , as would also your use of any and all mentioned indicators, strategies, columns, articles and all other features, is entirely at your own risk and it is your sole responsibility to evaluate the accuracy, completeness and usefulness (including suitability) of the information. You should assess the risk of any trade with your financial adviser and make your own independent decision(s) regarding any tradable products which may be the subject matter of the technical analysis or any of the said indicators, strategies, columns, articles and all other features.
Please also be reminded that if despite the above, any of the said technical analysis (or any of the said indicators, strategies, columns, articles and other features accessible on/through this site) is found to be advisory or a recommendation; and not merely informational in nature, the same is in any event provided with the intention of being for general circulation and availability only. As such it is not intended to and does not form part of any offer or recommendation directed at you specifically, or have any regard to the investment objectives, financial situation or needs of yourself or any other specific person. Before committing to a trade or investment therefore, please seek advice from a financial or other professional adviser regarding the suitability of the product for you and (where available) read the relevant product offer/description documents, including the risk disclosures. If you do not wish to seek such financial advice, please still exercise your mind and consider carefully whether the product is suitable for you because you alone remain responsible for your trading – both gains and losses.
 Long
Long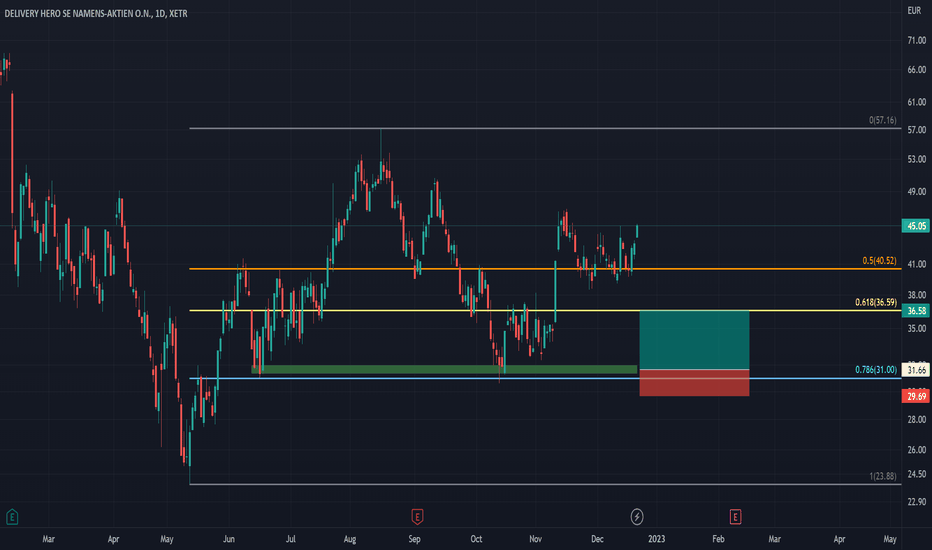
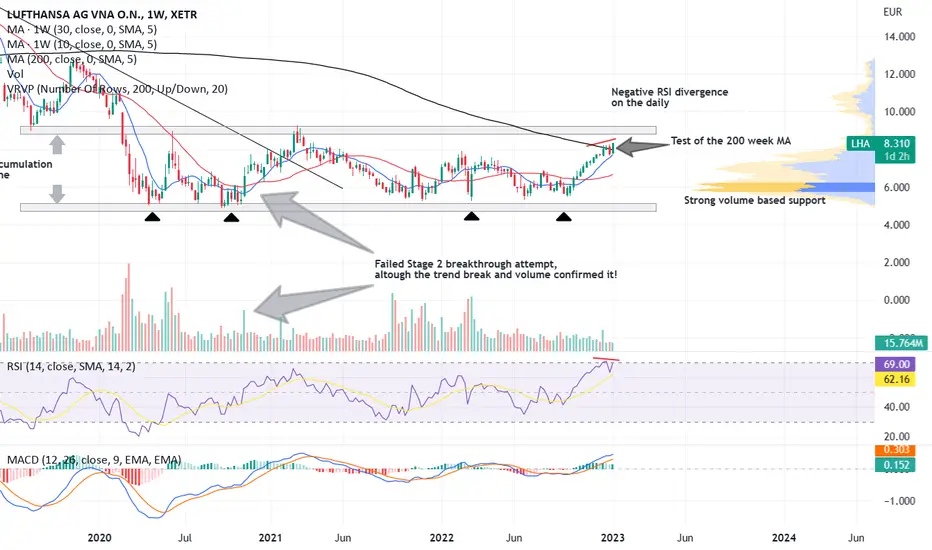
Lufthansa to stop flying?Lufthansa - 30d expiry - We look to Sell a break of 7.088 (stop at 7.422)
We are trading at overbought extremes.
Bearish divergence is expected to cap gains. The primary trend remains bearish.
Price action has posted a Doji candle and signals a possible reversal of the recent trend.
A higher correction is expected.
A break of the recent low at 7.127 should result in a further move lower.
Our profit targets will be 6.253 and 6.053
Resistance: 7.250 / 7.420 / 7.500
Support: 7.200 / 7.000 / 6.800
Disclaimer – Saxo Bank Group.
Please be reminded – you alone are responsible for your trading – both gains and losses. There is a very high degree of risk involved in trading. The technical analysis , like any and all indicators, strategies, columns, articles and other features accessible on/though this site (including those from Signal Centre) are for informational purposes only and should not be construed as investment advice by you. Such technical analysis are believed to be obtained from sources believed to be reliable, but not warrant their respective completeness or accuracy, or warrant any results from the use of the information. Your use of the technical analysis , as would also your use of any and all mentioned indicators, strategies, columns, articles and all other features, is entirely at your own risk and it is your sole responsibility to evaluate the accuracy, completeness and usefulness (including suitability) of the information. You should assess the risk of any trade with your financial adviser and make your own independent decision(s) regarding any tradable products which may be the subject matter of the technical analysis or any of the said indicators, strategies, columns, articles and all other features.
Please also be reminded that if despite the above, any of the said technical analysis (or any of the said indicators, strategies, columns, articles and other features accessible on/through this site) is found to be advisory or a recommendation; and not merely informational in nature, the same is in any event provided with the intention of being for general circulation and availability only. As such it is not intended to and does not form part of any offer or recommendation directed at you specifically, or have any regard to the investment objectives, financial situation or needs of yourself or any other specific person. Before committing to a trade or investment therefore, please seek advice from a financial or other professional adviser regarding the suitability of the product for you and (where available) read the relevant product offer/description documents, including the risk disclosures. If you do not wish to seek such financial advice, please still exercise your mind and consider carefully whether the product is suitable for you because you alone remain responsible for your trading – both gains and losses.  Short
Short
Bayer continues to hold back the bulls.Bayer AG - 30d expiry - We look to Sell at 54.48 (stop at 56.11)
Daily signals are bearish.
54.50 continues to hold back the bulls.
Bespoke resistance is located at 54.50.
Preferred trade is to sell into rallies.
The bearish engulfing candle on the daily chart is negative for sentiment.
Our profit targets will be 50.41 and 49.41
Resistance: 52.00 / 53.20 / 54.50
Support: 49.50 / 48.50 / 47.00
Disclaimer – Saxo Bank Group.
Please be reminded – you alone are responsible for your trading – both gains and losses. There is a very high degree of risk involved in trading. The technical analysis , like any and all indicators, strategies, columns, articles and other features accessible on/though this site (including those from Signal Centre) are for informational purposes only and should not be construed as investment advice by you. Such technical analysis are believed to be obtained from sources believed to be reliable, but not warrant their respective completeness or accuracy, or warrant any results from the use of the information. Your use of the technical analysis , as would also your use of any and all mentioned indicators, strategies, columns, articles and all other features, is entirely at your own risk and it is your sole responsibility to evaluate the accuracy, completeness and usefulness (including suitability) of the information. You should assess the risk of any trade with your financial adviser and make your own independent decision(s) regarding any tradable products which may be the subject matter of the technical analysis or any of the said indicators, strategies, columns, articles and all other features.
Please also be reminded that if despite the above, any of the said technical analysis (or any of the said indicators, strategies, columns, articles and other features accessible on/through this site) is found to be advisory or a recommendation; and not merely informational in nature, the same is in any event provided with the intention of being for general circulation and availability only. As such it is not intended to and does not form part of any offer or recommendation directed at you specifically, or have any regard to the investment objectives, financial situation or needs of yourself or any other specific person. Before committing to a trade or investment therefore, please seek advice from a financial or other professional adviser regarding the suitability of the product for you and (where available) read the relevant product offer/description documents, including the risk disclosures. If you do not wish to seek such financial advice, please still exercise your mind and consider carefully whether the product is suitable for you because you alone remain responsible for your trading – both gains and losses.  Short
Short
 Short
Short
 Short
Short
 Long
Long
 Short
Short
Will Volkswagen earnings satisfy?Volkswagen - 30d expiry- We look to Buy a break of 134.02 (stop at 127.96)
We are trading at oversold extremes.
This stock has seen good sales growth.
Posted a Double Bottom formation.
A break of the recent high at 133.46 should result in a further move higher.
The bias is to break to the upside.
Our profit targets will be 149.48 and 157.48
Resistance: 133 / 140 / 150
Support: 127 / 120 / 115
Disclaimer – Saxo Bank Group.
Please be reminded – you alone are responsible for your trading – both gains and losses. There is a very high degree of risk involved in trading. The technical analysis , like any and all indicators, strategies, columns, articles and other features accessible on/though this site (including those from Signal Centre) are for informational purposes only and should not be construed as investment advice by you. Such technical analysis are believed to be obtained from sources believed to be reliable, but not warrant their respective completeness or accuracy, or warrant any results from the use of the information. Your use of the technical analysis , as would also your use of any and all mentioned indicators, strategies, columns, articles and all other features, is entirely at your own risk and it is your sole responsibility to evaluate the accuracy, completeness and usefulness (including suitability) of the information. You should assess the risk of any trade with your financial adviser and make your own independent decision(s) regarding any tradable products which may be the subject matter of the technical analysis or any of the said indicators, strategies, columns, articles and all other features.
Please also be reminded that if despite the above, any of the said technical analysis (or any of the said indicators, strategies, columns, articles and other features accessible on/through this site) is found to be advisory or a recommendation; and not merely informational in nature, the same is in any event provided with the intention of being for general circulation and availability only. As such it is not intended to and does not form part of any offer or recommendation directed at you specifically, or have any regard to the investment objectives, financial situation or needs of yourself or any other specific person. Before committing to a trade or investment therefore, please seek advice from a financial or other professional adviser regarding the suitability of the product for you and (where available) read the relevant product offer/description documents, including the risk disclosures. If you do not wish to seek such financial advice, please still exercise your mind and consider carefully whether the product is suitable for you because you alone remain responsible for your trading – both gains and losses.  Long
Long
Long 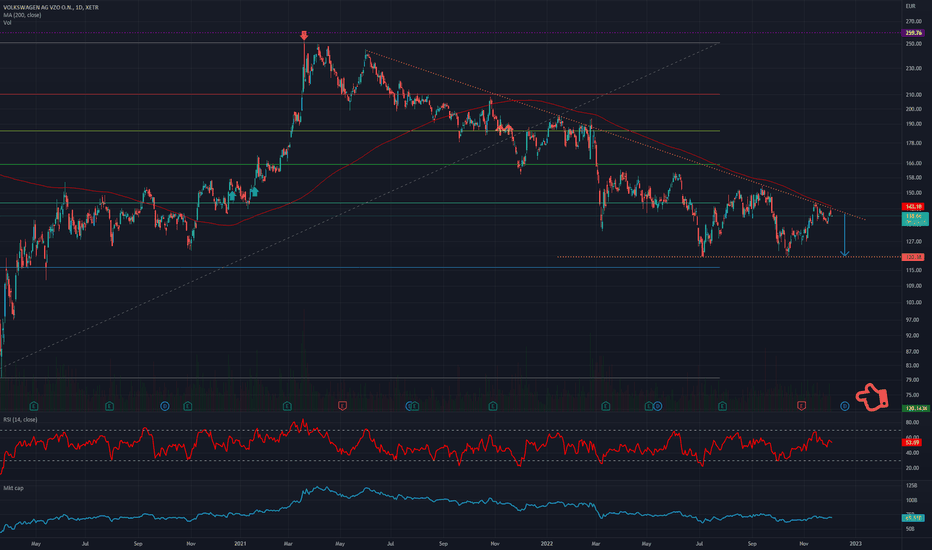
 Short
Short
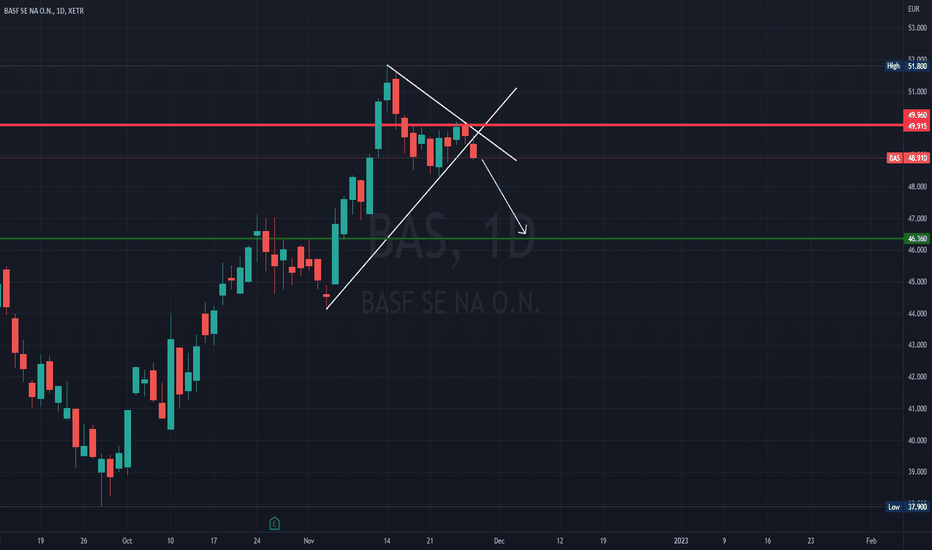
BASF N (BAS.de) bearish scenario:The technical figure Triangle can be found in the daily chart of the German company BASF SE (BAS.de). BASF SE is a German multinational chemical company and the largest chemical producer in the world. The BASF Group comprises subsidiaries and joint ventures in more than 80 countries and operates six integrated production sites and 390 other production sites in Europe, Asia, Australia, the Americas and Africa. BASF has customers in over 190 countries and supplies products to a wide variety of industries. The Triangle broke through the support line on 29/11/2022. If the price holds below this level, you can have a possible bearish price movement with a forecast for the next 6 days towards 46.36 EUR. Your stop-loss order, according to experts, should be placed at 49.96 EUR if you decide to enter this position.
German chemicals giant BASF said it would downsize permanently in Europe, kindling concerns that persistently high energy prices could lead to a deindustrialization of the continent.
The company will slash costs in Europe by 500 million euros, or $501 million, annually up to 2024, focusing on cost savings in non-production units in its operating, service and R&D divisions as well as in its corporate headquarters.
The company said that in the first nine months this year, gas costs at its European sites were about €2.2 billion higher than a year earlier.
Risk Disclosure: Trading Foreign Exchange (Forex) and Contracts of Difference (CFD's) carries a high level of risk. By registering and signing up, any client affirms their understanding of their own personal accountability for all transactions performed within their account and recognizes the risks associated with trading on such markets and on such sites. Furthermore, one understands that the company carries zero influence over transactions, markets, and trading signals, therefore, cannot be held liable nor guarantee any profits or losses. Short