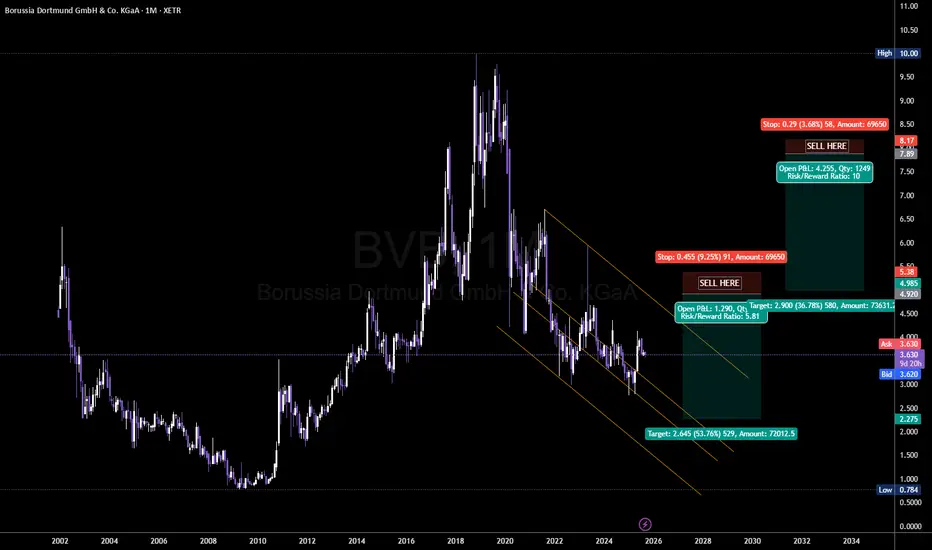
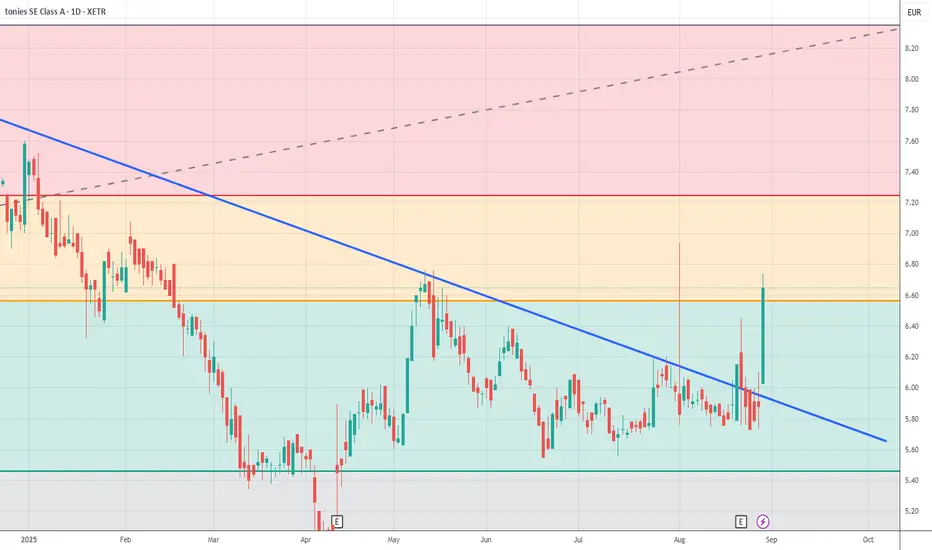
Turnaround 2025Not much to analyze yet as the stock doesn't show a lot of movement lately. I expect a major uptrend correlating with the release of the fiscalreport for the year 2024 and half year 2025 (expected this month). Revenue should be around 16-17m for last and around 26-27 for this year, making 2025 the first profitable year ever.
Chart patterns:
-crossed the triangle (marked by two major highs, 1st is the spike of the all time high)
At the moment hovering around the ATL and looking at the projected
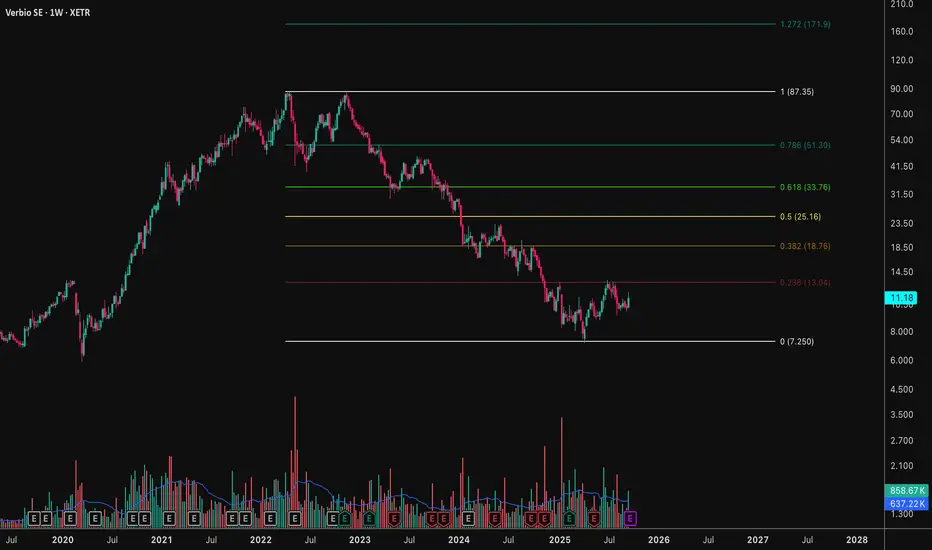
Verbio $VBK improving fundamentalsVerbio’s weekly chart shows a repaired base after a long decline. Price has been making higher lows and is pressing the range top near 13. A weekly close above 13 would confirm a breakout, opening room toward ~15–16 and then ~18.8. First supports sit around 10–10.5, with 7.8 as the key line to hold; a break below 7.25 would invalidate the base.
Fundamentals are turning more supportive. Biofuel and feedstock prices (UCO, tallow, RSO) have been firm for the last six months; the share price looks
NOW Servicenow Service Now - Long scenarioI bought Service Now here.
Building up a first position.
There is a scenario where
the two equal lows may be broke
first to reverse afterwards
but i am a medium to long time investor /
large seasonal swing trader maybe, so
I dont need too exact entries and
Servicenow is a Quality stock...
this is not a trade call, no financial advice. for educational purpose only....
I d be happy about a like/rocket or comment and a chat with you guys!
UNITEDHEALTH UNH Long Scenario based on Seasonality and FractalsFrom a fractals Perspective I expect a chance for around 30% gain from an upcoming upmove.
From a Seasonal Perspective I expect a retracement mode until End of Mid/September and then upside until early December.
I hope we make the bigger upmove in this time and complete that move otherwise this fractals target could take some time/moths/years.
Feel free to like / support the Idea, leave a comment or contact me in the chat.
Good luck to all
*this is not a trade call*
Cheers!
RHM ready for last push upIn my last post I thought 1800-1900 will be the top, but considering the pattern going on at the moment, a push to 2200-2300 is more than likely.
Don't forget, all these moves will at some point be given back. I think a dump to 500€ is possible afterwards.
My trade idea for now: buy at 1600 and aim for 2200 (40% possible gain)
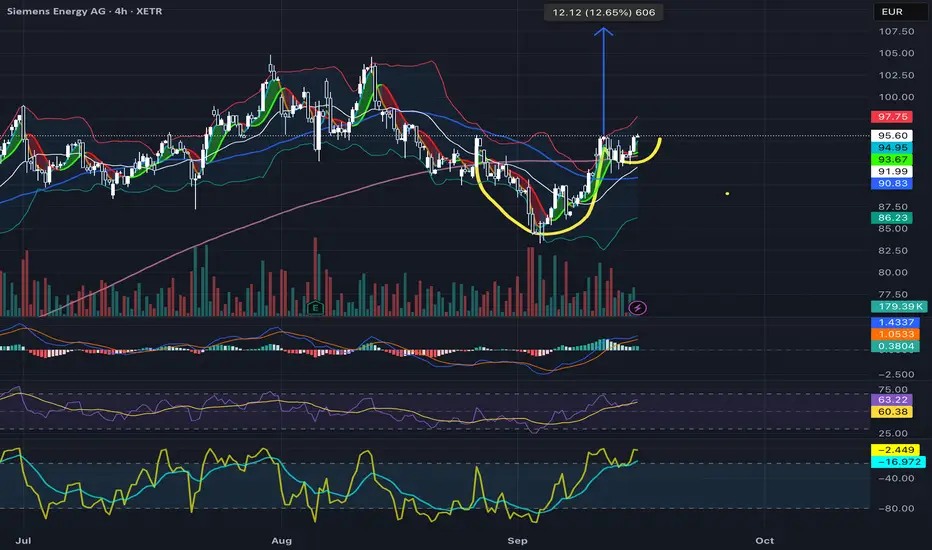
NVIDIA Testing Downtrend — Breakout Could Unlock UpsideNVIDIA has been trading in a corrective downtrend after its recent highs, with price compressing under the red trendline. If this downtrend breaks, a strong bullish move upward could follow, but key supports below remain critical if sellers extend pressure.
🔍 Technical Analysis
Current price: 143.04 EUR (XETR).
Price is consolidating under the downtrend line, keeping short-term bias cautious.
Immediate supports: 141.40 (short-term) and 139.44 (intraday).
A break of the red trendline would f
Cadeler’s Wind-Powered Surge - €2.5B Backlog to Fuel Growth Cadeler A/S (OB): Riding the Offshore Wind Wave
In a nutshell, what I see is a stock whose price declined by 33% from October 2024 to September 2025, despite the fact that the company is now in a much better position, with better ratios, much better revenue, and great value.
Company Overview
Cadeler A/S is a global leader in offshore wind farm installation and maintenance, primarily operating in European markets. Listed on Oslo Børs, the company operates a fleet of 4 jack-up vessels with 8
TOPPAN Holdings Inc. | Chart & Forecast SummaryKey Indicators On Trade Set Up In General
1. Push Set Up
2. Range Set Up
3. Break & Retest Set Up
Notes On Session
# TOPPAN Holdings Inc.
- Double Formation
* (A+)) - *Crossing - *25EMA - Short Entry | Subdivision 1
* Medium Range | No Size Up - *1.5RR | Completed Survey
* 143 bars, 4352d | Date Range Method - *Uptrend Argument))
- Triple Formation
* (P1)) / (P2)) & (P3)) | Subdivision 2
* Monthly Time Frame | Trend Settings Condition | Subdivision 3
- (Hypothesis On Entry Bias)) | Regular Set
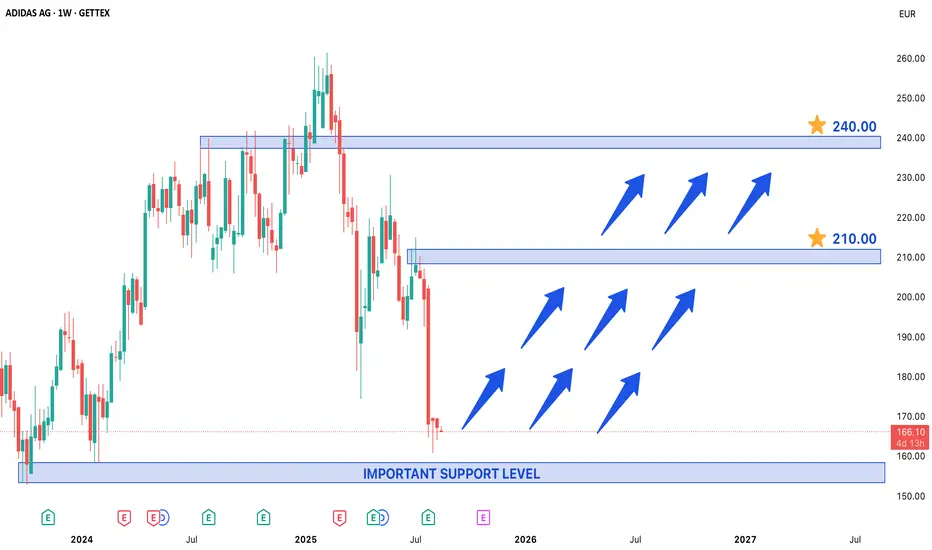
Adidas ADS Trading Near Important Support Level in Weekly ChartAdidas Stock Trading Near Important Support Level – A Potential Long-Term Entry Point
Adidas (ADS) stock is currently trading near a crucial support level, presenting a potential opportunity for long-term investors. Historically, this price level has acted as a strong base, with notable rejections observed in 2023 and 2024, indicating strong buying interest. Given the repeated bullish reactions from this zone, there is a high probability that the stock could resume its upward trajectory from h
Mattr Corp Stock Quote | Chart & Forecast SummaryKey Indicators On Trade Set Up In General
1. Push Set Up
2. Range Set Up
3. Break & Retest Set Up
Notes On Session
# Mattr Corp
- Double Formation
* (1st. Reference)) - *10EMA - Short Entry | Subdivision 1
* (Range Allocation)) | No Size Up - *1.5RR | Completed Survey
* 55 bars, 385d | Date Range Method - *Downtrend Argument))
- Triple Formation
* (P1)) / (P2)) & (P3)) | Subdivision 2
* Weekly Time Frame | Trend Settings Condition | Subdivision 3
- (Hypothesis On Entry Bias)) | Regular Setting
Adidas ADS Trading Near Important Support Level in Weekly ChartAdidas Stock Trading Near Important Support Level – A Potential Long-Term Entry Point
Adidas (ADS) stock is currently trading near a crucial support level, presenting a potential opportunity for long-term investors. Historically, this price level has acted as a strong base, with notable rejections observed in 2023 and 2024, indicating strong buying interest. Given the repeated bullish reactions from this zone, there is a high probability that the stock could resume its upward trajectory from h
MTN Group Limited | Chart & Forecast SummaryKey Indicators On Trade Set Up In General
1. Push Set Up
2. Range Set Up
3. Break & Retest Set Up
Notes On Session
# MTN Group Limited
- Double Formation
* (Diagonal Shift)) - (1st.)) & (2nd.)) - *50EMA - Long Entry | Subdivision 1
* (Medium Range)) | No Size Up - *1.5RR | Completed Survey
* 157 bars, 4780d | Date Range Method - *Downtrend Argument))
- Triple Formation
* (P1)) / (P2)) & (P3)) | Subdivision 2
* Monthly Time Frame | Trend Settings Condition | Subdivision 3
- (Hypothesis On Entry
Ermenegildo Zegna N.V. | Chart & Forecast SummaryKey Indicators On Trade Set Up In General
1. Push Set Up
2. Range Set Up
3. Break & Retest Set Up
Notes On Session
# Ermenegildo Zegna N.V.
- Double Formation
* Curved & Arrowed Support - *0.5 - Short Entry - *25EMA | Subdivision 1
* (1st. Take Profit)) - *1.5RR - *Downtrend Area | Completed Survey
* 89 bars, 623d | Date Range Method - *Downtrend Argument))
- Triple Formation
* (P1)) / (P2)) & (P3)) | Subdivision 2
* Weekly Time Frame | Trend Settings Condition | Subdivision 3
- (Hypothesis On
TESLA, pay attention to these numbers!!Despite the electric vehicle sector experiencing strong demand growth, with EV sales up 33.6% in July across the European market (source: Investing.com), Tesla appears to be struggling to keep up with the trend, posting a 40% drop in sales. In contrast, BYD continues to gain market share steadily.
Yet, Tesla is currently trading at a price that reflects an EPS multiple of 203.83x (with revenue growth expected to be -5.4% in 2025 and EPS falling by 12.1%) , an aggressive valuation that is diffic
SS&C Technologies Holdings, Inc. | Chart & Forecast SummaryKey Indicators On Trade Set Up In General
1. Push Set Up
2. Range Set Up
3. Break & Retest Set Up
Notes On Session
# SS&C Technologies Holdings, Inc
- Double Formation
* (A+)) - *Crossing - Long Entry - *5EMA | Subdivision 1
* (Ratio Editor)) | No Size Up - *Uptrend Area | Completed Survey
* 33 bars, 3014d | Date Range Method - *(Uptrend Argument))
- Triple Formation
* (P1)) / (P2)) & (P3)) | Subdivision 2
* 3 Monthly Time Frame | Trend Settings Condition | Subdivision 3
- (Hypothesis On Entry
ALLERGY THER. PLC | Chart & Forecast SummaryKey Indicators On Trade Set Up In General
1. Push Set Up
2. Range Set Up
3. Break & Retest Set Up
Notes On Session
# ALLERGY THER. PLC
- Double Formation
* (A+)) - *Crossing - Long Entry - *10EMA | Subdivision 1
* (Short Cut Attitude)) | No Size Up - *Consolidation Area | Completed Survey
* 24bars, 733d | Date Range Method - *(Uptrend Argument))
- Triple Formation
* (P1)) / (P2)) & (P3)) | Subdivision 2
* Monthly Time Frame | Trend Settings Condition | Subdivision 3
- (Hypothesis On Entry Bias