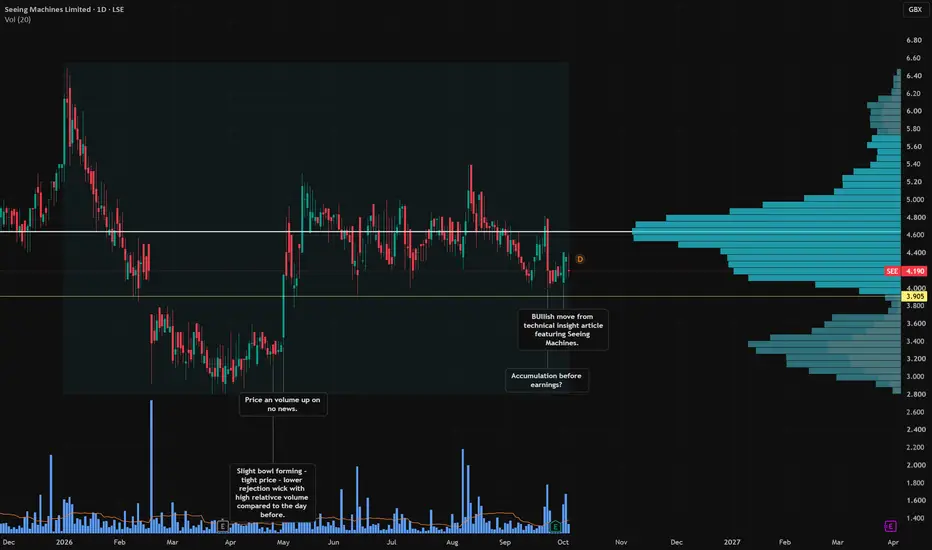
SEE shakeout or opportunity?Disclaimer: I hold. Seeing Machines put out an interesting announcement on Wednesday. Its convertible loan notes with Magna were due on 4 October, but they’ve only been extended to 30 November. Management says that buys time to negotiate a proper longer term deal. Not what investors were hoping for, and the 10% drop on the day said as much.
But look at the lower rejection wick, sitting right on previous support around 3.9p. Lots of volume traded, yet sellers couldn’t push the price any lower. T
Lloyds Banking Group — Sell Side | 91Lloyds Banking Group is developing a bearish setup on the London Stock Exchange, with the current market structure indicating scope for a further decline toward the 91 level.
Recent price behavior suggests that upward momentum is losing its influence, while selling activity is becoming more prominent around the current structure. The inability to sustain stronger advances can leave the stock exposed to another downward phase as sellers attempt to push price into lower territory.
The 91 area re
INF institutions are accumulating, but price disagreesPossible distribution taking place here over the last couple of months. There are some very large, wide candles, which can be a sign of market makers hunting for liquidity. Judging by the volume, they’re finding it between 876p and 920p. Last week’s long upper wick on heavy volume looks like an upthrust to me, a push higher that sellers slapped straight back down.
The candles are also forming lower highs, which could be a sign demand is drying up. The way I see it, the better prices have gone,
ANIC heavy volume at support, thin volume aboveThis is the second time ANIC has flashed up on my list. After what looked like a shakeout, the price has been consolidating. On Friday it broke out strongly, closing at the high of the day on roughly 2.5x its average volume.
It’s also worth noting how much volume is concentrated at this level (the white line). If buyers are steaming in here, this one could claw back some ground. Looking at the volume profile on the right, there’s very little in the way until around 6.5p, which is where I’d expe
KODAL BULL CASE
🚀 KOD Bull Case 🚀
The market is still focused on KOD's 20bn+ share count and historic seller overhang, but the fundamentals have changed.
✅ Bougouni has transitioned from development to lithium production.
✅ Kodal is now a revenue-generating company, not just a lithium explorer.
✅ Strong backing from strategic partner Hainan Mining reduces funding risk.
✅ Recently reported a £3.5m profit despite weak lithium prices.
✅ Any recovery in lithium prices could significantly improve earnings a
JD. rising volume ahead of results catches the eyeAnother similar pattern here, as JD Sports also breaks to a new short term low, closing on the low of the day on strong and increasing volume.
The price could continue to fall to the previous low of around 65p.
Support and resistance levels can be very subjective though, and the eagle eyed amongst you may argue the price is currently trading around an important turning point from back in May. Others may argue the low before that, around 65p, is the significant one.
Worth noting that earnings
EVOK engulfing candle confirms the weaknessBearish engulfing candle, which often indicates a very strong move from the sellers. The price has already turned down from its highs and it continues to make new lows.
Add in the uptick of volume and it gives another layer of confluence on the short term direction. In this case I feel there’s some weakness ahead and it could fall further yet.
CCR huge volume, but the rejection tells the storyMore possible price weakness ahead with C&C Group. A couple of points stand out.
The first is that the price is currently trading in a previous area of resistance which it sold off from before, although slightly lower at 106.6p versus 108.8p. That detail matters, because there is less supply at these higher prices.
Working with that for a moment, we’d assume there could still be sellers waiting to offload at this level, and I think that’s confirmed by the rejection to the upside, which duly re
BARC weak close on strong volume raises concernsTaking a simple view here, it doesn’t take much conviction to say the sellers are in control after the price rolled over through the last three months.
Then Friday delivered a very weak down candle which closed on the low of the day on very strong volume. With no clearly defined support level directly underneath it, this could show some price weakness for a while yet.
Some significant director dealings to take note off too:
7 Aug 2026: Anna Cross, Group Finance Director (CFO), sold 461,588 sh
SFR: distribution or just a pause at the highs?Initially I viewed this as a distribution event from the analysis that I set out below, but since the UK announced support for first time buyers and help to buy, I am wondering if this could support their sales? Maybe not, maybe there isn't that much steel that goes into homes, its mainly bricks and cement?
We could be seeing a very long period of distribution playing out with the steel fabricator Severfield. The price has essentially flatlined after a strong move from 28p to 38p. It’s now ver
NG.: pullback absorbed as buyers keep loading upThis looks like a classic case of stopping volume, and when you can time these right and manage the risk accordingly they’re often one of my most effective setups.
After around six months of price decline, it seems the price has reached a point where investors are happy to dip into their pockets again.
Wednesday was the key session last week. The price broke upwards, only by around 2.16% on the day, but the effort behind the move validates this as buyers stepping in and taking out the ASK pric
BTC market makers testing for supply above?The chart for BTG Consulting is making a nice bowl here, consolidating sideways which has turned into rising lows.
The breakout on Friday looked like an opportunistic move by the market makers to test the liquidity above the current price. The price then drifted back on the day, yet crucially the volume kept increasing. To me that combination looks like buyers mopping up the sell orders, with the market makers knowing supply above here is thin.
Lets see if it can squeeze back up to its highs.
GRG - UK food retail LongOriginally got stopped out but reattempting this.
Weekly chart
Holding a historical price level.
Price broke out of an accumulation range, and back testing the break out. Easier to see on daily chart. Is now entering a fast price action zone. Weekly close back above the level.
Similar to Wyckoff Back Up move.
Bullish Divergence on MACD daily.
2 Targets
Stick to stop loss
PRN fundamentals finally catching attentionPrinces hasn’t been listed very long and was clearly shunned by investors at the IPO, losing around £370m in value.
There are some positive comments around the stock at the minute. Revenue and profits are up and it’s sitting on an enormous cash pile. That alone has prompted me to look a little further and add it to the watch list, although the margins are fine, and I’m never a fan of that.
The chart is interesting too. It’s what the hardcore technical traders would call a double bottom, with t
KIE a fascinating VPA setup. I wanted to start with something a little different here, an illustration and a cracking example of VPA in action.
Normally when I see explosive moves like this I find it very hard to get involved, because you can get whipsawed out of a position very quickly. But it’s a great example of why Volume Price Analysis matters.
What we have is an anomaly in price versus volume over the last three trading sessions.
Wednesday16th: Price move 11.49% - Volume traded 6.34m
Thursday 17th: Price move 4.46
SVS sellers distributing into the recent run?Savills has been on a lovely run since summer. It’s a global real estate advisory business, transactions, valuations, capital markets, so earnings lean more on deal volumes than on steady rental income, worth bearing that in mind given how sensitive it’s been to transaction activity in the past.
Price action shows clear exhaustion as it’s approached a previous level, sellers distributing into the move. The last three sessions are the real story though, big volume three days running, yet price h
NIOX heavy 5.5× volume looks like distributionI often flag stocks that have run into previous resistance and start showing signs of rolling back over. NIOX fits that pattern, signs of distribution, a week or so of consolidation, and now price has broken down from that area.
Hard to ignore the volume on Tuesday last week, 5.5x the average, around £2.3m in value. That’s a big print for this one.
Could someone be distributing here? Looks that way to me.
MAB volume spike hints at holders unwindingMitchells & Butlers is showing a degree of weakness, and possibly forming the early part of a trading range.
I added this annotation on Wednesday last week, a down day for the stock. Price did attempt a push to the upside, only to get rejected. Volume spiked too, slightly above average, worth asking whether someone was selling into that rise.
Price looks a little weak here to me, and the fact it’s already rolled over suggests some holders are unwinding their positions.
KIST: Heavy volume above price looks like distributionFor those not too familiar with my annotations, an annotation placed above price action generally signals negative sentiment from me, while anything below tends to be bullish.
My first read here was negative. Price has approached a previous level with a large amount of volume behind it, and it’s looking exhausted, three upper wicks now rejecting around 330p.
But something about the tight price action here leaves me a little uncertain. Might be the series of higher lows, can’t quite put my fing
HUW insider buying adds weight to the setupStrong price move last weeks pulls this one even further out of this area of consolidation, in fact it was a a very minor area of contraction over the last couple of weeks. Worth zooming in and taking a closer look at those rising lows, a pattern I love seeing because it often results it prices breaking out.
Whilst the breakout volume here might seem small compared to the last 6 months, it is very slightly above the average, and I think the probability of this one continuing to its recent highs
Shell quick 18% to sell off back to 200 EMA and to 61.8 FibAs Oil is weak bearish case for Shell to sell back to its 200 EMA and then just fake out below this level to reach the 61.8 Fib retracement of the recent move up
Shell looks like it just broke is support trendline
Other points Oil has broken out of a wedge and appears to be moving lower
BP and Shell move together and BP has made ATH at round number 500 and made triple top at this level and has already broken lower.
If you pair trade these two stocks there is now a relative of up to say a p
25% sell Shell and buy BPBP and Shell move together and BP has already lead the way lower
If Shell moves back to relative parity there is a 25% poss move
Shell moves back to EMA 200
Shell moves back to 0.618 fib retracement of prior move
This could be start of much larger move lower
Most MSM are claiming inflation trade that oil will move higher but TA price chart shows breaking out of a wedge lower
Shell just broke it trendline support
Good luck no matter which way the market moves if these prices come back
JUP August volume picking up thanks to the buybackJupiter Fund Management next, lots of choppy sideways action here and not a name I follow closely, but the chart’s telling an interesting story.
What caught my eye is the volume picking up through August, unusual for what’s normally a quiet month. Some of that’s explained by the company’s own buyback, running since April and still active, weekly purchases have been going through at prices up to 164.4p. That gives the stock a steady bid underneath it, worth knowing when you’re reading the volume