Long
Long
 Long
Long
 Long
Long
 Long
Long
 Long
Long
 Short
Short
 Long
Long
Will Tesco shares plunge in May or June?Food retailers such as Tesco have traditionally been viewed as safe, defensive investments. They tend to attract beginner investors as well as those looking for stability, largely because demand for groceries remains relatively consistent regardless of economic or geopolitical turmoil. After all, food is a basic necessity, so revenues and profits in this sector have historically proven more resilient during periods of uncertainty.
However, that long-standing assumption may now be facing a serious challenge. Recent findings from the consumer group Which? suggest that pressure on UK supermarket chains is intensifying, raising concerns about whether these businesses can maintain their defensive reputation in the current climate.
In my view, Tesco’s share price could be at risk of a notable downturn. There are several warning signs that investors should not ignore.
What’s driving concern?
According to Which?, consumer sentiment in the UK was already weak even before the recent escalation in geopolitical tensions in the Middle East. Since then, confidence has deteriorated further. Their mid-April survey revealed that expectations for the UK economy dropped sharply to -62 — the lowest level recorded since the peak of the cost-of-living crisis.
The outlook among consumers is overwhelmingly pessimistic. Only 9% of respondents believe economic conditions will improve over the next year, while a striking 71% expect things to get worse. This kind of sentiment typically has direct consequences for spending behaviour, especially in retail.
Impact on shopping habits
The data shows that consumers are already adjusting how they shop and eat. More than two-thirds of UK adults reported making at least one change to their habits in the past month. These adjustments include:
Opting for cheaper alternatives (43%)
Switching to supermarket own-brand budget ranges (37%)
Taking advantage of promotional deals more frequently (31%)
More concerning still, financial strain is beginning to affect basic consumption. Around 15% of households said they had gone without certain food items, and one in ten reported skipping meals altogether. This signals a deeper level of economic stress that could significantly impact supermarket revenues.
What this means for Tesco
While Tesco may be better positioned than many competitors due to its scale, supplier relationships, and strong brand recognition, it is not immune to these pressures. Its size allows it to negotiate lower costs and offer competitive pricing, while its Clubcard loyalty programme gives it a valuable data advantage to target promotions effectively.
Even so, the challenges are mounting. With profit margins already thin — around 4.3% last year — Tesco has limited ability to offset rising costs by increasing prices. At the same time, increased consumer frugality could weigh heavily on sales volumes.
Another area of concern is Tesco’s non-food segment. General merchandise accounts for roughly 5% to 10% of its revenue. If consumers are cutting back on essential grocery spending, discretionary purchases in this category could see an even sharper decline.
Could the share price fall?
The broader geopolitical situation adds another layer of risk. If global tensions persist or escalate, the economic fallout could further weaken consumer spending power, intensifying pressure on supermarket earnings.
At the same time, Tesco’s valuation appears stretched. Its share price has risen around 30% over the past year, pushing its forward price-to-earnings ratio to approximately 18.9 — significantly above its historical average range of 12 to 13.
This suggests that a lot of optimism may already be priced in. If upcoming updates fail to meet expectations, the downside could be significant. Tesco’s next trading update, scheduled for 18 June, will be a key moment. Any disappointing figures or cautious guidance could trigger a sell-off.
Moreover, the shares could start to decline even before then if economic data continues to weaken or consumer confidence deteriorates further.
Bottom line
While Tesco remains a fundamentally strong business, the combination of worsening consumer sentiment, constrained margins, and elevated valuation creates a potentially fragile setup. Investors should be aware that even traditionally defensive stocks are not immune to sustained economic pressure — and in this case, the risk of a correction is becoming increasingly difficult to ignore.  Long
Long
 Short
Short
 Long
Long
Up 1,000% in 5 years,UK government could send Rolls-Royce higherOver the past five years, Rolls-Royce (LSE: RR) shares have delivered a remarkable return of exactly 1,000%, according to my data provider. There’s something almost poetic about that perfectly round figure. However, the FTSE 100 stock has lost some of its momentum recently, declining 18% since the beginning of March. This pullback can be attributed to several factors, including rising jet fuel costs, the cancellation of various flight routes, and cautious forward guidance from GE Aerospace, a key rival in the widebody engine market.
Annual general meeting on the horizon
Arguably, what the share price needs right now is a positive catalyst. Rolls-Royce is set to hold its annual general meeting (AGM) tomorrow (30 April), and it’s possible that the company will issue a trading update confirming whether its full-year guidance remains on track — or not. Following that, the next major catalyst is likely to be the half-year report, due in late July. Historically, the stock has seen significant movement after interim results, mostly to the upside in recent years.
As a reminder, the company has guided for full-year underlying operating profit of £4bn to £4.2bn, and free cash flow of £3.6bn to £3.8bn. Rolls-Royce has built a reputation for setting ambitious targets and then comfortably exceeding them. But that may be becoming more difficult given the current challenging environment, which includes restricted airspace and a rising number of cancelled flights.
SMRs represent a massive opportunity
Clearly, the near-term outlook is tricky, and that adds a layer of risk. Nevertheless, as a shareholder who is more focused on the next decade than on the next few months, I remain very bullish — particularly when it comes to small modular reactors (SMRs), or mini nuclear reactors as they’re sometimes called. If Rolls-Royce succeeds in becoming a global leader in this field, as it expects to, the opportunity could be enormous. Just how large are we talking? The International Energy Agency (IEA) projects that total SMR capacity could reach 120 gigawatts by 2050, with more than 1,000 SMRs deployed globally. Cumulative investment in this space could top $670 billion by 2050 under the IEA’s more bullish scenario. Even the base case is substantial, with SMR capacity reaching 40 GW. CEO Tufan Erginbilgic estimates as many as 400 SMRs could be in operation by 2050. Whichever forecast you prefer, this is clearly a high-growth market. Each unit is reportedly expected to cost between £2bn and £3bn, though it’s worth noting that the technology has yet to prove it can operate at scale.
Government support building
It was therefore encouraging to read last week that UK government officials have been travelling across Europe to drum up business for Rolls-Royce’s SMR technology. According to The Telegraph, Business Secretary Peter Kyle has been holding discussions with Sweden and other European allies. Rolls-Royce SMR has already signed contracts with the UK and the Czech Republic to build mini nuclear reactors. In doing so, it has become the only company with multiple contractual commitments to deliver SMR units in Europe. To be fair, Rolls is already a finalist in Sweden alongside GE Vernova to supply its SMR technology to state-owned energy giant Vattenfall. But there is now talk that Germany is also considering SMRs as a way to strengthen its energy independence, particularly in response to expected energy market disruptions in 2026. If Rolls-Royce SMR can secure orders from other major European nations — especially Germany — the share price could receive a meaningful boost.
A dip-buying opportunity?
Even after its 18% decline, the stock is far from cheap. The forward earnings multiple currently stands at 29. However, for investors who are willing to look beyond the near-term uncertainties and focus on the longer-term potential — particularly in the SMR space — I believe Rolls-Royce is well worth a closer look.
 Long
Long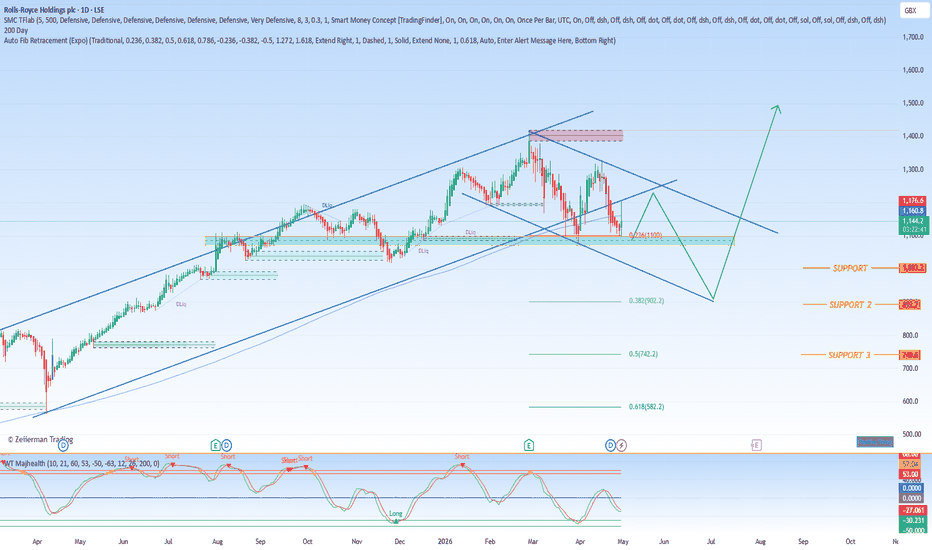
 Long
Long
 Short
Short
 Long
Long
 Long
Long
 Long
Long
 Long
Long
 Short
Short
 Long
Long
 Long
Long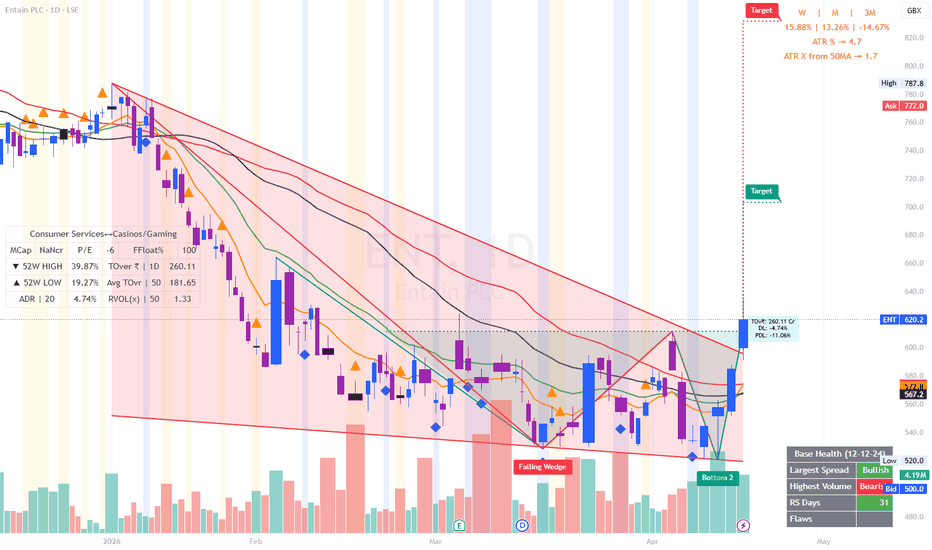
 Long
Long