UU. building above its 200-dayA price action above 1029 supports a bullish trend direction.
Negate the bullish bias for a break below 996 (stop-loss).
Increase long exposure for a break above 1069.
Upside target is at 1165 (upper range of the linear regression channel pattern.
When a stock is building a base just above its 200-day simple moving average, it can sugegst a potential bullish trend as the stock price is finding support at this level.
Aston Martin Formula 1Aston Martin Aramco Cognizant Formula 1 team is driving the stock, at its peak, it is up 61% from the AMR 23 Reveal, with the biggest price rise coming the morning after a magic podium for Fernando Alonso, and a stunning upset for Ferrari and Mercedes. The question is, will this happen again? in Jeddah, Melbourne, or later in the season?
long position on SMDSMy strtegy is based on price action with the reading of certain indicators that I like whilerespecting all the values that define the stock maket
SLong
RR. Short if 150+ not breachedThinking this is a great overbought trade here.
RSI 75 overbought conditions.
Massive gap too be filled around 115
Entered zone of previous sellers(resistance)
ideally for a long position it would fill this gap and then bounce again which coincides with the .38 fib that's present in that zone.
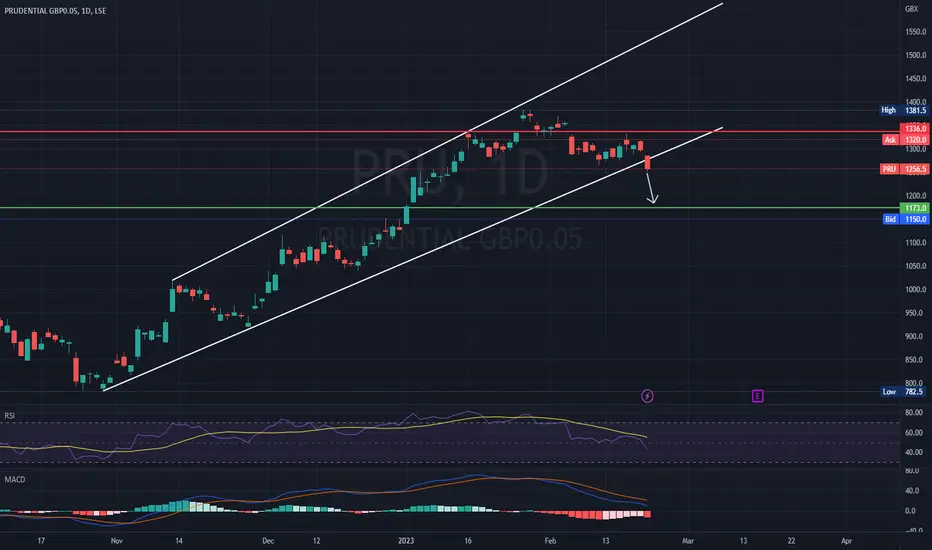
Prudential (PRU.l) bearish scenario:The technical figure Channel Up can be found in the daily chart in the UK company Prudential plc (PRU.l). Prudential plc is a British multinational insurance company. It was founded in London in May 1848 to provide loans to professional and working people. The Channel UP broke through the support line on 22/02/2023. If the price holds below this level, you can have a possible bearish price movement with a forecast for the next 25 days towards 1 173.20 GBX. According to experts, your stop-loss or
Bidstack long Bullish divergence on the RSI
ema's look like flattening out/turning upwards
Morning star candlestick at the alltime low
Increase in volume generally since start of January
Big gap to fill above
BLong
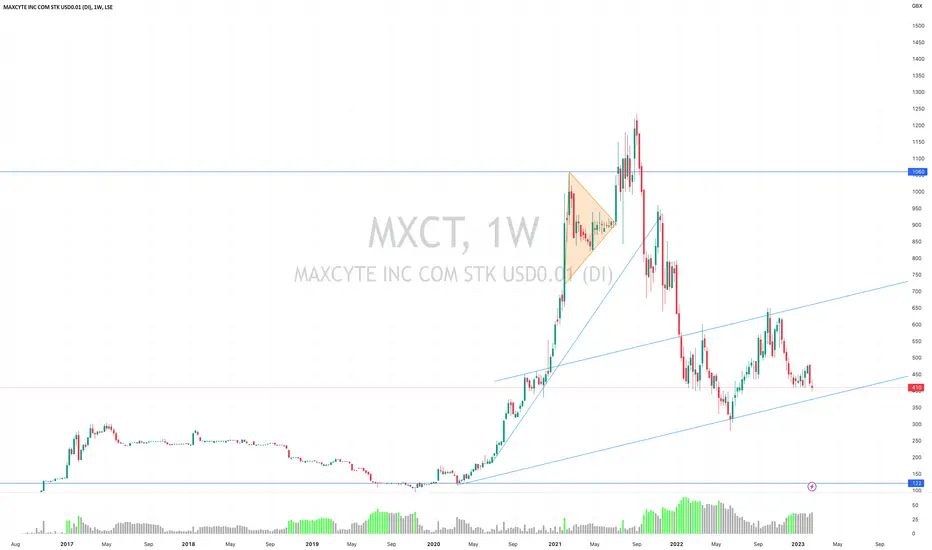
MXCT WAIT FOR BACKTESTMXCT - no advice given
looks to me like a successful backtest makes for a reasonable opportunity
behaving nicely
MLong
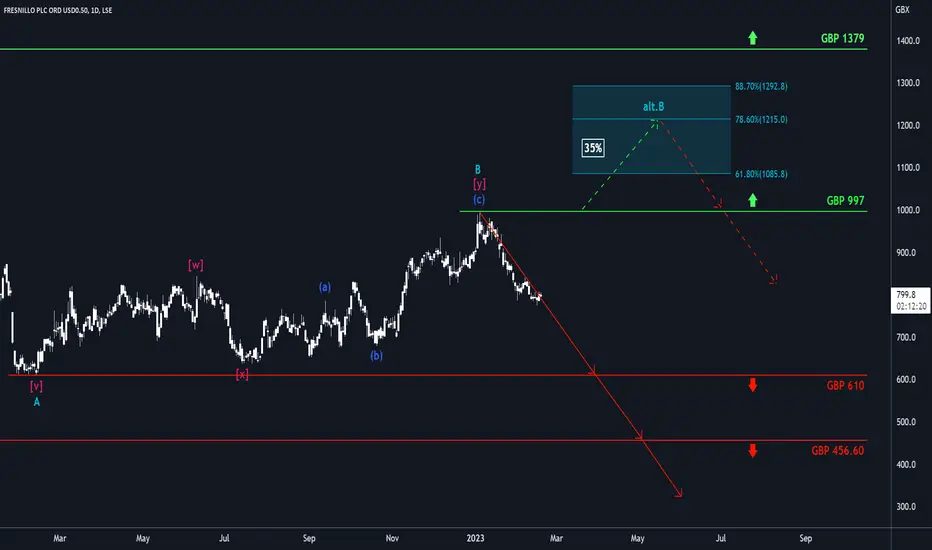
Fresnillo: Getting Down for Business 👇Since the end of wave B in turquoise, Fresnillo has been continually getting down for business. And the share should keep going as we expect it to march below both the supports at GBP 610 and at GBP 456.60. There is a 35% chance, though, that the course could turn upwards and climb above the resistance at GBP 997 instead. In that case, Fresnillo should enter the turquoise zone between GBP 1085.80 and GBP 1292.80 to develop a new high in the form of wave alt.B in turquoise before moving southward
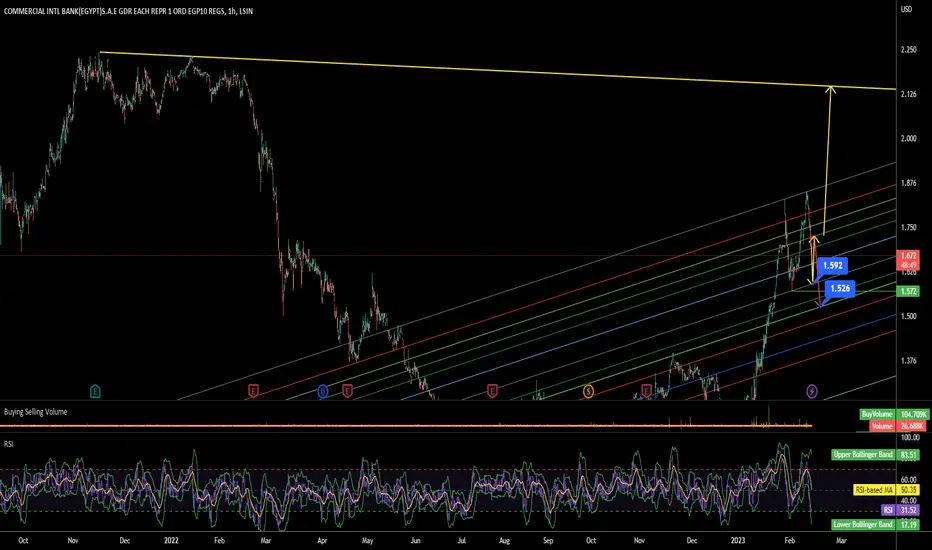
COMI London CBKDDear Friends,
Correction so far as long as its above 1.592 1.52
even if its going for the Bearish scenario, there is a trade up 1st to Form B >> Expect around 50 - .618% fib
So i am Bullish on Buying for a trade between 1.63 - 1.592 and will watch for the price action there for a confirmation.
On the Chart Fib Channel.
and Price points.
Good luck
ASHTEAD ,,, Pullback Uptrend
It was a very technical pullback to broken level and there is a good bullish candle as a trigger above the price level. set a sure SL for it and enter.
ALong