Defensive Dividend Stock Interest rates are coming down, the rate cutting cycle has started in the EU and the UK. Time to look at the best defensive stocks out there.
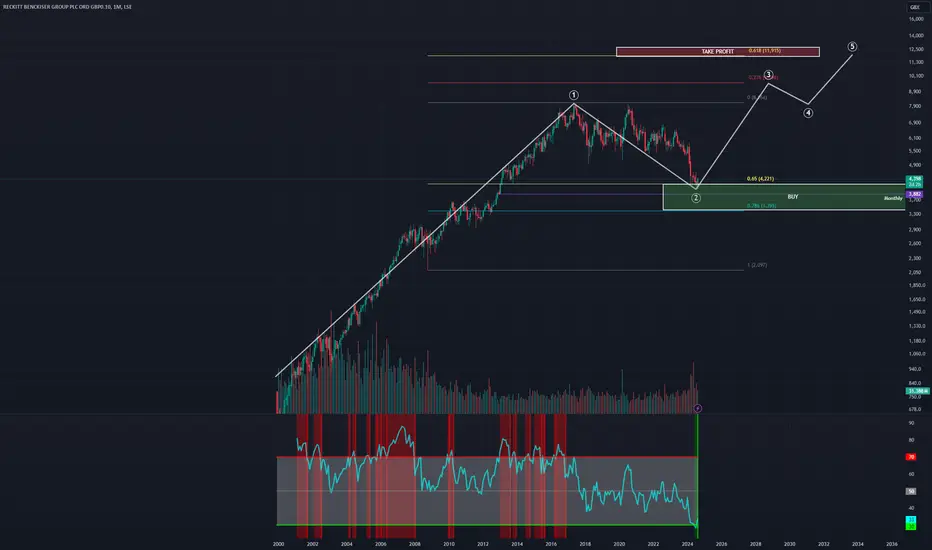
Reckitt Benckiser is close to the top of my list for the following reasons:
1. High divident yield - 4.51%. This will soon be higher than having money parked in a savings account.
2. Low market volatility and recently oversold on the monthly RSI. This suggests a new upcycle could well be on it's way.
3. Economic Moat - strong brand ownership of essen
Will Rolls Royce print 60% correction to 180p?Since the long idea (linked below) price action has melted up 600% in only 21 months. Astonishing. A plethora of long ideas are now published, including on this platform.
The Motley Fool, July 11th - recommended buy
“Rolls-Royce’s share price looks very undervalued to me, with strong business growth prospects, and an investment-grade rating adding to the firm’s allure.”
People actually pay money for this rag. This analysis from WW is free.
Businessinsider, June 26th - According to TipRanks,
Ubisoft Entertainment SA / UBIUbisoft Entertainment aka ubi "bug" is a french video game publisher headquartered in Saint-Mandé with development studios across the world. Its video game franchises include Assassin's Creed, Far Cry, For Honor, Just Dance, Prince of Persia, Rabbids, Rayman, Tom Clancy's, and Watch Dogs. Ubisoft was one early investors in web3 technologies and projects too
last year was a terrible year for ubi because not only they didn't succeed with their franchise like farcry 6 but also they entered the bear
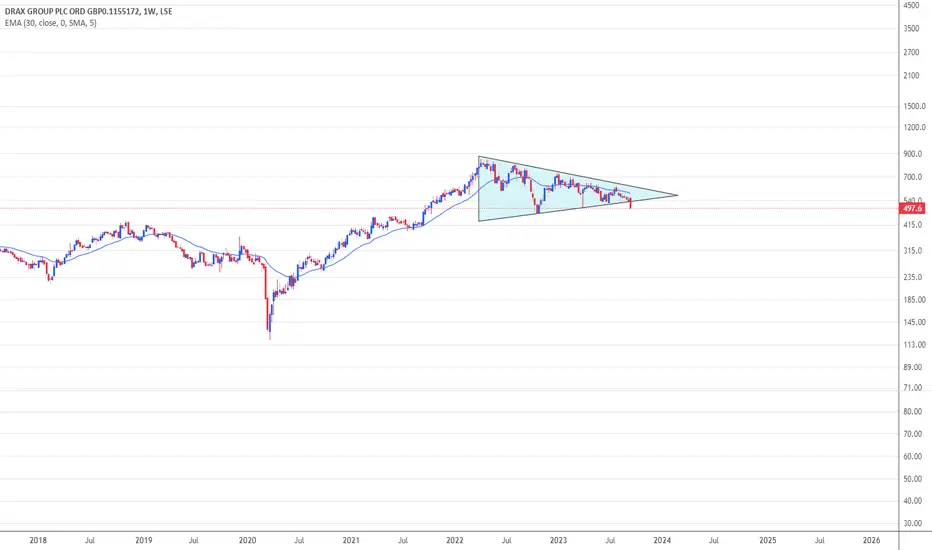
Sainsbury £200 to £300 playStock should be trading around £300 / + 150% in 18 months. Not a bad trade for investors looking to play it safe in the face of an 'alleged recession' being in the post. The stock has been trading inside this descending triangle for years and just confirmed support on the bottom.
The monthly chart below confirms the bullish divergence.
Small inverse H&S in many stocksThis is just for St James's Place, but you'll find inverse head and shoulder patterns in a lot of stocks on the FTSE 100. For me, that means a reversal on the pullback, and this week for example, STJ is confirming the reversal with a break about the neckline and 200 EMA acting as support.
Burberry may turn around soon? EW sequenceBurberry (ticker: BRBY) reaching ~14 years lows, where the risk /reward ratio for the mid/long term starting to be favourable. I have two scenarios sketched out on the weekly, white being a 5 wave up, in which we finished 3, followed by a yet unfinished irregular flat structure as a wave 4. Yellow suggests a 3 count move up as an (A) wave, working now on the (B) wave, and later (likely several years) a (C) would follow in 5 subwaves.
In yellow I would primarly expect a deeper cut in the (B) wa
ROLLS-ROYCE HOLDINGS PLC*safe investment opportunity - low risk*
Each candle on the above chart represents 6-months of price action. You can be sure not many people are studying this time frame.
A new candle was printed at the close of 2020 following an astonishing 80% correction since mid-2014. We can see previous price action resistance from dot.com bubble is now winning strong support during the ‘everything bubble’ resulting in the printing of a Dragonfly DOJI candle. Cleary buyers were keen to get exposure to t
Centrica - bullish divergence*investment opportunity*
A 90% correction since 2014 and following oversold condition there now exists an excellent opportunity to buy this stock.
The 10-day chart above confirms a regular bullish divergence between price action and the oscillators + higher low in price action. This is the start of a trend reversal. Price action is now in the bullish half of the Bollinger band as the mouth is constricting, which suggests a big move is coming.
On the fundamentals Centrica engages in the provi
Fiskar - Asc Tri in Norway showing potential upside if bullish Bullish case
- Index shows relative strength and has broken out of its own Asc Tri still not reached target
- Asc triangle should break up supporting its parent index
- Over performance target to revisit the ATH
- Triangle targets coincide with previous key price action gap that needs closing
NG - Multi year Asc Tri - will it close the gap and pop 30%? If bullish - prior triangle broken down, ends up touching BAGL for limit order fill
Still have prior leverage from prior Asc Tri aggressive limit order filled on BAGL
Decided not to close out on stop as gapped lower - nurse maiding the trade
Bullish case is to hold on and see if the gap fills setting sell order inside top of gap
Then to re- acquire if the price goes back for another BAGL touch
Disclaimer - purely for fun, and interest only. But I will give a huge smile if it works out!
This
Foxtons - further upside on bid talkIn Feb 23 Foxtons made ranged instead of breaking out. It then took 10 month to head upwards. It tested its 30 day moving average in April and now more news of a sale process has led to today's increase of 6-10% in one day.
Resistance hit during Feb 2020 was 97 and this could be hit again.
Do your own research and trading and this is not a solicitation to trade or hold.
Risk On ! US Stock Market Sell SignalThose who have been paying attention this week
have recognized that the S+P 500 has violated it's Ascending Triangle
Technical Pattern, on the Daily Chart
with the market leading semiconductor stocks leading the selloff.
I had warned you about this in my last post, if Nasdaq 100 Futures were to break 20000.
When the market's strongest stocks start to finally give way, there's high risk on the horizon.
"Sentiment" Observations, also show a marked warning message.
1. Market Vane's Bullis
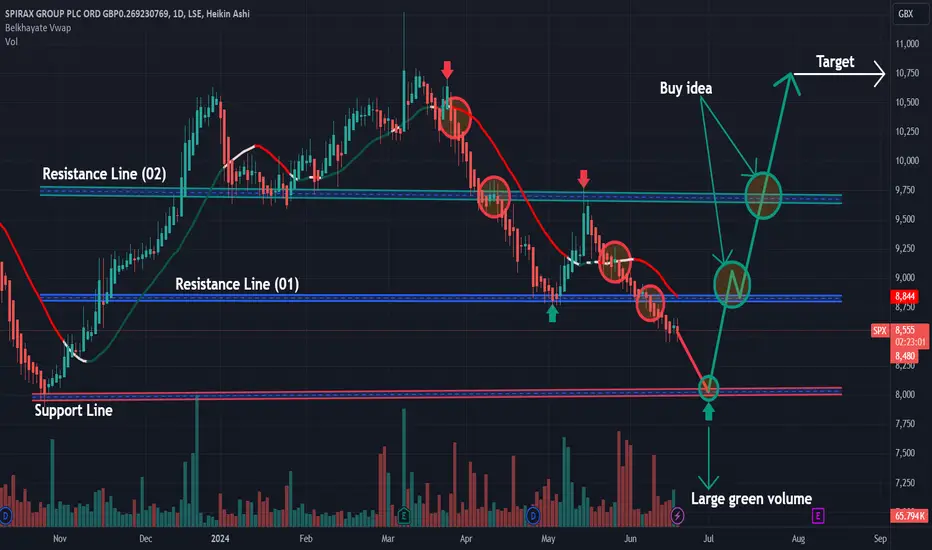
SPX: Buy ideaOn SPX we would have a high probability of seeing the market go up as shown in the chart if and only if resistance (01) and resistance (02) and in addition to the vwap indicator are broken forcefully by a large green candle and followed by a large green volume. All of these conditions must be met before this happens.
WISE | Arrived To The Potential Reversal Area!Hi,
A lot of criteria match inside the possible reversal box and it stays between 616-716:
1) The trendline. If this week closes deeper than the previous week then it is a bit weaker and the setup becomes also weaker. So, quite an important week for Wise.
2. Different types of Fib levels.
3. Channel projection
4. Equal pullback waves from the top
5. 700 as the most important prize zone within two years.
Do your homework and if it matching with mine then you are ready to go.
Good luck,
Vaido
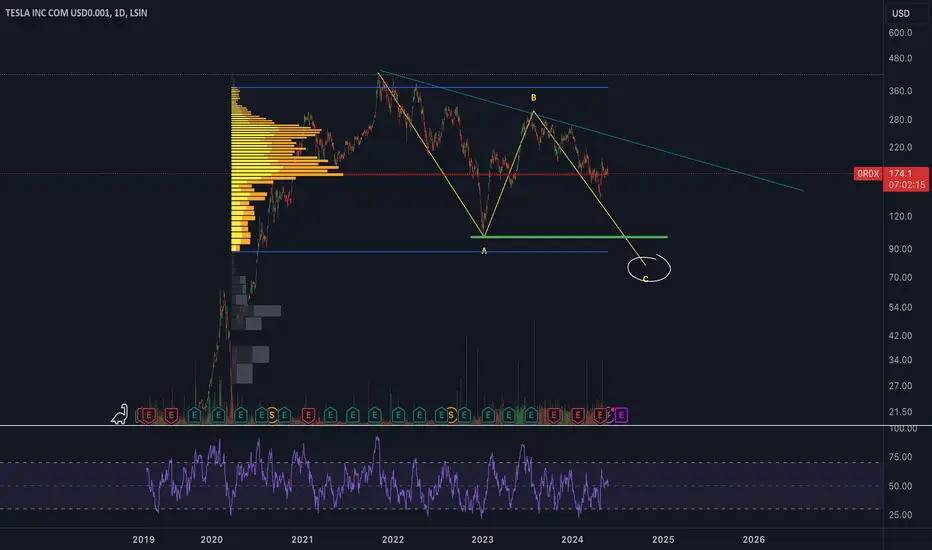
TESLAMy opinion tesla in some corection here which might be wave 4 on htf. i would be looking for the previous lows liquidity. otherwise we could hold thies level we are at right now and break the trendline to go upside
0
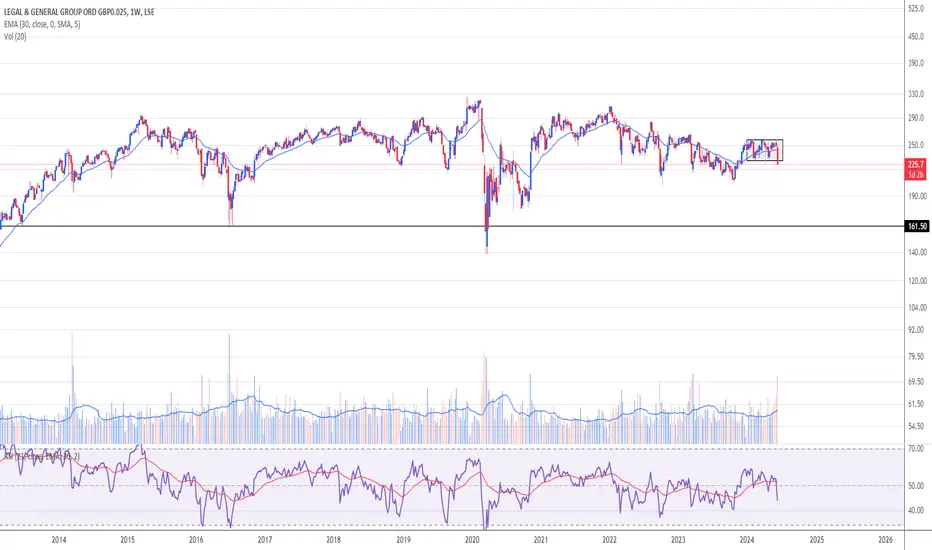
Legal & General new directionAfter creating a rectangle since Jan 2024, Legal and General has broken to the downside after lacklustre targets issued yesterday. Price is falling below 231 support.
Since March 2013, L&G has gone nowhere and it looks like it could eventually hit 161, if the stock market reverts to a downtrend or business is below expectations.
The RR tea leaves confirm take-off from gate 435 The RR tea leaves confirm take-off from gate 435 with a cup with a handle printed and an initial target suggesting a potential up-target move of some 9-10% i.e. onward flight path upwards into the 470's zone. Meanwhile, the cup with handle also unfolded on the SP500 after breaking out of the clouds on the daily time frames on May 10 and its trading range above 5250 and is now heading north towards high 5's 5555 - IMOO DYOR GLA