Long
Long
 Short
Short
 Long
Long
 Short
Short
BYLOT, EVOKE: White smoke expected on FridayBYLOT, EVOKE: White smoke expected on Friday, BYLOT waits, Evoke is already moving in London
The Evoke case for Bally’s Intralot appears to be entering the final stretch, with information from institutional circles in London indicating that the two sides are close to an agreement. Market attention has now turned to the official announcements, as the same sources say the deal could be completed by Friday, at a price above 50 pence per share.
According to the information so far, the transaction is expected to be structured mainly as a share exchange, with a partial cash alternative. This model limits the immediate cash burden and, at the same time, gives Evoke shareholders participation in the new entity. For Bally’s Intralot, this element is particularly important, as it protects its capital structure and allows the group to pursue a major asset without excessive financing risk.
Evoke is not a minor player. Its portfolio includes strong brands such as William Hill, 888casino and Mr Green. Its acquisition would give Bally’s Intralot immediate access to greater scale, a stronger presence in online gaming and a broader European footprint. In a market where size, technology and geographic diversification determine valuations, this move could become a repositioning point for the group.
Robeson Reeves, CEO of Bally’s Intralot, has already set the tone for management, describing the potential acquisition as a once-in-a-lifetime opportunity. He said that a combined group could generate revenue of more than €3 billion, while, if synergies are delivered, EBITDA could exceed €1 billion. This statement raises the bar and shows that management does not view Evoke as a simple acquisition, but as a transformational move.
The key issue lies in the synergies. Bally’s Intralot believes that the operating model it applies to its international online activities, with EBITDA margins above 40%, can also be transferred to Evoke. If this is confirmed in practice, the agreement could significantly strengthen profitability, improve efficiency and create one of the strongest players in the European gaming and digital entertainment industry.
At the same time, Evoke offers Bally’s Intralot greater diversification. Its presence in markets such as the United Kingdom, Spain and Romania could gain new strategic value, especially at a time when companies in the sector are seeking scale, better cost structures and more stable revenue sources. Geographic spread, once viewed by the market with caution, could now develop into an advantage.
The development could also have a positive impact on Intracom, which is closely watched by the market because of its exposure to Bally’s Intralot. If the agreement closes on favorable terms and leads to a higher valuation for the new structure, then the capital gains on Intracom’s holdings could increase. This could strengthen its net asset position and improve the image of its portfolio.
The stance of Bally’s Intralot CEO Robeson Reeves is also of particular interest. He appears positive toward new acquisitions, provided they create value and do not place excessive pressure on the group’s capital structure. According to market information, the Greek market is also being examined for a possible strategic move, a development that has already raised the temperature on the board. Investors are trying to identify what the next deal could be, with specific scenarios circulating strongly in stock market circles and giving fresh interest to shares linked to gaming, technology and holdings.
On the board, BYLOT’s picture points to an accumulation phase, with the stock moving in a narrow range and the market waiting for the “white smoke” that could trigger the next upward move. This stance shows that investors are closely monitoring developments, while the positive expectation has not been lost so far. On the other side, Evoke has already reacted upward to the information that the long-awaited deal could close above 50 pence per share, with the stock reaching levels above 40 pence in yesterday’s session. This reaction shows that the market is pricing in higher chances of an agreement, and possibly on terms better than those initially reflected in valuations.  Long
Long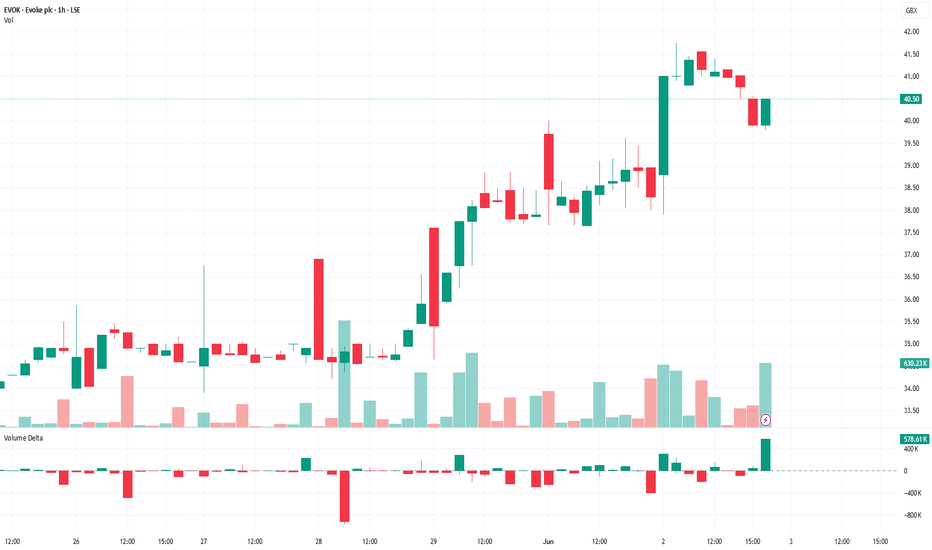
 Long
Long
 Long
Long
 Short
Short
Wise plc at a Critical Support ZoneNASDAQ:WISE plc at a Critical Support Zone
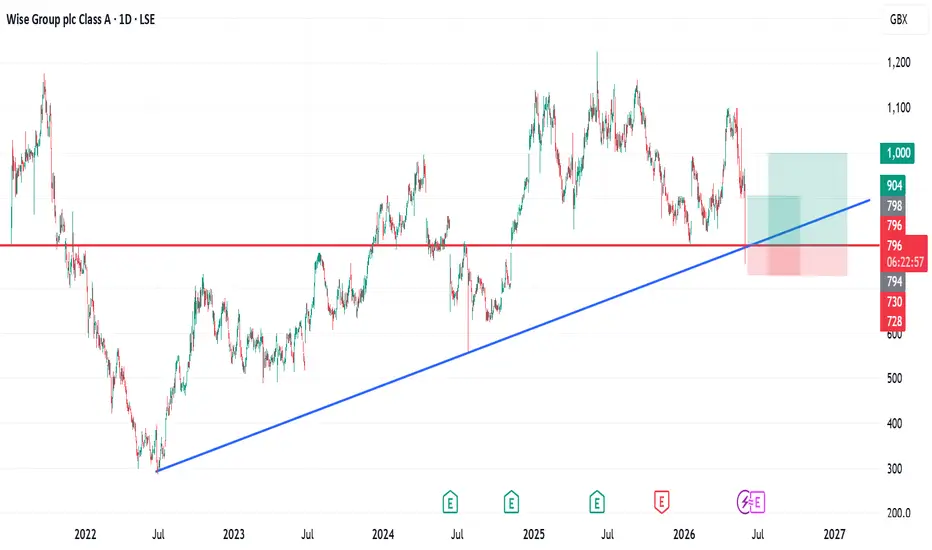
Following the sharp flash drop seen this morning, Wise plc briefly traded down toward the 754 zone before showing signs of recovery. From a technical perspective, this area appears highly significant.
Looking at the broader structure, the stock is now trading close to its historical listing region, which could psychologically act as a strong support area for long-term participants. In addition, an ascending trendline from previous major lows appears to converge around the same zone, creating a notable technical confluence.
This places the stock at what could be considered a decisive level for both swing traders and long-term investors.
Key Technical Levels
1. Stop-loss region: Around 730
2. First upside target: 900
3. Second upside target: 1000
Market Outlook
If buyers successfully defend this support region and momentum continues to recover, the stock could attempt a move back toward the 900 area in the medium term. A sustained bullish recovery above that level may open the door toward the psychological 1000 zone.
However, if the current support (confluence) fails decisively, it could invalidate the current bullish setup and potentially expose the stock to deeper downside pressure.
From a mid- to long-term technical perspective, this setup may attract investors looking for value around historically important price levels, particularly given the combination of:
historical listing-price support,
trendline confluence,
and recovery momentum after an aggressive selloff.
At this stage, price action around this support region will likely determine the next major directional move.
What’s your view on Wise plc here?  Long
Long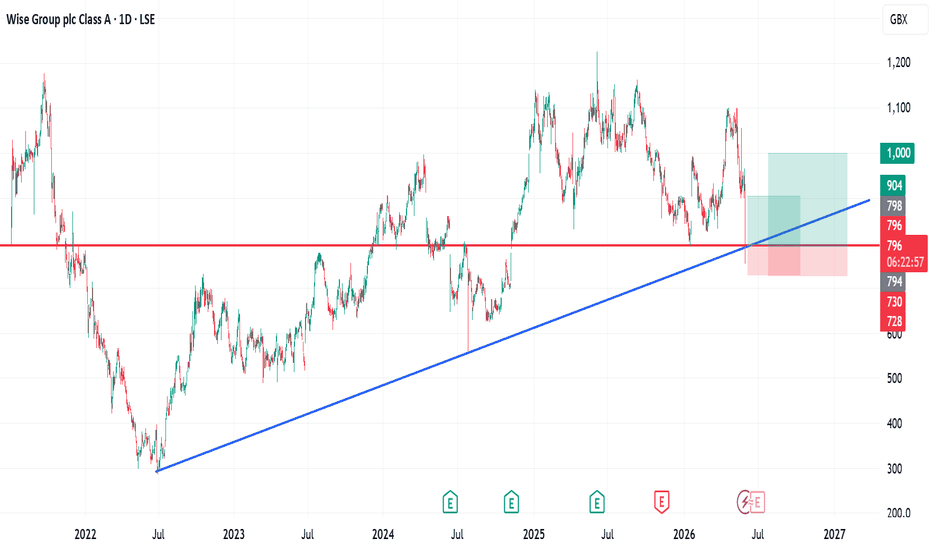
 Long
Long
 Long
Long
$RR Cash Revival Puts Culture And Portfolio In The Spotlightolls-Royce’s transformation into a cash-generating business has brought both its corporate culture and portfolio strategy into sharp focus. Rolls-Royce Holdings (LSE:RR) is currently in the midst of a major internal overhaul led by CEO Tufan Erginbilgic, which emphasizes tighter operational controls, cultural change, and selective asset disposals.
Once characterized as a cash burner, the company has now repositioned itself as a reliable cash generator, with improvements in employee engagement and a heightened sense of urgency cited as critical drivers of this shift. This turnaround has drawn considerable attention from investors, who are now looking beyond short-term share price movements to assess the long-term durability of the business reset.
Best known for its civil aerospace and defence engines, Rolls-Royce is deeply embedded in long-term global trends related to travel, security, and energy systems. The latest phase of restructuring under Erginbilgic differs from previous efforts because it relies heavily on internal discipline, cultural transformation, and portfolio streamlining—rather than simply cutting headline costs. For investors, this places business fundamentals and the mechanics of cash generation at the heart of the story surrounding LSE:RR.
Looking ahead, the central questions are how far this renewed emphasis on returns, workplace culture, and divestments can drive the business, and how resilient these changes will prove across different industry cycles. The remainder of this article examines what is shifting inside Rolls-Royce, how the company is reshaping its portfolio, and what this could mean for long-term growth prospects and the overall risk profile.
⚖️ Price vs Analyst Target: At £12.61, Rolls-Royce is currently trading approximately 10.7% below the analyst price target of £14.13.
❌ Simply Wall St Valuation: The shares are trading 36.9% above the estimated fair value, which signals potential overvaluation.
✅ Recent Momentum: The stock has risen by 11.7% over the past 30 days, indicating strong short-term investor interest in the transformation narrative.
Key Considerations
📊 The transition from cash burner to strong cash generator—underpinned by cultural change and asset sales—places internal execution at the very core of the investment case.
📊 Investors should keep a close watch on cash flow, the pace of divestments, and whether future revenue and earnings align with current expectations, which are already reflected in the £12.61 share price and a price-to-earnings ratio of 17.8x.
⚠️ Forecast earnings are expected to decline by an average of 3.1% per year over the next three years, a trend that could test the true durability of this revival.
 Long
Long
 Long
Long
 Short
Short
 Long
Long
 Long
Long
 Long
Long
 Long
Long
 Long
Long
Toncoin intraday bounce setup as social momentum buildsCurrent Price: 0.01
Direction: LONG
Confidence level: 58%(Strong bullish X sentiment with 201 tweets and large imbalance toward bullish posts, but limited professional trader analysis and mixed technical signals reduce conviction.)
Targets
Target 1: 0.0102
Target 2: 0.0103
Stop Levels
Stop 1: 0.0098
Stop 2: 0.0096
Wisdom of Professional Traders:
This analysis synthesizes insights from thousands of professional traders and market experts, combining what traders are saying across social sentiment and broader market intelligence. When large groups of traders lean the same way, it often highlights where momentum trades can appear during today’s session. In the case of Toncoin, trader chatter across social channels shows strong interest in altcoins connected to the Telegram ecosystem, and TON frequently appears in those trade lists.
Key Insights:
Here's what's driving this today. Toncoin keeps showing up repeatedly in large signal‑style posts and altcoin watchlists circulating on X. Across roughly two hundred trading‑related posts, the overwhelming tone leans bullish. Many traders are grouping TON with trending assets like NEAR, INJ, and JUP in momentum baskets, which usually signals short‑term rotation trades rather than long‑term positioning.
At the same time, broader technical indicators from market data show momentum signals like MACD and stochastic indicators leaning upward. Even though recent headlines mentioned selling pressure earlier, the bigger technical structure still shows TON sitting above important longer‑term moving averages. For intraday traders, that kind of backdrop often supports small bounce trades during today's session.
Another thing worth noting is the sentiment imbalance. Social monitoring shows more than 120 bullish signals versus only a handful of bearish mentions. When sentiment skews this strongly in the short term, it can create brief upside squeezes as traders pile into the same narrative.
Recent Performance:
Toncoin has experienced volatility recently, including a notable decline reported in recent market summaries. Despite that drop, the asset remains structurally supported by longer‑term moving averages. During today’s trading environment, TON is hovering around the $0.01 level, which is acting as a psychological round‑number support. Intraday traders often watch these levels closely for bounce opportunities.
Expert Analysis:
When I look at the collective trader commentary, the key pattern is momentum rotation into altcoins that are already trending on social platforms. TON consistently appears in those lists. Several professional traders are watching for continuation moves when sentiment momentum accelerates, especially when the asset holds above recent support.
Meanwhile, technical signals from broader market analytics show conflicting indicators but with several momentum indicators flashing buy signals. That combination—momentum indicators improving while price consolidates—often leads to short intraday push attempts. Because of this, the setup favors a small upside trade rather than betting on another drop today.
News Impact:
Recent headlines mentioning selling pressure created caution earlier in the market, but the news hasn't triggered widespread panic selling. Instead, traders appear to be treating the dip as a potential trading opportunity. For today's session, the lack of new negative catalysts means sentiment and momentum flows are likely to drive price more than fundamentals.
Trading Recommendation:
Here's my take for today’s session. I favor a LONG position on Toncoin around the $0.01 level, targeting a small intraday momentum move toward $0.0102 and $0.0103. Social sentiment strongly supports the upside narrative, and momentum indicators suggest buyers may attempt a short squeeze during the session. Risk management matters here because volatility is elevated. I would protect the position with stops at $0.0098 and $0.0096 in case sellers regain control. Position sizing should stay moderate due to the limited professional trader commentary backing the move.
 Long
Long
 Long
Long
 Long
Long
 Long
Long