$RR Cash Revival Puts Culture And Portfolio In The Spotlightolls-Royce’s transformation into a cash-generating business has brought both its corporate culture and portfolio strategy into sharp focus. Rolls-Royce Holdings (LSE:RR) is currently in the midst of a major internal overhaul led by CEO Tufan Erginbilgic, which emphasizes tighter operational controls, cultural change, and selective asset disposals.
Once characterized as a cash burner, the company has now repositioned itself as a reliable cash generator, with improvements in employee engagement and a heightened sense of urgency cited as critical drivers of this shift. This turnaround has drawn considerable attention from investors, who are now looking beyond short-term share price movements to assess the long-term durability of the business reset.
Best known for its civil aerospace and defence engines, Rolls-Royce is deeply embedded in long-term global trends related to travel, security, and energy systems. The latest phase of restructuring under Erginbilgic differs from previous efforts because it relies heavily on internal discipline, cultural transformation, and portfolio streamlining—rather than simply cutting headline costs. For investors, this places business fundamentals and the mechanics of cash generation at the heart of the story surrounding LSE:RR.
Looking ahead, the central questions are how far this renewed emphasis on returns, workplace culture, and divestments can drive the business, and how resilient these changes will prove across different industry cycles. The remainder of this article examines what is shifting inside Rolls-Royce, how the company is reshaping its portfolio, and what this could mean for long-term growth prospects and the overall risk profile.
⚖️ Price vs Analyst Target: At £12.61, Rolls-Royce is currently trading approximately 10.7% below the analyst price target of £14.13.
❌ Simply Wall St Valuation: The shares are trading 36.9% above the estimated fair value, which signals potential overvaluation.
✅ Recent Momentum: The stock has risen by 11.7% over the past 30 days, indicating strong short-term investor interest in the transformation narrative.
Key Considerations
📊 The transition from cash burner to strong cash generator—underpinned by cultural change and asset sales—places internal execution at the very core of the investment case.
📊 Investors should keep a close watch on cash flow, the pace of divestments, and whether future revenue and earnings align with current expectations, which are already reflected in the £12.61 share price and a price-to-earnings ratio of 17.8x.
⚠️ Forecast earnings are expected to decline by an average of 3.1% per year over the next three years, a trend that could test the true durability of this revival.
SSPG did you spot the accumulation at the structural base?A solid base is forming here at a major long term structural level, a zone the price originally broke out from back in December last year.
Zooming into recent price action, we have seen a couple of massive spikes in volume where the price was firmly rejected on the downside. The second spike carved out a slightly higher low. This is a classic Wyckoff indicator showing that floating supply is steadily reducing as the strong hands absorb what is left.
The volume profile reveals an interesting setup. There is a distinct lack of volume traded above the current price between 164p and 175p.
With an empty profile overhead, the price could break into this vacuum quite quickly once the remaining supply is cleared. The path of least resistance looks heavily skewed to the upside, and I certainly wouldn't rule out a swift retest of the recent highs. It is a highly compelling one to watch.
Price target: 200p
Potential reward: 21%
PSON is this historic resistance enough to reject the price herePrice has approached a key historic resistance level. Zooming out for context, the price retraced sharply from this exact zone in June last year. That doesn’t guarantee a repeat performance, but we must watch the recent price action carefully for clues.
The volume on Monday was significant, a major effort from the buyers. Since then, the price has remained tight and relatively high, showing compression just under the ceiling.
Is this distribution or absorption before a major breakout? A break below the open of Monday’s high-volume candle is the clear line in the sand that could see this fall back down the range. For anyone holding a long term position, it is worth asking the question: have the fundamentals genuinely changed since it last sold off from this level?
4 year inverted head & shoulders $STX TP1: $12
Shield Therapeutics is a commercial-stage biotech focused on ACCRUFeR®, an oral iron deficiency treatment used for:
- Iron deficiency anemia
- Women’s health
- Chronic kidney disease patients
- Gastrointestinal-sensitive patients
- Long-term iron replacement therapy
The company is essentially a high-growth specialty pharma play built around scaling ACCRUFeR adoption globally.
Key advantages:
- FDA-approved commercial product already on market
- Strong prescription growth momentum
- Oral alternative to IV iron treatments
- Expanding international regulatory approvals
- Potential long-term recurring prescription growth
Revenue comes primarily from ACCRUFeR prescriptions and commercialization partnerships.
Financials are improving rapidly:
- 2025 revenue grew 54% YoY to ~$50M
- Q1 2026 revenue grew to $18M
- ACCRUFeR revenue grew 54% YoY in Q1
- Net losses narrowed significantly
- Positive EBIT achieved in Q1 2026
Recent momentum:
- Record prescription growth in 2025
- FDA exclusivity extension granted
- China regulatory submission accepted
- EMA approval expanded into adolescent patients
- Analysts expect potential profitability in 2027
ESNT 86p breakout on 2x volume a structural shift in sentiment.Another well-formed base being tested with the potential for a reversal.
Zooming out to April, we see an impressive amount of volume coming in, yet the price barely budged to the downside. An immediate volume and price anomaly. Sellers were throwing stock at the market, but the strong hands were sitting there absorbing every single share.
Since then, the price has tracked sideways in tight compression. The 86p level was clearly where the remaining sellers were sitting.
That ceiling shattered on Wednesday with a very strong bullish engulfing candle on twice the average volume. Effort and result are in total alignment, validating a structural change in sentiment. We have seen a slight pullback on very low volume since, which looks like a normal test of the breakout level. It is a prime one to watch over the coming week.
As a plastics and oil-fed products manufacturer, macro input costs matter here. Trump has recently hinted at the Strait being opened again. I wouldn’t place too much emphasis on his word, but a drop in oil would act as an excellent catalyst for this margin-sensitive share price. The 86p mark is our clear line in the sand.
Price target: 108p
Potential reward: 24%
RM will the 103p to 109p vacuum trigger a pure momentum trade?Sentiment looks like it has slowly turned a corner. Thursday delivered the real kicker when the price punched above key resistance on impressive volume. That is raw effort showing an immediate, bullish result as buyers effortlessly absorbed the market sell orders.
Friday afternoon’s close right at the daily high confirms demand remains in total control.
Looking at the volume profile on the right hand side, we have cleared the thickest zone of institutional accumulation. There is a thin pocket of weak resistance between 103p and 109p. If the buyers push through that vacuum, it could become a pure momentum trade. The previous downtrend line is now a clear line in the sand for support.
Price target: 117p
Potential reward: 13.5%
Toncoin intraday bounce setup as social momentum buildsCurrent Price: 0.01
Direction: LONG
Confidence level: 58%(Strong bullish X sentiment with 201 tweets and large imbalance toward bullish posts, but limited professional trader analysis and mixed technical signals reduce conviction.)
Targets
Target 1: 0.0102
Target 2: 0.0103
Stop Levels
Stop 1: 0.0098
Stop 2: 0.0096
Wisdom of Professional Traders:
This analysis synthesizes insights from thousands of professional traders and market experts, combining what traders are saying across social sentiment and broader market intelligence. When large groups of traders lean the same way, it often highlights where momentum trades can appear during today’s session. In the case of Toncoin, trader chatter across social channels shows strong interest in altcoins connected to the Telegram ecosystem, and TON frequently appears in those trade lists.
Key Insights:
Here's what's driving this today. Toncoin keeps showing up repeatedly in large signal‑style posts and altcoin watchlists circulating on X. Across roughly two hundred trading‑related posts, the overwhelming tone leans bullish. Many traders are grouping TON with trending assets like NEAR, INJ, and JUP in momentum baskets, which usually signals short‑term rotation trades rather than long‑term positioning.
At the same time, broader technical indicators from market data show momentum signals like MACD and stochastic indicators leaning upward. Even though recent headlines mentioned selling pressure earlier, the bigger technical structure still shows TON sitting above important longer‑term moving averages. For intraday traders, that kind of backdrop often supports small bounce trades during today's session.
Another thing worth noting is the sentiment imbalance. Social monitoring shows more than 120 bullish signals versus only a handful of bearish mentions. When sentiment skews this strongly in the short term, it can create brief upside squeezes as traders pile into the same narrative.
Recent Performance:
Toncoin has experienced volatility recently, including a notable decline reported in recent market summaries. Despite that drop, the asset remains structurally supported by longer‑term moving averages. During today’s trading environment, TON is hovering around the $0.01 level, which is acting as a psychological round‑number support. Intraday traders often watch these levels closely for bounce opportunities.
Expert Analysis:
When I look at the collective trader commentary, the key pattern is momentum rotation into altcoins that are already trending on social platforms. TON consistently appears in those lists. Several professional traders are watching for continuation moves when sentiment momentum accelerates, especially when the asset holds above recent support.
Meanwhile, technical signals from broader market analytics show conflicting indicators but with several momentum indicators flashing buy signals. That combination—momentum indicators improving while price consolidates—often leads to short intraday push attempts. Because of this, the setup favors a small upside trade rather than betting on another drop today.
News Impact:
Recent headlines mentioning selling pressure created caution earlier in the market, but the news hasn't triggered widespread panic selling. Instead, traders appear to be treating the dip as a potential trading opportunity. For today's session, the lack of new negative catalysts means sentiment and momentum flows are likely to drive price more than fundamentals.
Trading Recommendation:
Here's my take for today’s session. I favor a LONG position on Toncoin around the $0.01 level, targeting a small intraday momentum move toward $0.0102 and $0.0103. Social sentiment strongly supports the upside narrative, and momentum indicators suggest buyers may attempt a short squeeze during the session. Risk management matters here because volatility is elevated. I would protect the position with stops at $0.0098 and $0.0096 in case sellers regain control. Position sizing should stay moderate due to the limited professional trader commentary backing the move.
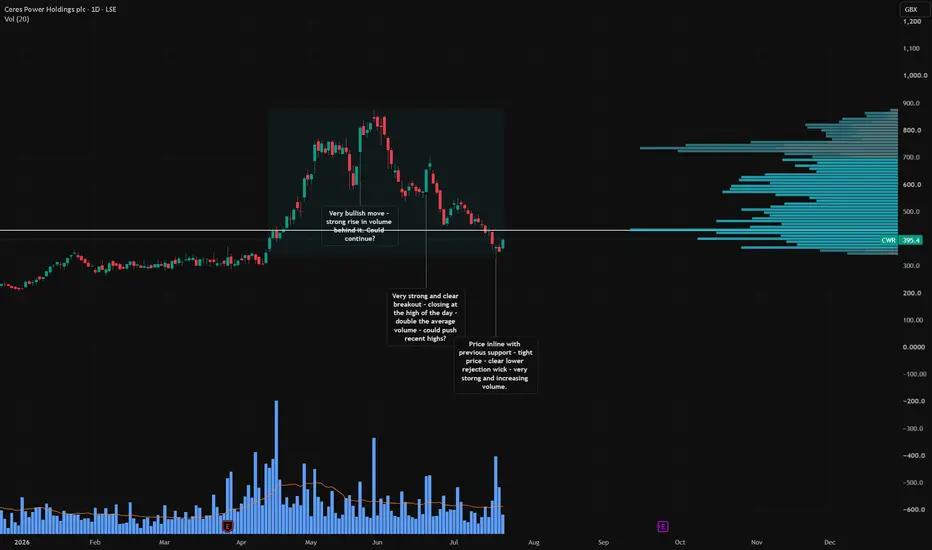
CWR is the 21% gap up a signal of a fresh hydrogen momentum run?Incredibly my screener has never picked up on this one this year, which is a shame because I have missed out on some impressive gains. I participated in a similar hydrogen name, ITM Power, a little while ago. Both experience wild swings driven by pure speculation in green energy. They offer great trading opportunities if you can get on the right side of the momentum.
Zooming out for detail, the stock has spent a week in a tight compression phase.
Friday shattered that ceiling. We saw a powerful gap up at the opening bell, with the price closing right at the dead high of the daily range. The effort from the buyers was validated by a credible spike in volume, showing a clear imbalance of demand over supply.
When a stock breaks out of a flag pattern on expanding volume, the path of least resistance is heavily skewed to the upside. It could easily continue further into this clean air. One to watch.
JNEO is the 3.5x volume surge a sign of strong hands stepping inQuite a few rotations with Journeo recently, creating multiple opportunities for astute traders out there.
We saw an interesting and strong move up around 4.4% on Friday. This was the direct result of a massive effort behind the move, with the volume print coming in at 3.5x the average.
Zooming out for context, the previous steep drop in March found a firm floor on high volume, suggesting structural buying. This recent price push confirms someone is aggressively finding value at these lows.
Could it retrace back up to the highs of the most recent consolidation zone? The current momentum says yes. The immediate overhead resistance is the line in the sand, but with volume validating the move, the buyers look like they are in control.
Price target: 480p
Potential reward: 17%
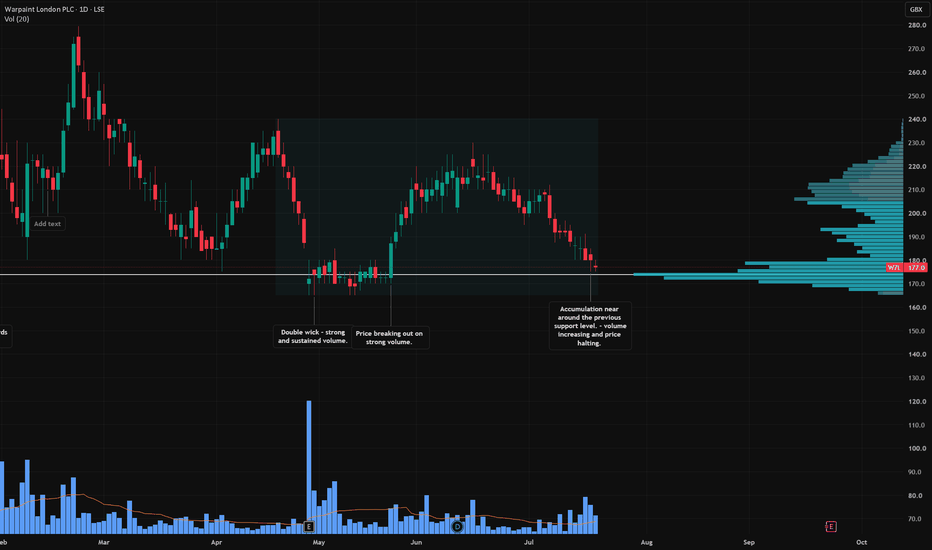
W7L ready to watch if the path of least resistance points upwardA credible looking base forming here along the 170p price level. The price falls look over for now as the price has tracked sideways for the past two weeks, slipping into compression.
Zooming out to late April, we see an interesting anomaly, a massive volume spike where the price remained tightly locked. Classic Wyckoff absorption. The insiders were clearly cleaning up supply at the floor.
Friday looks like things could have taken a turn. We had a very clean bullish up candle on the day, effortlessly taking out the sellers around the 185p resistance level.
The volume profile confirms the thesis. There is a significant weight of volume at the lower end of this range, meaning institutional accumulation is likely complete. With the effort now showing a clear result, the path of least resistance is up. It is one to watch.
Price target: 240p
Potential reward: 28%
FOXT institutional absorption inside Friday's wick?I know I have been openly bearish on the housebuilding sector recently, but it is worth making a distinction here. Estate agents like Foxtons are actually far more resilient than the pure housebuilders because they are underpinned by sticky rental revenue that keeps ticking along regardless of what the sales market is doing.
Sellers tried to push this lower on Friday and ran straight into a wall of buying support. Volume rose strongly as that happened, and looking at the detail the greatest concentration of volume was transacted within the wick of that candle, as shown by the white horizontal line on the volume profile. That is a clear sign buyers were absorbing every sell order being thrown at them below the day’s close.
A push through 47.5p would be the trigger for me, with the next meaningful resistance sitting around 52p from here.
Price target: 52p
Potential reward: 17%
PRV did you catch the strong volume building under resistance?I covered this one last week and the setup is only getting more compelling.
The price compression continues, with rising lows pushing the price tighter and tighter against the overhead resistance at 760p. Volume has been consistently strong throughout this process, which is exactly what you want to see building underneath a potential breakout.
I am anticipating a break to the upside from here. That said, market makers are a clever bunch and can pull all sorts of tricks to move prices in their favour, so nothing is ever guaranteed. Just my own observations of course.
Price target: 900p
Potential reward: 17%
MOON will the thin volume vacuum trigger an effortless breakout?A long drawn out trading range between 200p and 230p and Monday opened right at the top of it.
The volume profile on the right is the interesting part. There is very little volume transacted above 222p, which tells you that price level has rarely been tested and agreed upon by buyers and sellers. Thin volume areas offer thin resistance.
As the price approaches 222p again in the future it is worth paying close attention. If it can push through on decent volume there is not much standing in its way above that level.
A key level to keep on the radar.
GFM ready to see if the path of least resistance points upward.The upper wick on results day caught my eye, though the overall volume was not particularly remarkable.
What made me look closer was the volume profile. It turns out very little volume was actually transacted within that upper wick. On the surface that looks like a rejection from sellers, but I think there is another interpretation worth considering. Low volume at a higher price level can also indicate the market makers testing the waters above to see how much supply is sitting up there. The answer appears to be not much.
If that reading is correct, a sudden push of volume from here could send the price upwards with very little resistance to slow it down.
YCA will the tight range build a base for a reversalThe price is pulling back here but the closer it gets to the previous support area around 538p the more interesting it becomes.
Thursday and Friday are both showing rejection wicks to the downside with volume starting to creep back in. It could be nothing, but that combination at a known support level is always worth watching.
Too early to call a reversal just yet. I would want to see the price action tighten up further before considering a position. One to keep on the radar.
BMS could the upcoming earnings report turn 240p from a ceiling In stark contrast to DotDigital, I do have more of an informed view both fundamentally and from a technical front, both of which I view as positive.
The price tried to push through the 240p level back in mid March and was rejected. This week it has attacked that same level again on volume around 6 times the average. That is a significant amount of effort going into this price point.
Friday’s volume was much lower, but crucially the price held at the high of the day at 240p. When volume dries up and the price stays elevated, it suggests the sellers at that level have largely been cleared out.
Earnings are due in five days. The timing of this volume spike is interesting to say the least. I will leave you to draw your own conclusions on that one.
All my own humble view of course.
DOTD - is the quiet higher low squeeze preparing for a breakout?Another chart showing that series of higher lows I keep coming back to. The price has been quietly squeezing upwards and Friday delivered a massive volume spike around the current price level.
The key question as always is whether that volume represents accumulation or distribution. The volume profile on the right gives a useful clue. There is a significant concentration of volume traded between 43p and 50p, which provides a solid base of support. Above 50p the volume thins out considerably, meaning any breakout through that level could move quickly with very little resistance to slow it down.
I have no reference to the fundamentals here, this is purely a price and volume read. But if the larger players are quietly clearing their remaining stock into this buying activity, the price could be closer to a breakout than it looks.
One to watch.
GRI - did you spot the double rejection wick at the yearly lows?A possible double rejection wick to the downside with two consecutive days of massive volume, though it is worth noting that half year results were released this week which looked positive, so the elevated volume is at least partly explained.
Zooming into the price action is where it gets interesting. Friday saw the price fall 3.4% on volume 2.6 times the average, which on the surface looks bearish. But here is the detail that matters, the price failed to move lower than Thursday. Same volume, no new low. That is a classic sign of supply tightening and sell orders reducing.
Buyers could be quietly scooping up stock at these levels. One to watch closely next week.
HOC - is the massive rejection wick a sign of stopping volume?Possible stopping volume on display here and the timing is interesting given the macro backdrop.
Primarily a gold producer at around 97% gold and 3% silver, but with China hoovering up silver at record pace there could be some additional momentum building behind this one.
Thursday’s price action showed a deep rejection wick to the downside on very strong volume relative to the previous day. The volume profile confirms that the bulk of that volume was transacted within the wick itself, with the price closing back higher. Classic stopping volume behaviour.
The gap down on Friday is a little concerning and worth keeping an eye on. I would want to see that stabilise before getting too excited.
A sustained move above 700p would be a very nice reward from here.
Price target: 850p
Potential reward: 37%
BRBY did you spot the massive volume inside Friday’s wick?The results were more positive than I expected but the market clearly disagreed, and the price was punished for it.
What is interesting is what happened next. The sellers tried to push this lower but ran into some firm resistance around the 1050p level. Friday’s candle is particularly telling a significant amount of volume was transacted within the wick itself, meaning the price probed lower and was firmly rejected. Buyers are clearly sitting at this level and willing to defend it.
Could see a bounce from here back towards the top of the range.
Price target: 1355p
Potential reward: 27%