• Products
  • Community
  • Markets
  • Brokers
  • More
Get started
  • Markets
  • /United Kingdom
  • /Stocks
  • /Ideas
GRG:Price warming up!We are at a psychological zone and I expect the bulls to come in and defend the zone. Looking to target the next zone at the 2200 zone for a RR of 2.97.
LSE:GRGLong
by taftrader
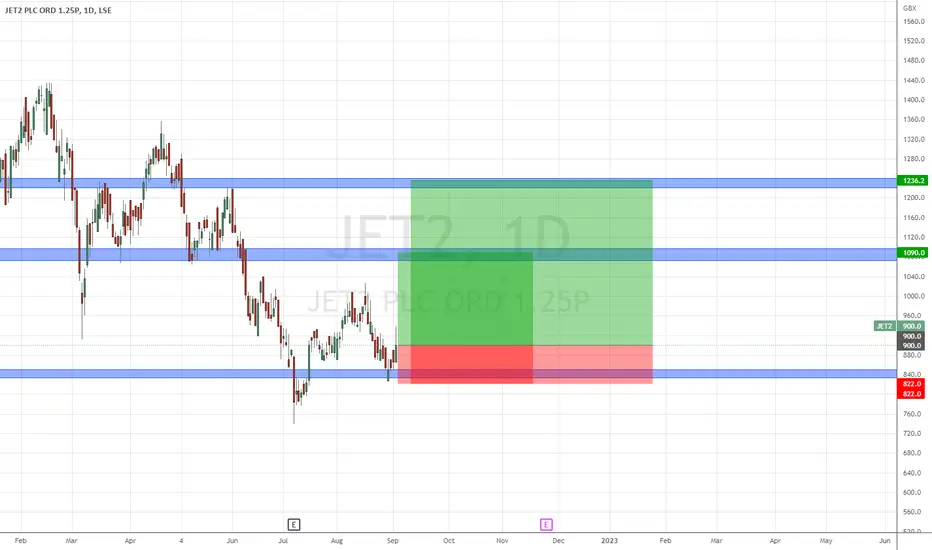
Recovery Play?Looking to play the recovery up from the bounce from 2 positions. The 1st target 1090 and 2nd target 1236. Friday's candle had good volume. the proper entry would have been 30 August daily close but better late than never. 1st TP=2.44 2nd TP=4.31
LSE:JET2Long
by taftrader
RTN:Lucrative risk reward!They recently agreed to acquire a Mexican style restaurant for £7 mil. With inflation expected to go slightly higher than current levels, consumer spending will definitely go down. Despite this I expect bulls to come in and support the share and catapult it higher from these levels its currently trading at. We are currently close to the all time lows and price action created a bullish formation on the weekly last week. I look to buy last week's close with ultimate target being the £80.00 zone.
RLong
by taftrader
GKP continues in 2yr ascending channelGKP continue to hold Continues in 2yr plus ascending channel with broker rating+50% and continued dividends no advice given
LSE:GKPLong
by Andy_Wa
$angs.l Angus Energy PLC Price Change % Change Share Price Bid Price Offer Price High Price Low Price Open Price Shares Traded Last Trade 0.26 12.68% 2.31 2.25 2.30 2.475 2.075 2.075 252,253,435 16:35:09 great fundamentals, expecting positive rns September. active oil wells and ownership. im buying for long term, 30p target
LSE:ANGSLong
by TechnicallyBullish
NatWest NWG 1dayShorting and take profit target 230p, only trading Friday. Share Price: 252.90Bid: 252.50Ask: 252.60Change: -3.90 (-1.52%) they have a stock 13/14 reverse split on Tuesday 30th Aug 2022 and special dividend snapshot. expect volatility that week.
LSE:NWGShort
by TechnicallyBullish
wizz air 4hr for the aviation industry im bullish, making a good pandemic recovery, The aviation market is anticipated to register a CAGR of over 5% during the forecast period (2022 - 2027). it is expected to take 2-3 years to recover completely. However, the return of the Boeing 737MAX into service and the recovery in domestic demand helped the OEMs in obtaining more orders and increasing aircraft deliveries in 2021.
LSE:WIZZLong
by TechnicallyBullish
AVACTA Update - Don't sell too earlyThis is a friendly note, just to say, don't sell too early. I don't want you sitting at the dinner table at christmas, with a frown on your face. Purely from what this chart is saying; forget about all the positive fundamentals going on in the background. (1) We had an impulse move from the lows down @ ~40p, up back inside the previous range and on to 130p. From which we have seen a healthy correction, and the lows of the previous range held well. Drawing a fibonacci retracement of that move
LSE:AVCTLong
by t_trad_coach
Updated
3
Likewise potential upside move Looking oversold on the RSI, falling wedge tightening which could lead to a move to the upside
LSE:LIKELong
by grbigly
The only way is up... This just screams of a breakout.. historical support and nice wedge pattern, likely to fall back down
LSE:KP2Long
by grbigly
Bullish RATFalling wedge, potential breakout on the horizon, looks like the lower support would make sense
LSE:RATLong
by grbigly
Price Action is the Only TruthAt the western markets, the stock is mimicking each other. We also have a 535 zigzag here. The AB wave is done and we are anticipating a drop to complete the C wave.
LSE:BATSShort
by KatlehoThaba
Train about to leave - Last CallSomething tells me this is your last chance to get on the AVACTA train. Fundamentals - We are awaiting the results of phase 1 trials, and all things are pointing for it to be very positive. - A great pipeline of drug development - Possible Take-over bids incoming - With a little research, the list goes on and on to be honest for Avacta. Charts - Higher time frame, we have formed this bull flag from the previous impulse move. - Price action has consolidated and we now have decent accumulati
LSE:AVCTLong
by t_trad_coach
2
Fresnillo: Attention SeekerBulls and bears are currently both angling for Fresnillo’s attention. We still expect the bears to win, though. They should grab Fresnillo and take it below the support at GBP 456.60, pulling it into the turquoise zone between GBP 473.60 and GBP 250 to finish wave v in magenta as well as wave Z in turquoise and wave (2) in yellow. However, there is indeed a 32% chance that the bulls could be victorious instead and push Fresnillo above the resistance at GBP 997.60, thus eliciting further ascent a
LSE:FRES
by HKCM_Global
XLM UAH as an indicator of XLM growthHryvnia as an indicator of XLM growth is also a graph that shows when there will be an introduction of digital hryvnia based on xlm defined agreement between the Ukrainian authorities and Stellar developers already exists. With a high probability before solving the hryvnia problem, they will create a serious fall in UAH to which zone the analysis will be in the next idea and the solution will be in the form of creating a digital hryvnia in the application
XLong
by FTT_TRADER369
1
easySell? No signs of the downtrend coming to an end.EasyJet - Intraday - We look to Sell at 401.2 (stop at 434) The medium term bias remains bearish. Broken out of the channel formation to the downside. An overnight negative theme in Equities has led to a lower open this morning. Preferred trade is to sell into rallies. Expect trading to remain mixed and volatile. Our profit targets will be 275 and 250 Resistance: 401 / 429.9 / 448.6 Support: 368.4 / 338 / 300 Disclaimer – Saxo Bank Group. Please be reminded – you alone are responsib
LSE:EZJShort
by Saxo
Jet2 part of the dart group family, neutral/long jet2 is in my list of safe stocks, i like this stock for the long term, good fundamentals and technicals. support of around £7.65 since 2018. Im long on this for the long term, phil messon ceo is a forward thinking and customer focused. one for the retirement portfolio, short term expected to hit support again before hitting ath again next year,
LSE:JET2
by TechnicallyBullish
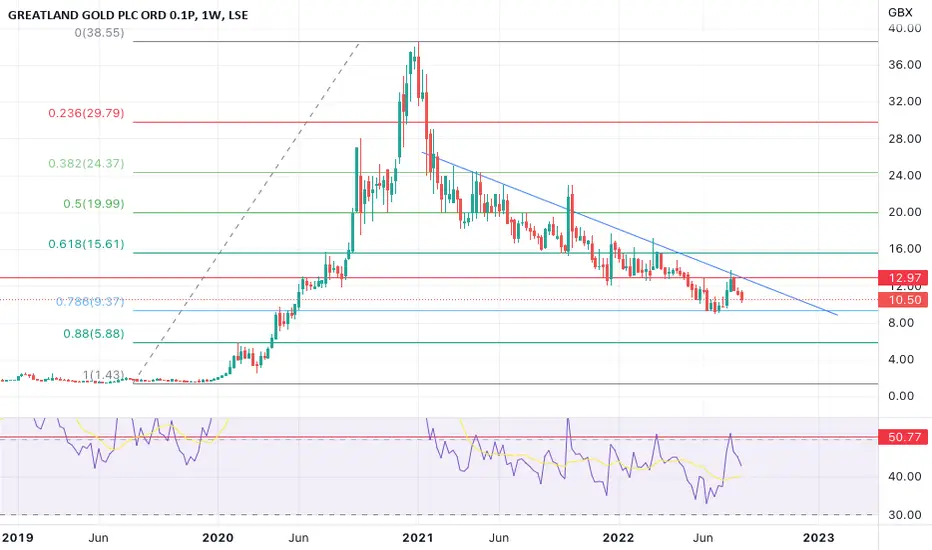
GGP Deep DiveHere's a macro macro (1 week chart) deep dive on GGP: - No fundamentals here, just looking at the chart zoomed way out. - Price bounced from the 0.786 fibonacci retracement (1 week chart). A good place for an entry, but only in hindsight now. - Looking for this level to hold ~ 9.44, and on the lower time frames it looks as though price action is trying to form a swing higher low ~10.00. - One might want to take an entry here in the hope that this higher low plays out and we get a reversal.
LSE:GGPLong
by t_trad_coach
Updated
#HSBA – Breakout from Bullish symmetrical tri/ascending wedge#HSBA – Bullish symmetrical triangle/ascending wedge, breakout has begun, will it hold? The stock goes ex-div tomorrow (18th Aug), if the P holds strong by close tomorrow... expect this to continue upwards in this inflationary env
LSE:HSBA
by mjtrad25
$LUCE - Beaten down reversal play with +50% to +100% upsideTechnical Analysis (TA) On the weekly chart the momentum indicators are oversold. There are early signs over of a potential reversal. On the daily chart the price is flat and there is a small wedge formed. We need price break above 115 and then we could potentially see LUCE reach 145 and 170. Price Target Entry: 115 Target 1: 145 (+26%) Target 2: 170 (+48%)
LSE:LUCELong
by subtlepapi
Glencore Short Weekly ChartGlencore put in a double top back in March and April and since price has fallen 28%. Looking at Fib levels on the weekly chart price has now retraced 50% and has put in a hanging man candlestick on the weekly chart. The RSI is also dropping along with volume - making a short set up lucrative for the coming days/week. Couple this with the fact that the UK 100 has had a great run recently coming off the lows with a consistent move higher. We are now however approaching all time high resistance wh
LSE:GLENShort
by Just_Jacqs
Target 63 ( 1 to 5 months )Good Breakout, Good Earnings , Fundamental and techinical is great , so Target 63 Duration 1 to 5 months..........
0Long
by Risk_is_yours
Updated
Target 32 ( 1 to 5 months )Good Technical and Fundamental ( Earnings ) So Target 32 Duration 1 to 5 months
0Long
by Risk_is_yours
Updated
$ITV - Continuation swing with +10% to +40% upsideTechnical Analysis Price bottomed out 3 weeks ago and the RSI + William %R Price broke out the daily channel last week and has been consolidating above the 1D 50EMA. There is a good zone to buy before a further push above 76 and potentially 90 Price Target Entry: 71-73 Target 1: 76 (+5%) Target 2: 88 (+20%) Analyst Targets: 101 (+40% Financial Metrics High quality as shown by the financial metrics. Undervalued with high upside/growth potential.
LSE:ITVLong
by subtlepapi
123456789101112131415161718192021222324252627282930313233343536373839404142
…999

Made by humans

Select market data provided by ICE Data Services. Select reference data provided by FactSet. Copyright © 2026 FactSet Research Systems Inc.Copyright © 2026, American Bankers Association. CUSIP Database provided by FactSet Research Systems Inc. All rights reserved. SEC filings and other documents provided by Quartr.© 2026 TradingView, Inc.

SOC 2 CompliantGDPR Compliant
More than a product
  • Supercharts
Screeners
  • Stocks
  • ETFs
  • Bonds
  • Crypto coins
  • CEX pairs
  • DEX pairs
  • Pine
Heatmaps
  • Stocks
  • ETFs
  • Crypto coins
Calendars
  • Economic
  • Earnings
  • Dividends
  • IPOs
More products
  • News Flow
  • Portfolios
  • Fundamental Graphs
  • Yield Curves
  • Options
  • Macro Maps
  • Pine Script®
  • MCP Server
Apps
  • Mobile
  • Desktop
Community
  • Social network
  • Wall of Love
  • Refer a friend
  • Creator program
  • House Rules
  • Moderators
Ideas
  • Trading
  • Education
  • Editors' picks
Pine Script
  • Indicators & strategies
  • Wizards
  • Freelancers
  • Marketplace
Tools & subscriptions
  • Features
  • Pricing
  • Market data
  • Gift plans
Trading
  • Overview
  • Brokers
  • Brokers comparison
  • The Leap
Special offers
  • CME Group futures
  • Eurex futures
  • US stocks bundle
About company
  • Who we are
  • Space mission
  • Blog
  • Help Center
  • Careers
  • Media kit
Merch
  • Tarot cards for traders
  • The C63 TradeTime
Policies & security
  • Terms of Use
  • Disclaimer
  • Privacy Policy
  • Cookies Policy
  • Accessibility Statement
  • Trust Center
  • Security tips
  • Bug Bounty program
  • Status page
Business solutions
  • Widgets
  • Charting libraries
  • Lightweight Charts™
  • Advanced Charts
  • Trading Platform
Growth opportunities
  • Advertising
  • Brokerage integration
  • Partner program
  • Education program
Community
  • Social network
  • Wall of Love
  • Refer a friend
  • Creator program
  • House Rules
  • Moderators
Ideas
  • Trading
  • Education
  • Editors' picks
Pine Script
  • Indicators & strategies
  • Wizards
  • Freelancers
  • Marketplace
Business solutions
  • Widgets
  • Charting libraries
  • Lightweight Charts™
  • Advanced Charts
  • Trading Platform
Growth opportunities
  • Advertising
  • Brokerage integration
  • Partner program
  • Education program
Look FirstLook First