Long
Long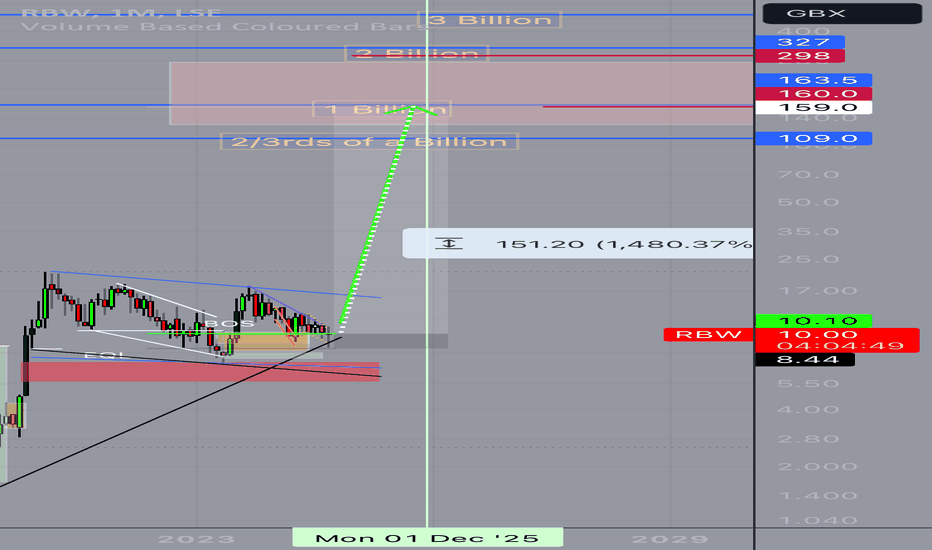
 Long
Long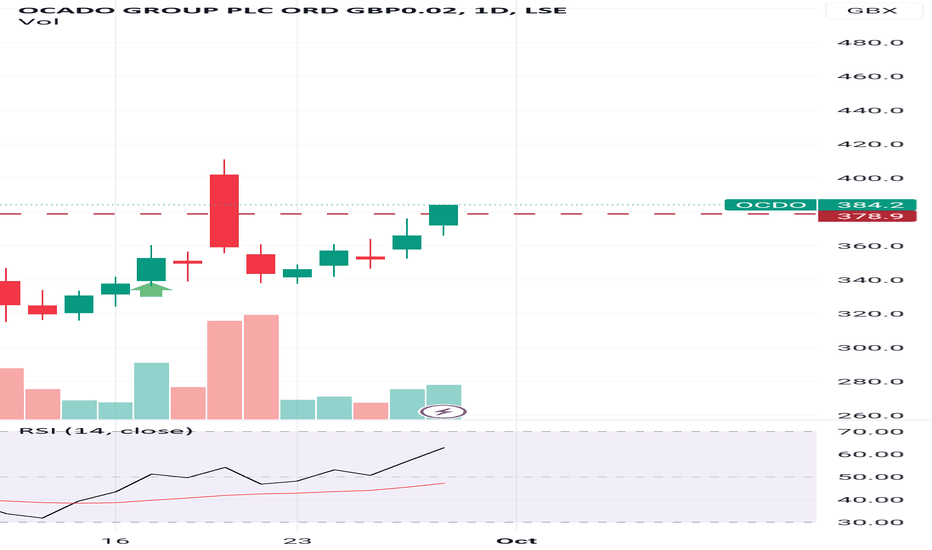
 Long
Long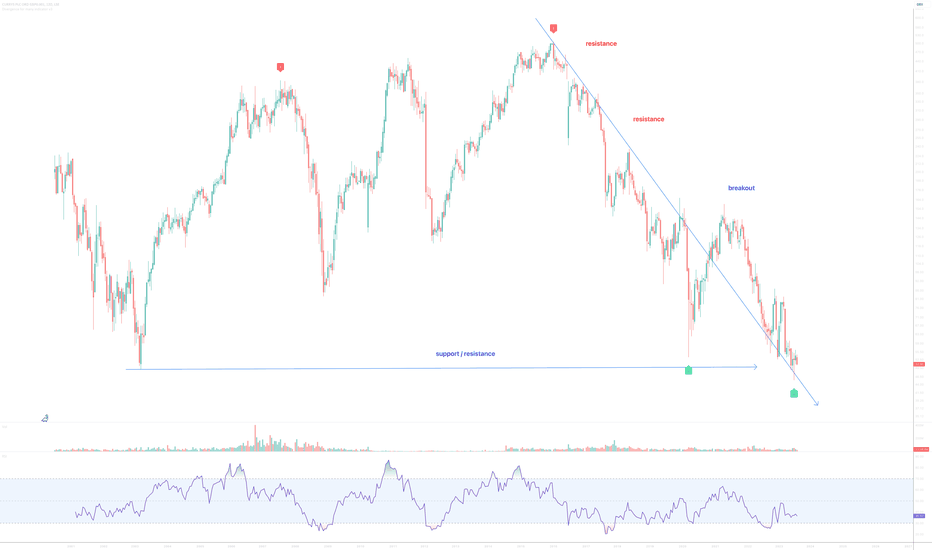
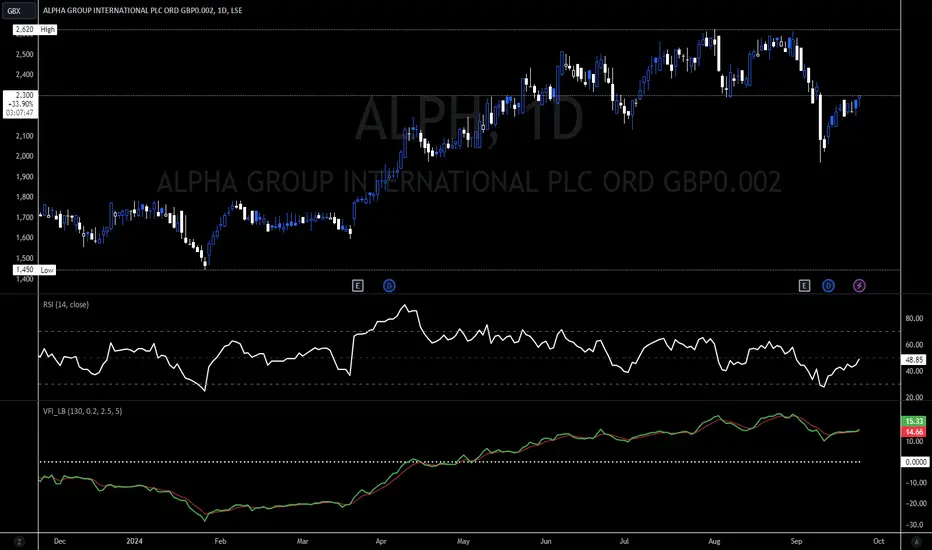
Alpha Group - What next post-earnings and CEO sucession plan?My take on Alpha Group:
Alpha Group LSE:ALPH leads, in my view, as the UK's best FXRM firm, and institutional lending provider. What most lenders don't do is take a mixed approach - both expertise and technology when developing and implementing their services. From a macro perspective, Alpha Group provide stronger growth prospects than peers, as well as higher margins. They are continuously making large investments into their infrastructure, expanding their already strong platform. Analysts ests. momentum continues to be strong, due to the cheap valuation (despite the inflated NII).
The acquisition of Cobase had provided an additional vector of growth for the company, and will continue to do so into the future. Presently, and historically, Alpha Group have always displayed a super solid balance sheet, indicating mgmt. are in control. Buybacks are continuous, with £20m now completed in this year alone, leaving them with a huge cash position, over £180m.
And, as we all know by know, interest rates are dropping globally! Slowly, but surely, we will come down to a more modest cost of borrowing, and Alpha Group are a major beneficiary of this.
4th September 2024 - 1H24 results
• Total income up 19% yoy to £107m. Revenues at £64m, a 16% yoy rise. 1H underlying EBITDA @ £25.3m (39.4% margin), surpassing PH’s estimate of £23.3m.
• Additionally, an increase in net client additions and revenue per client. Corporate FXRM client base grew by 9% yoy, and institutional FX client numbers rose 11% yoy.
• Cash up again! Now sitting on £180m at the end of the first half. Buyback on track, now with £20m completed.
• As at 04/09, trading at approx. 6x ‘25e EV/EBITDA and an 8% FCF yield, still suggesting good valuation for buying.
10th September 2024 - CEO Transition & Succession
- Alpha Group announced today that Morgan Tillbrook, CEO, has decided to step down from his duties at the company.
- He will continue his role up until the end of the calendar year, where he will then be succeeded by Clive Khan.
- Clive is currently Chairman at Alpha Group and is also the CEO of takepayments. takepayments was recently acquired by Global Payments NYSE:GPN , which I believe provides perfect timing for Clive to step down as CEO and step up for the role at Alpha Group.
- With over 30 years in the FX and payments industry, there's no real better option than Clive, as his philosophy is almost identical to Morgan's.
- He transformed takepayments from a failing bill payments business into one of the leading card acceptance businesses in the UK. As for Morgan, he too has a history of angel investing.
- I anticipated a potential move for Morgan, as his long history of angel investing gave me a "heads up" to his absence.
- At the open on the 10th, the markets felt disappointed and surprised, causing the stock to drop c.10% on the day.
- However, Morgan made absolutely clear in his formal announcement that he will be leaving the business primed for further exponential growth and equipped with a robust business model. He emphasised that Alpha Group cannot be left in better hands than Clive, and I believe there is no reason to expect a rough transition in the step-up for him.
 Long
Long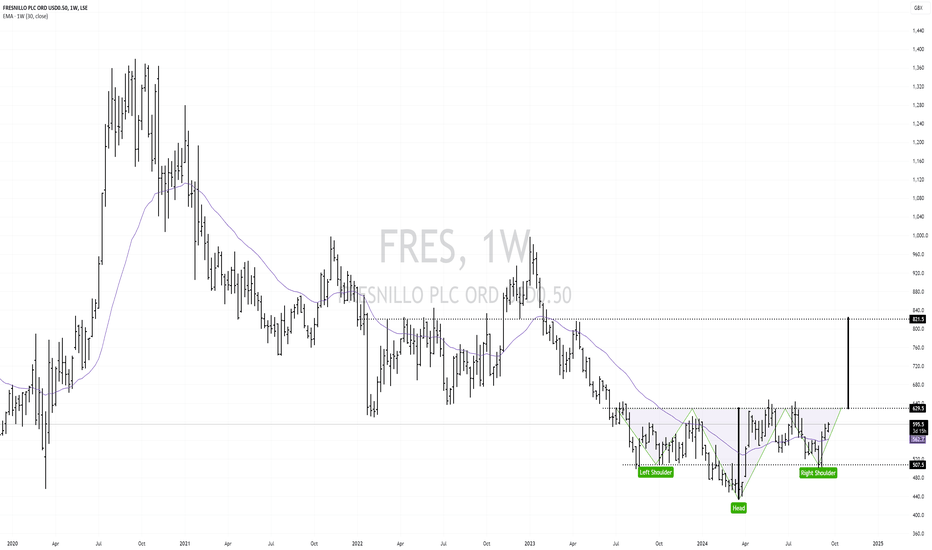
Long 
Long 
Long 
 Long
Long
 Long
Long
Gold Fields Limited - Who benefits most from the gold rally? Key arguments supporting the idea
Gold is currently trading above $2500, reflecting a 36% increase from its low point last October and a 23% rise since the start of the new bull run in late February. However, the market has yet to price-in these astronomical gold price levels with gold mining stocks. We conducted a thorough analysis of the gold mining landscape and came up with a list of the companies that have the most potential in the coming year in our view.
We evaluated gold mining companies based on three pillars: 1) their performance in the past year, 2) production growth expected in 2025, and 3) EBITDA margin going into 2025. With all three in mind, we decided to list the most undervalued stocks and came up with the following list.
Bull Thesis for Gold Miners
A rally in the gold prices has led to margin expansion for many of the players with some of them going into 2025 with a secured EBITDA margin of nearly 90% (for royalty companies), and 60-70% (for those miners with an AISC of less than $800 per ounce).
A rally has fast forwarded many of the projects under construction phase, prompting miners to enjoy the fruitful seasoning with ingredients such as high price, government support and a decrease in interest rates.
While we may be worried that there’s little room left for expansion in the gold pricing, it does little to affect gold miners, who’re willingly secure future gold sales at currently elevated forward prices, ensuring them hefty margins years in advance.
Business Overview
Gold Fields is one of the world's largest gold mining firms, headquartered in Johannesburg, South Africa, with operations spanning Africa, Australia, and the Americas. Headquartered in South Africa, it is one of the world’s largest gold producers, known for its significant high-quality reserves and resources. Key operating assets include the South Deep mine in South Africa, the Tarkwa and Damang mines in Ghana, the Cerro Corona mine in Peru, and multiple sites in Australia, including the St Ives and Granny Smith mines.
In recent years, Gold Fields has been expanding its presence outside Africa to reduce geopolitical risks and diversify its asset base. It has also been investing in new growth projects, such as the Salares Norte project in Chile, which is expected to become a key contributor to the company’s future production. Namely, Gold Fields (GFI) has become the 4th largest gold mining company in 2022 following its acquisition of Yamana Gold (AUY) for $7 bn. The rationale for acquisition was an intentional increase of presence in the Americas region, where prior to that the Company was fairly active. Recently the Company announced that it will acquire Canadian Osisko for $1.6 billion amid rising precious metal prices. The acquisition supports Gold Fields' business diversification beyond Africa. The mine is expected to start operations in 2027, with an annual production volume of 300 Koz. The Company is forecasted to increase gold output by 14% in 2025, while it enjoys a high margin of 56%.
 Long
Long
Defensive Dividend Stock Interest rates are coming down, the rate cutting cycle has started in the EU and the UK. Time to look at the best defensive stocks out there.
Reckitt Benckiser is close to the top of my list for the following reasons:
1. High divident yield - 4.51%. This will soon be higher than having money parked in a savings account.
2. Low market volatility and recently oversold on the monthly RSI. This suggests a new upcycle could well be on it's way.
3. Economic Moat - strong brand ownership of essential goods. Including Lysol, Dettol, Durex, Nurofen, Finish.
4. Defensive characteristics - It's essential product offering (cleaning products, painkillers, etc) are required regardless of the economic situation. Founded in 1823, making it over 200 years old and still going strong.
Technical analyis - observe my chart, it speaks for itself. Complete reset on the Monthly RSI and hopefully the start of a large wave up.
Not financial advice, do what's best for you.  Long
Long
Will Rolls Royce print 60% correction to 180p?Since the long idea (linked below) price action has melted up 600% in only 21 months. Astonishing. A plethora of long ideas are now published, including on this platform.
The Motley Fool, July 11th - recommended buy
“Rolls-Royce’s share price looks very undervalued to me, with strong business growth prospects, and an investment-grade rating adding to the firm’s allure.”
People actually pay money for this rag. This analysis from WW is free.
Businessinsider, June 26th - According to TipRanks, RR stock has received a Strong Buy
“Deutsche Bank Stays Bullish on Rolls-Royce (RR) Amid Industry Headwinds”
It goes on..
“Menard is a five-star-rated analyst as per the TipRanks Star Ranking tool. Through this tool, TipRanks monitors the performance of many financial experts, ranking them based on their success rate, average returns, and statistical significance.”
It is fascinating to see so many turn bullish at this time. It is a reminder why so few traders (and hedge funds) succeed. Greed.
** The Technical Analysis **
On the above 3 week chart we have:
1) RSI touches 89.3 (blue line), it has never been at this level in the entire history of the business. I remind you this is a 3 week chart. The entire history is shown below. These are bubble levels of strength recorded on the RSI index.
2) RSI support prints breakout. Look left.
3) The Gravestone DOJI candlestick prints across multiple timeframes, including this chart.
4) Why 60% correction? Significant market corrections in the stock were always arrested at the same levels when looking left.
4a) Annual support (yearly candles).
4b) The Fibonacci 0.382. In 2016 the correction was even further, down to the 0.618
The orange line is where both those conditions 1st confirm.
Is it possible price action continues up like the financial rags claim? Sure.
Is it probable? 100% no.
Ww
RSI big picture 3 week
 Short
Short
Ubisoft Entertainment SA / UBIUbisoft Entertainment aka ubi "bug" is a french video game publisher headquartered in Saint-Mandé with development studios across the world. Its video game franchises include Assassin's Creed, Far Cry, For Honor, Just Dance, Prince of Persia, Rabbids, Rayman, Tom Clancy's, and Watch Dogs. Ubisoft was one early investors in web3 technologies and projects too
last year was a terrible year for ubi because not only they didn't succeed with their franchise like farcry 6 but also they entered the bear market while they were working on their bigger projects like AC. “We are clearly disappointed by our recent performance,” said Ubisoft Chief Executive Yves Guillemot. “We are facing contrasted market dynamics as the industry continues to shift towards mega-brands and everlasting live games, in the context of worsening economic conditions affecting consumer spending.”
2023 is a big year for ubi and they are going to publish some of their best games like Assassin's Creed Mirage, Tom Clancy’s The Division Heartland and skull and bones
ubi stock now in Accumulation phase and its next targets are 21, 23 and 25  Long
Long
 Long
Long
 Long
Long
Burberry may turn around soon? EW sequenceBurberry (ticker: BRBY) reaching ~14 years lows, where the risk /reward ratio for the mid/long term starting to be favourable. I have two scenarios sketched out on the weekly, white being a 5 wave up, in which we finished 3, followed by a yet unfinished irregular flat structure as a wave 4. Yellow suggests a 3 count move up as an (A) wave, working now on the (B) wave, and later (likely several years) a (C) would follow in 5 subwaves.
In yellow I would primarly expect a deeper cut in the (B) wave also as an ABC structure, where we likely nearing the A wave bottom in the foreseable future.
In both scenario a move-up should be imminent, white to start the wave (5) to the upside, and for the yellow it would be the B wave. For the yellow I put there the resistance levels, but be aware, as price cuts deeper (IF), then we need to adjust that red resistance fib box.
Now, the movedown already consist 5 waves, so technicly we could be near to the local lows, and also in support already (hence the post). Next levels to watch: 951, 885, and 834 and 768 as bigger fib support levels.
Weekly RSI is oversold despite MACD is weakening, On the daily we are building divergence already, so far all the meaningful MA's (9/21/50-52) currently rejecting price action, and far below the 200day MA.
 Long
Long
Long