• Products
  • Community
  • Markets
  • Brokers
  • More
Get started
  • Markets
  • /United Kingdom
  • /Stocks
  • /Ideas
Is the ending diagnal pattern close to completion?As long as the price doesn't go lower than the £420–£415 level, then the ending diagnal pattern looks on. However, if the price breaks below that level, then another pattern could be playing out.
LSE:FRES
by moneyjeff1
1
Lloyds Bank Analysis - Continuous, Just as the Markets !This is a Thread, so Follow for Technical Analysis performed with TrapZone Pro & UMVD Indicators. * Trend is Based on TrapZone Color * Bar Colors give us Momentum Green from strong Up Moves. Red Bars point to strong Down Moves. * Red UMVD = Selling Pressure & Green UMVD = Buying Pressure. Purple is for Divergence = Battle of Supply & Demand -------------------- 1-23-2024 Strong downtrend with RED TrapZone established for days now. Price is retracing a bit with GREEN UMVD coming in now. Bunch
LSE:LLOY
by SnowflakeTrader
Updated
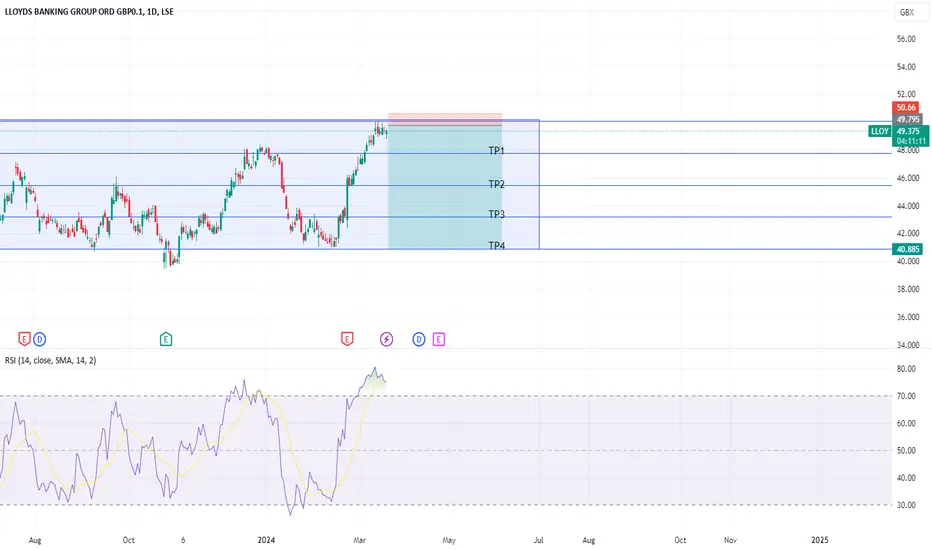
LLOY, Gap Upward after cross a resistanceAfter a formation of a double bottom, we can see the price crossing the two resistance levels. Making a Gap on Thurdays Open. DMI is showing some bullish strength, RSI is at an extreme of overbought. Volume is increasing right now, after decreasing on Thursdays. WIth these factors, the price it will probably try to close the gap or even test the new support level.
LSE:LLOYLong
by AFCapital21
CPG - 10 months CUP & HANDLE══════════════════════════════ Since 2014, my markets approach is to spot trading opportunities based solely on the development of CLASSICAL CHART PATTERNS 🤝Let’s learn and grow together 🤝 ══════════════════════════════ Hello Traders ✌ After a careful consideration I came to the conclusion that: - it is crucial to be quick in alerting you with all the opportunities I spot and often I don't post a good pattern because I don't have the opportunity to write down a proper didactical comment; - sin
LSE:CPGLong
by TheArtOfCharting
20 bags the offering...HUGE upside confirmed by 3 month chart3 month sessio might be a bit long term for alot of people but the fundamentals are also supporting this one. Penny stock Gold Producer about to take the leap into mid tier status. Watch for news about the current contractor dispute as once resolved the DCF valuations will become the driver of the market valuation. This is the one that could change your life.
HLong
by Plat_Hunter
1
ULVR, a British stock, looking to sell.Price is dropping from Weekly Supply. This is a good Daily Supply created on the way.
LSE:ULVRShort
by dungtinhhd123
Updated
LLOY Pull Back Think we see a bit of a pull back on Lloyds from here. Would be looking at least the 50% line with a bit of luck.
LSE:LLOYShort
by CryptoAlts7
Rolls Royce is facing a long-term resistance lineWeekly chart, the stock is facing a long-term resistance line (started Jan 2014, dashed grey-colored line); so it needs strong bullish power to beat. After crossing this resistance, the target will be 615 Technical indicators: MACD is positive, RSI is showing over-bought - which indicates tendency to have some correction.
LSE:RR.
by snour
Updated
GETINGE - SHORTGETINGE on the LSE (London Stock Exchange) - Rejection at the 200ema on big volume
LSIN:0GZVShort
by Mika_trading
Ready for a big move. looks like it’s either completed an Ending Diagonal in a 5th wave or it needs one more move down for its completion.  Either way, with the massive negative divergence shown in the RSI, it looks ready for a big move up.
LSE:FRES
by moneyjeff1
4
BP. - 4 months HEAD & SHOULDERS══════════════════════════════ Since 2014, my markets approach is to spot trading opportunities based solely on the development of CLASSICAL CHART PATTERNS 🤝Let’s learn and grow together 🤝 ══════════════════════════════ Hello Traders ✌ After a careful consideration I came to the conclusion that: - it is crucial to be quick in alerting you with all the opportunities I spot and often I don't post a good pattern because I don't have the opportunity to write down a proper didactical comment; - sin
LSE:BP.Long
by TheArtOfCharting
2
ANTO - 33 months HEAD & SHOULDERS══════════════════════════════ Since 2014, my markets approach is to spot trading opportunities based solely on the development of CLASSICAL CHART PATTERNS 🤝Let’s learn and grow together 🤝 ══════════════════════════════ Hello Traders ✌ After a careful consideration I came to the conclusion that: - it is crucial to be quick in alerting you with all the opportunities I spot and often I don't post a good pattern because I don't have the opportunity to write down a proper didactical comment; - sin
LSE:ANTOLong
by TheArtOfCharting
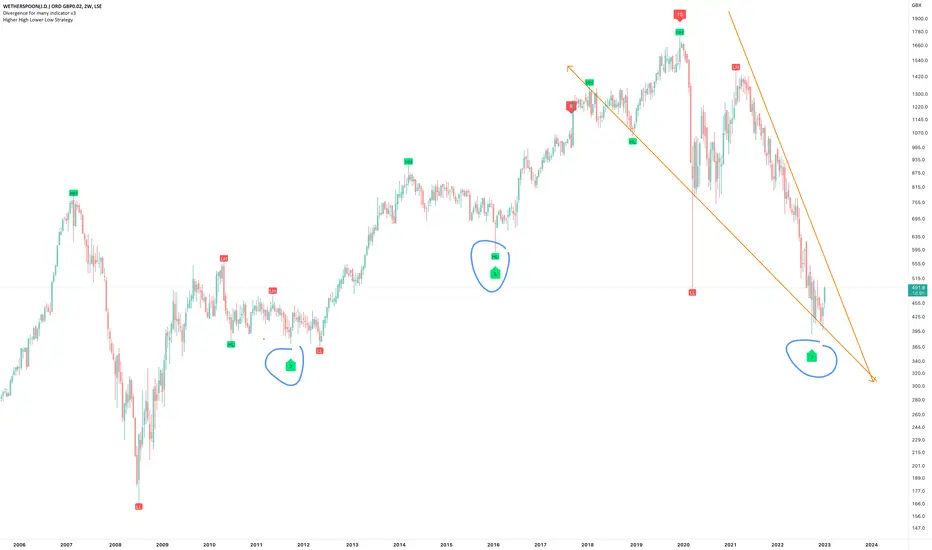
JD Wetherspoon PlcOn the above 2-week chart price action has corrected 75% since the sell signal (not shown) in October 2019 @ 1600. Now is an excellent moment for a long trade position. Why? 1) A strong buy prints (not shown). 2) Strong bullish divergence. Blue circles. Look left. 3) Falling wedge is yet to breakout however with points 1 and 2 we can be confident in the direction. 4) The UK economy is circling the drain hole, it makes sense alcohol consumption will be on the up! Is it possible for price act
LSE:JDWLong
by without_worries
Updated
1
TP ICAP (TCAP.L) Potential Breakout, Eyeing $374 TargetThe stock is currently hovering around $198 and analysts are closely monitoring its potential to break through resistance levels. Positive Revenue News Fuels Optimism: This recent interest comes on the heels of the company's positive earnings report for fiscal year 2023. TP ICAP reported revenue of GBP 2.19 billion, indicating continued growth within the company. Breakout Potential: Technical analysts suggest that TCAP.L is nearing a breakout from its current resistance level of around $
LSE:TCAPLong
by Z4F4R
Monthly chart of Aviva - triangle still formingTriangle forming since the year 2000. Good results today, but it's hitting overhead resistance at 470 established in 2002 and 2019. No clear breakout yet and needs to add another 100p before it can start to consider a breakout.
LSE:AV.
by andmk2
Pearson Break-OutPearson broken out of clear resistance. Target 1480, being near the high of a few years ago, a target supported by the depth of the H&S visible on the monthly chart.
LSE:PSONLong
by Bazroshan
Right shoulder forming on Ocado A head and shoulder reversal pattern is forming on Ocado. Started in August 2022, this is likely to complete this December, but not guaranteed. The left shoulder is forming as expected. But will it bottom at about 380p and then rise?
LSE:OCDO
by andmk2
Updated
2
Don't Trip..Buy The Dip After an amazing run the last time ,price is here...Do we spy a 5th wave ending??10 bagger ahoy? And just like last time throwing a few k punt money..Risk management..GL
LSE:HMILong
by Sharecrazy
Updated
Possible entry with high profit potential and low stop loss.A riskier entry but worth considering. Rising trend followed by a prolonged consolidation. Long entry without waiting for the breaking of the upper trend line.
LSE:CNALong
by soarecomod
Direct Line Group - Back up after lows?An attempted buyout from Ageas after profit warnings. Can Direct Line Groupe start making profits again? Insurance has risen substantially over the past year. This may help to stabilize insurance companies that have been battered due to persistent storms damaging homes in the UK and the price of car repairs soaring since Covid.
D
by Crypto_Lad
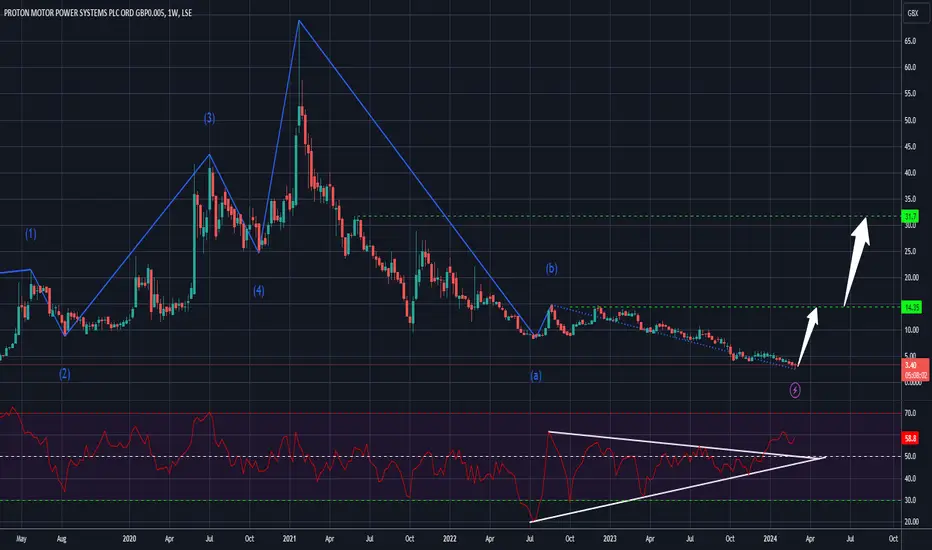
cash cow?Hydrogen play with some orders and a nice looking chart ...speculative punt money in ..looking for some strength to add later ..Risk management ..GL
PLong
by Sharecrazy
Updated
3
BALFOUR BEATTY PLC ORD 50P - BBY LONGPrice hovering around previous strong resistance? Possible bounce coming?
LSE:BBYLong
by troublefreetrading
Updated
Trade the News: Part 1 - StocksTrading newsflow isn't an exclusive privilege reserved for professional traders with access to extensive teams of analysts. With a bit of preparation and a dose of discipline, any trader can tap into the added volume and volatility that news injects into the market. In this two-part series, we present a 3-step template for trading scheduled news events in both the stock and forex markets. Let's dive in and explore the fast-paced world of news-driven trading. Stock Market News: Volume & Vo
LSE:RR.
by Capital.com
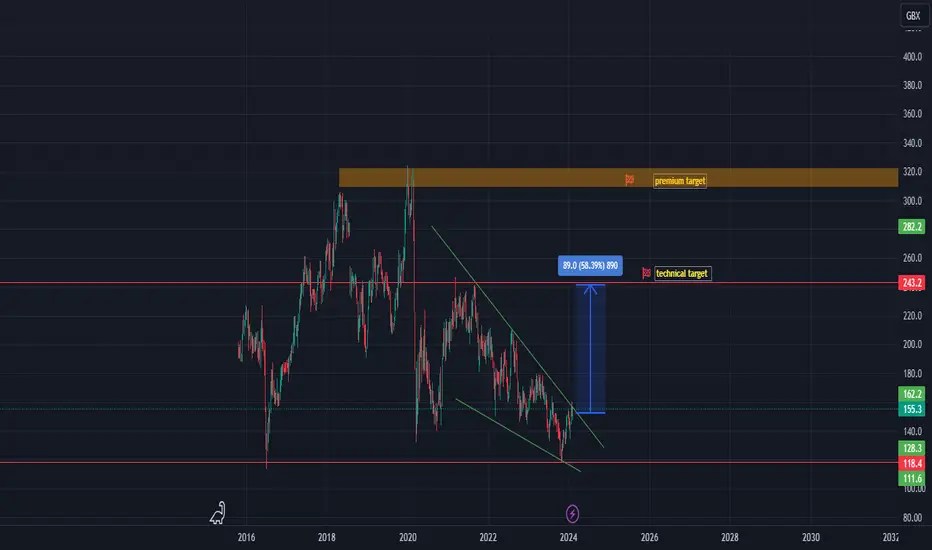
IBST falling wedgehi traders IBST has been in a downtrend and it has retested lows from 2016. It did a full reset. Now it may be a time to get a trend reversal. If we get a breakout to the upside, long position can be taken. Technical target: 243 $ Premium target: 309 -322 $ Looks bullish to me if we get a breakout and the follow-through. Good luck
LSE:IBSTLong
by vf_investment
Updated
123456789101112131415161718192021222324252627282930313233343536373839404142
…999

Made by humans

Select market data provided by ICE Data Services. Select reference data provided by FactSet. Copyright © 2026 FactSet Research Systems Inc.Copyright © 2026, American Bankers Association. CUSIP Database provided by FactSet Research Systems Inc. All rights reserved. SEC filings and other documents provided by Quartr.© 2026 TradingView, Inc.

SOC 2 CompliantGDPR Compliant
More than a product
  • Supercharts
Screeners
  • Stocks
  • ETFs
  • Bonds
  • Crypto coins
  • CEX pairs
  • DEX pairs
  • Pine
Heatmaps
  • Stocks
  • ETFs
  • Crypto coins
Calendars
  • Economic
  • Earnings
  • Dividends
  • IPOs
More products
  • News Flow
  • Portfolios
  • Fundamental Graphs
  • Yield Curves
  • Options
  • Macro Maps
  • Pine Script®
  • MCP Server
Apps
  • Mobile
  • Desktop
Community
  • Social network
  • Wall of Love
  • Refer a friend
  • Creator program
  • House Rules
  • Moderators
Ideas
  • Trading
  • Education
  • Editors' picks
Pine Script
  • Indicators & strategies
  • Wizards
  • Freelancers
  • Marketplace
Tools & subscriptions
  • Features
  • Pricing
  • Market data
  • Gift plans
Trading
  • Overview
  • Brokers
  • Brokers comparison
  • The Leap
Special offers
  • CME Group futures
  • Eurex futures
  • US stocks bundle
About company
  • Who we are
  • Space mission
  • Blog
  • Help Center
  • Careers
  • Media kit
Merch
  • Tarot cards for traders
  • The C63 TradeTime
Policies & security
  • Terms of Use
  • Disclaimer
  • Privacy Policy
  • Cookies Policy
  • Accessibility Statement
  • Trust Center
  • Security tips
  • Bug Bounty program
  • Status page
Business solutions
  • Widgets
  • Charting libraries
  • Lightweight Charts™
  • Advanced Charts
  • Trading Platform
Growth opportunities
  • Advertising
  • Brokerage integration
  • Partner program
  • Education program
Community
  • Social network
  • Wall of Love
  • Refer a friend
  • Creator program
  • House Rules
  • Moderators
Ideas
  • Trading
  • Education
  • Editors' picks
Pine Script
  • Indicators & strategies
  • Wizards
  • Freelancers
  • Marketplace
Business solutions
  • Widgets
  • Charting libraries
  • Lightweight Charts™
  • Advanced Charts
  • Trading Platform
Growth opportunities
  • Advertising
  • Brokerage integration
  • Partner program
  • Education program
Look FirstLook First