Long
Long
 Long
Long
 Short
Short
Tesco’s Loyalty Boost Sparks Channel BreakoutTesco's share price has come alive, breaking out of its recent lull just in time for the critical holiday season. With a long-term uptrend intact and a timely nod from the UK regulator on its loyalty schemes, the supermarket giant is flexing its retail muscles once again.
A Year of Growth, Loyalty, and Market Leadership
Tesco’s share price has been locked in a strong uptrend this year, supported by the 50-day simple moving average (SMA) consistently trading above the upward-sloping 200-day SMA. This sustained bullish momentum reflects the company’s strong performance, bolstered by robust earnings and strategic initiatives.
In its most recent half-year results for 2024, Tesco delivered a 7.4% rise in group sales to £30.2 billion and operating profit growth of 13.5% to £1.5 billion, highlighting resilience in a challenging retail environment. Its market-leading Clubcard scheme continues to drive customer engagement, contributing to a 3.7% increase in like-for-like sales in the UK and Ireland.
In September, Tesco surged to fresh highs, before entering a period of mean reversion. Prices pulled back within a broad descending channel as they consolidated around the 50SMA, offering a classic technical setup that hinted at a potential resurgence.
That resurgence materialised last week following a report from the Competition and Markets Authority (CMA) confirming that supermarket loyalty schemes, including Tesco’s Clubcard Prices, offer genuine savings for consumers. The CMA’s review of 50,000 grocery products revealed average savings of 17-25% for loyalty scheme members, dispelling scepticism about misleading promotions. This endorsement not only reassures shoppers but strengthens Tesco's position as a leader in customer value. With 70% of UK households using Tesco's Clubcard, this affirmation solidifies its competitive edge during the critical holiday shopping period.
The breakout from the descending channel has realigned short-term momentum with Tesco's broader uptrend. With the festive season approaching, Tesco appears well-positioned to capitalise on increased consumer spending. If current trends hold, the shares could retest September highs and potentially aim for fresh peaks, making this a stock to watch through year-end.
Tesco (TSCO) Daily Candle Chart
Past performance is not a reliable indicator of future results
Disclaimer: This is for information and learning purposes only. The information provided does not constitute investment advice nor take into account the individual financial circumstances or objectives of any investor. Any information that may be provided relating to past performance is not a reliable indicator of future results or performance. Social media channels are not relevant for UK residents.
Spread bets and CFDs are complex instruments and come with a high risk of losing money rapidly due to leverage. 82.67% of retail investor accounts lose money when trading spread bets and CFDs with this provider. You should consider whether you understand how spread bets and CFDs work and whether you can afford to take the high risk of losing your money.
When is a stock too high to buy? (Example: IHG)How do you know when you’ve missed the boat?
A stock has already gone up a tonne, so bascally you are too late!
Sometimes, you just have to let go, right?
Sometimes yes, but not always - let’s look at an example.
International Hotels Group (IHG)
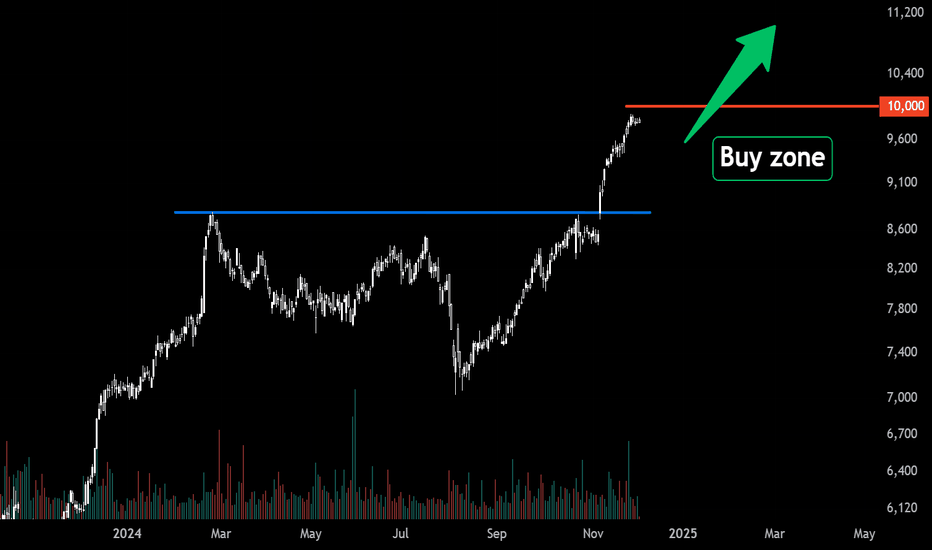
Back in 2020, LSE:IHG IHG shares were trading down at ~2000 GBX, now they are a hairs breadth from 10,000 - that’s 5X in about 4 years. Not bad.
Can you really even think about buying shares at 10,000 that were 2,000 only 4 years ago. 🤔
We’re saying YES.. if you follow some guidelines.
Clearly this is not a value investment - this is a momentum trade.
To be buying IHG shares up here, one is basically arguing that the price at new highs indicates and buyers are in charge and the price is going to keep going up for the time being.
This helps define the trade risk very well.
If the trade is that IHG has broken out over the previous peak at ~8,800. We don’t want to be owning shares below this level - if they’re back below 8,800 the momentum has stalled and we need to be out.
To put it another way, we are not buying just under 10,000 and willing to hold the shares all the way back down to 2,000 again - no. We want to ride the momentum up - not down !
From here there’s a pretty good chance that momentum takes the price up to the 10,000 level. As a big round number, there is also a good chance that profit taking takes place here too.
That creates our buy zone between 8,800 and the current market price (9,750).
So what might a trading strategy look like to capture this situation?
The following is a way to have:
An intial risk of £1000 to test the waters
A total risk £3000 if/when the trade starts working
A 2X profit potential (with the opportunity to capture more)
Spread Betting Strategy: Target £6000+ Profit with £1000 Initial Risk
Entry Points and Stops
9000 GBX Entry:
Stop Loss: 8600 GBX.
Bet Size: £2.50 per point.
Risk: £1000.
9200 GBX Entry:
Stop Loss: 8800 GBX.
Bet Size: £2.50 per point.
Risk: £1000.
9400 GBX Entry:
Stop Loss: Trailing 400 points.
Bet Size: £2.50 per point.
Initial Risk: £1000.
Profit Targets
First Position (9000):
Gain: 1000 points.
Profit: £2500.
Second Position (9200):
Gain: 800 points.
Profit: £2000.
Third Position (9400):
Trailing Stop Profit Example:
10,400 GBX: Profit = £2500.
11,000 GBX: Profit = £4000 or more.
Summary
Total Risk: £3000.
Fixed Profit (First Two Positions): £4500.
Potential Profit (Third Position): Variable, based on trailing stop.
Reward-to-Risk Ratio: 2:1 or higher, depending on trend continuation.  Education
 Long
Long
 Long
Long
 Long
Long
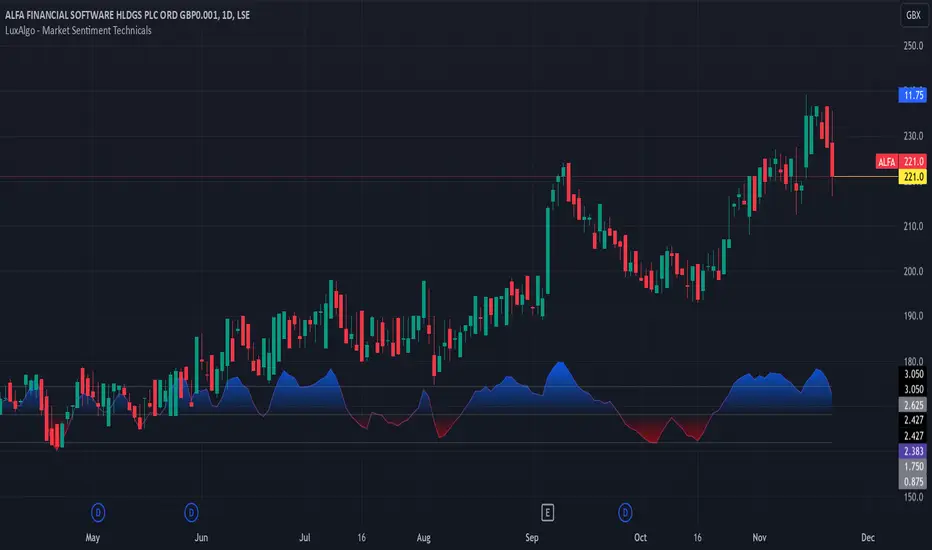
I'm 🇬🇧 for the night - LONG ALFA @ 221.0It would seem, from a short backtest, that my algo works across the pond as well. In the last 12 months, it generated 26 buy signals on LSE:ALFA , traded in London. Using my FPC exit, all 26 trades would have been profitable. And LSE:ALFA is very British polite, too. The average holding period was only 2.96 days but 16 of the 26 trades closed in 1 day, just the way you want them to. A couple of hooligan-ish trades ruined that average for everyone else. Isn't that always the case? The average gain per lot traded was 2.03% which is a .67% return per day.
Again, that doesn't seem like much, but LSE:ALFA is part of the FTSE 250, and that index's average ANNUAL return (dividends not included) over the last 28 years was 5.38%. That's .02% per day, so these results are over 33x better than an average day on the FTSE 250. In fact, one trade beat the average annual gain of this index all by itself, and another almost did.
So here goes. 221 pounds on LSE:ALFA and let's see what happens.  Long
Long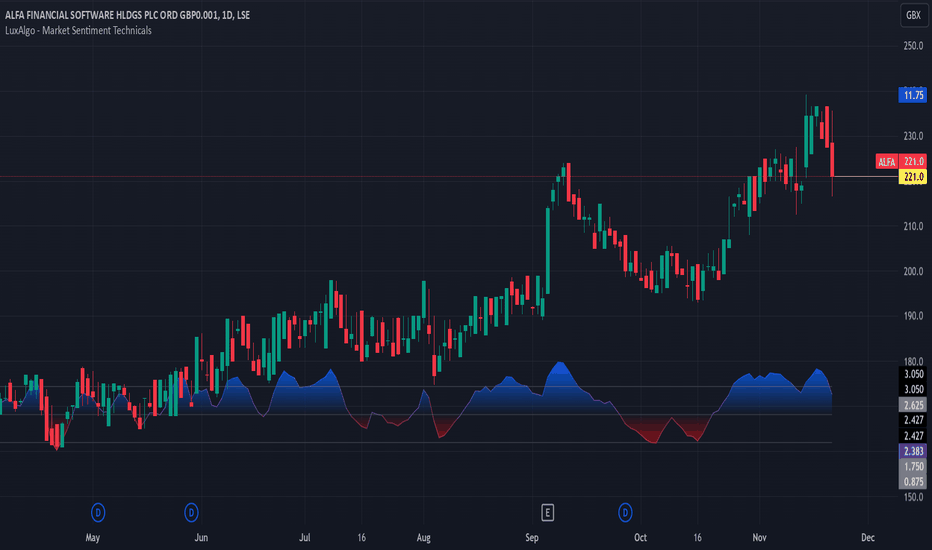
 Long
Long
 Long
Long
 Short
Short
 Long
Long
 Long
Long
 Long
Long
Stock Selection: How to Tip the Tailwinds in Your Favour Stock selection is a game of fine margins but understanding a few key factors can tilt the probability of success in your favour. By focusing on these crucial elements, you can ensure that when it comes to buying stocks, you’re sailing with the prevailing tailwinds rather than fighting against them.
1. Don’t Fight the Market
Ever heard the saying, “a rising tide lifts all ships”? This holds true in the stock market. Favourable market conditions can make an average investor look like Warren Buffett. When the market is stable, it allows other factors to shine, while a risk-averse environment can dampen even the best stock’s performance.
Don’t overthink this concept—use simple moving averages, such as the 50-day and 200-day, when analysing the index. Pair this with basic structure analysis to assess overall market conditions. Ask yourself: What is the long-term trend in the index? What is the current momentum? What does the price structure look like? The better the market conditions, the more aggressive you can be in your stock selection, as the broad tailwinds are stronger.
Example: FTSE 100
The FTSE 100 index has been navigating a choppy sideways range since May, but there are still signs of optimism beneath the surface. While we’re not in a full-blown bull market, the 50-day moving average (50MA) remains comfortably above the 200-day moving average (200MA), and both are sloping upwards—indicating a long-term uptrend. Prices are currently hovering near the 50MA, suggesting the market’s tailwinds remain mildly favorable, even amidst some volatility.
FTSE 100 Daily Candle Chart
Past performance is not a reliable indicator of future results
2. Earnings Catalysts: The Power of Post-Earnings Drift
Positive earnings surprises can work wonders for any stock. They often create price gaps that signal strong short-term momentum. Moreover, positive earnings surprises can take time to be fully ‘priced in’ because large institutional investors typically stagger their investments over time. This phenomenon, known as post-earnings announcement drift, can lead to continued price appreciation following an earnings beat.
Look for stocks that have recent positive fundamental catalysts in their price history. This focus can give you a clearer path toward potential gains.
Example: Barclays (BARC)
In February, Barclays revealed a strategic plan that reignited investor confidence and sparked a sharp breakout in its share price. The bank announced a £10 billion buyback program, coupled with £2 billion in cost cuts, aiming to boost profitability and efficiency. Barclays also set its sights on delivering returns in excess of 12% by 2026, with a renewed focus on its higher-margin UK consumer and business lending divisions. This announcement acted as a major earnings catalyst, forming the foundation for a strong uptrend that followed.
BARC Daily Candle Chart
Past performance is not a reliable indicator of future results
3. The Buyback Bounce: Share Buybacks
Companies that initiate share buybacks signal confidence in their stock and a commitment to returning value to shareholders. When a company buys back its shares, it reduces the total number of outstanding shares, often resulting in an increase in earnings per share (EPS) and potentially boosting the stock price.
While this isn’t an exact science, a stock undergoing a share buyback that meets the other criteria on this list can provide a solid tailwind for your investment.
Example: Mastercard Incorporated (MA.)
In the second quarter of 2024, Mastercard repurchased approximately 5.8 million shares for $2.6 billion. Through the first half of 2024, the company bought back 10.2 million shares at a total cost of $4.6 billion. As of July 26, 2024, MA had repurchased an additional 1.9 million shares for $820 million, leaving $8.7 billion remaining under its approved share repurchase programs. These strategic buybacks not only reflect Mastercard's strong cash generation capabilities but also underline its commitment to enhancing shareholder value, making it an attractive consideration for investors seeking growth.
MA. Daily Candle Chart
Past performance is not a reliable indicator of future results
4. Focus on Financial Quality
When hunting for stocks, there’s often a tendency to bargain hunt, looking for those poised for a bounce. However, we believe that, over the long term, high-quality companies are best positioned to outperform the market. You don’t have to be a Wall Street analyst to develop a robust quality filter. The following financial metrics can help ensure that the stock you’re buying is solid and less likely to face dilution:
• Return on Equity (ROE): Most companies will claim they are high-quality businesses that prioritize investors, but checking this metric helps verify their claims. A high ROE of 15% or more indicates efficient use of equity and a commitment to shareholder value.
• Free Cash Flow (FCF): Cash is king for a good reason. Strong free cash flow means the company generates ample cash after covering its operational expenses, allowing for reinvestment or returns to shareholders. A FCF yield of 5% or higher is typically desirable.
• Debt-to-Equity Ratio: While balance sheet strength may sound boring, it’s crucial. A low debt-to-equity ratio, ideally below 1.0, suggests a company is not overly reliant on debt to fuel growth, making it less vulnerable in downturns.
Example: Morgan Sindall (MGNS)
With a Return on Equity (ROE) of 22.7%, Morgan Sindall significantly exceeds the 15% benchmark, showcasing effective management and strong profitability. Its Free Cash Flow yield is an impressive 10.81%, well above the desirable 5%, reflecting robust cash generation capabilities. Furthermore, the company boasts a negative Debt-to-Equity ratio of -0.49, highlighting a strong balance sheet with no net debt and low financial risk. These qualities are also evident in its strong price chart (see below).
MGNS Daily Candle Chart
Past performance is not a reliable indicator of future results
5. Long-Term Trend Structure
Just as analysing the strength of the overall market can create headwinds and tailwinds, you should also be mindful of a stock's price history and calibrate your expectations accordingly. An old adage that has stood the test of time is, “trends take considerable time and effort to change.” This doesn’t mean you should buy stocks that have undergone prolonged underperformance, but it does mean you should be cautious and aware of a stock’s long-term trend when making decisions.
Example: Marathon (MARA Holdings)
A quick look at Marathon’s daily chart shows prices oscillating around the 200-day moving average, indicating a period of indecision. The trend lacks clear direction, with momentum appearing tepid at best. Given the uncertainty, investors should be cautious about taking trend continuation or momentum trades here until a clearer signal emerges.
MAR Daily Candle Chart
Past performance is not a reliable indicator of future results
Conclusion
When it comes to stock selection, leveraging favourable market conditions, earnings catalysts, share buybacks, financial quality, and trend structures can enhance your investment strategy. By aligning your selections with these key factors, you can tip the tailwinds in your favour and increase your chances of success in the ever-evolving stock market.
Disclaimer: This is for information and learning purposes only. The information provided does not constitute investment advice nor take into account the individual financial circumstances or objectives of any investor. Any information that may be provided relating to past performance is not a reliable indicator of future results or performance. Social media channels are not relevant for UK residents.
Spread bets and CFDs are complex instruments and come with a high risk of losing money rapidly due to leverage. 82.67% of retail investor accounts lose money when trading spread bets and CFDs with this provider. You should consider whether you understand how spread bets and CFDs work and whether you can afford to take the high risk of losing your money.
 Education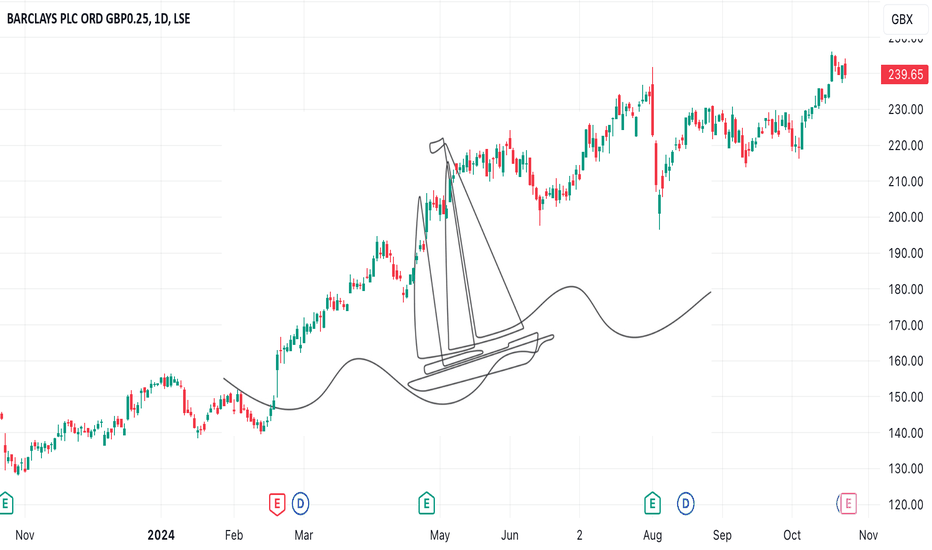
 Short
Short
Short 
Long 
 Long
Long