$CREO ready for a breakout into the volume gap?Like the potential here with $CREO. Price has broken past previous resistance around 12.5p on a volume spike that sits comfortably above the average. Effort and result are in agreement.
The volume profile since the last high shows a clear cluster of activity between 10.5p and 13p. This looks like classic accumulation. The lull in volume between 13p and 16p is what catches my eye; it could act like a vacuum. Thin volume often means thin supply, and with enough sustained effort, the price could smash through it quickly.
Price target: 18p
Potential reward: 38%
Mobico Monthly RSI DivThis is another stock that I have absolutely no idea about fundamentals-wise. I literally just saw someone on X post the top 20 FTSE gainers today, saw this listed and spotted this monster div on the monthly.
The stock's been bleeding out hard since the 2020 covid crash, but volume has been picking up notably around this divergence. Not sure what will happen from here, but thought I'd share the idea and revisit this one later on to see how it's done.
DYOR, NFA
KNOS could this bullish engulfing lead us to 1180p?KNOS looks about a week ahead of LSL. A clear double bottom has formed around 700p, providing a solid base for the current move. The price has already punched through overhead resistance at 800p with a visible increase in volume, effort and result are in total agreement.
Friday’s price action was a classic bullish engulfing pattern, closing near the daily high. These signals are high-conviction for me, as they show buyers have completely overwhelmed the previous day’s supply.
We could encounter some resistance around 920p, but if it pushes through that, a return to the recent highs would offer an attractive gain.
Price target: 1180p
Potential reward: 34%
$LSL - Is effort and result finally in agreement here?Very strong bullish candle here. Price action closed at the dead high on Friday, showing buyers were in total control. Volume confirms the move, passing through 3.2x the average. Effort and result are in agreement.
Zoom out and the volume profile since the decline shows a significant weight of trades around 220p. Someone is clearly finding value at this level.
The footprint of the strong hands is hard to ignore. One to watch.
Price target: 260p
Potential reward: 14.54%
Will the STX rounded bottom breakout lead to a 29% reward?I’ve covered this one a couple of times now and it keeps delivering.
The rounded bottom I flagged previously played out nicely, with a clean confirmation breakout on the 1st April. Friday then added another strong bullish candle on very strong volume, clearing the overhead resistance and holding above it. The buyers are in control here.
There is a small rejection wick at the top, but that’s completely normal. Profit takers getting nervous after a sharp move is to be expected and doesn’t concern me.
What matters is that the price moved above the previous highs and stayed there. That is a healthy sign.
A push up to 12.2p from here still offers an attractive short term trade.
Price target: 12.2p
Potential reward: 29%
$UFO , SETUP ENTRY : CMP
TP1 : 24.85
TP2 : 36.50
TP3 : 57.30
SL : If you wish
My SL is never a SELL, just an alarm to stop adding money and wait for better dca
Follow, Boost, Thank You !
⚠️ Financial Disclaimer:
This post is not financial advice. I am not your financial advisor, your life coach, or your legally responsible adult.
Always do your own research and never trade based solely on internet comedy.
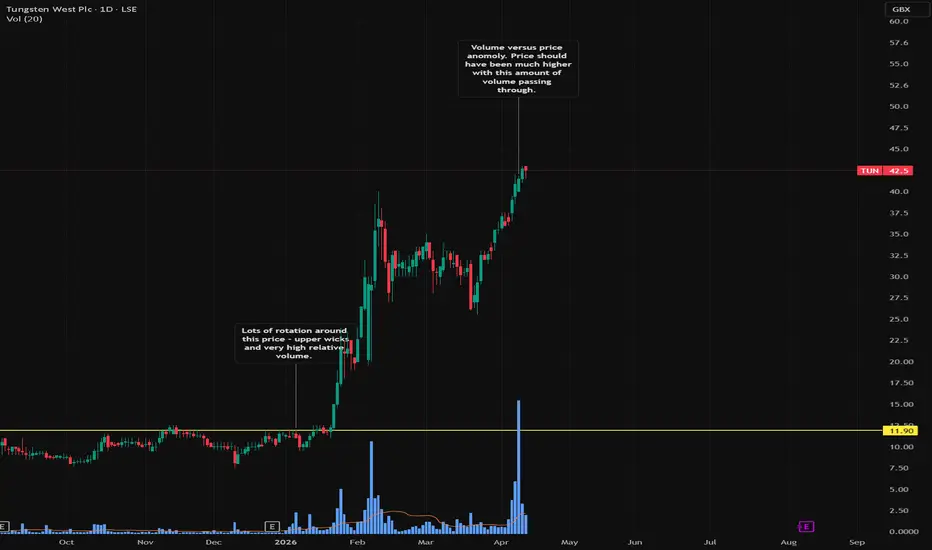
Is the huge volume spike on TUN a sign of distribution?Anyone who traded this out of the bowl at 11p has done very well. A remarkable move.
But that enormous volume spike on Friday is what really caught my eye. 7.2 times the average, with a trading value of around £15m passing through. That is not normal activity for a stock of this size.
Here’s the question. With that amount of volume behind it, why didn’t the price make a new high? It should have. The effort was there but the result wasn’t. That is a classic price and volume anomaly, and in Wyckoff terms it points to one thing, someone is using all of that buying activity as an opportunity to quietly unload a very large position into the crowd.
Don’t fight the crowd, they say. True. But when someone leaves a footprint that size at a resistance level, it’s hard to look the other way.
I wouldn’t be opening a position here just yet. A pullback towards 28p-30p wouldn’t surprise me at all, and that might be the more sensible entry if the story still stacks up then.
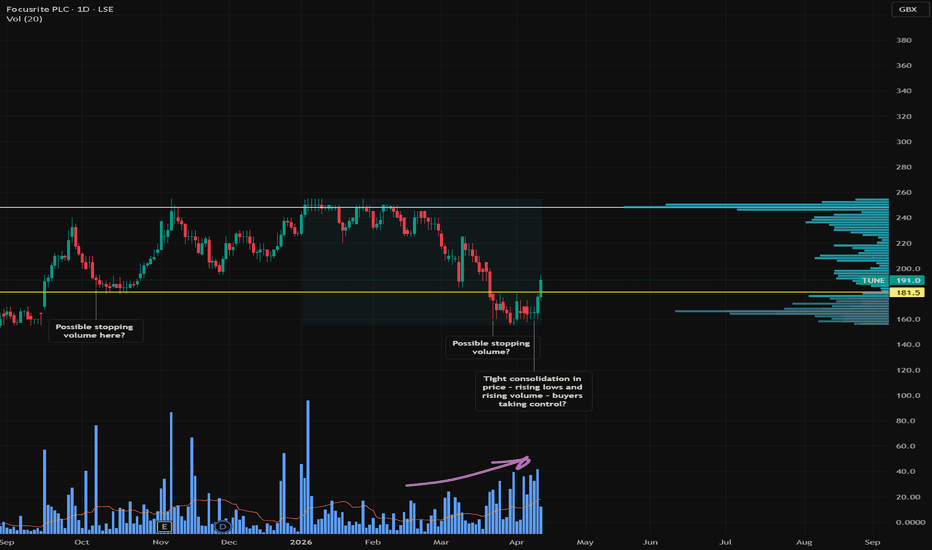
Can TUNE break 181p for a 48% move through the volume gap.Another potential recovery play that has been quietly building a case over the last couple of weeks.
The price spreads have been getting tighter and tighter, and volume has been consistently running at around twice the average throughout. That is a significant amount of buying activity required just to hold the price steady. Classic stopping volume behaviour, the buyers are absorbing everything the sellers throw at them.
The rising lows building underneath adds another layer of confidence.
The volume profile backs up the thesis nicely too. Volume drops off sharply between 165p and 245p, which means thin resistance for the price to trade through if the buyers do take control.
A break above 181p with conviction would be the trigger for me
Price target: 245p
Potential reward: 48.35%
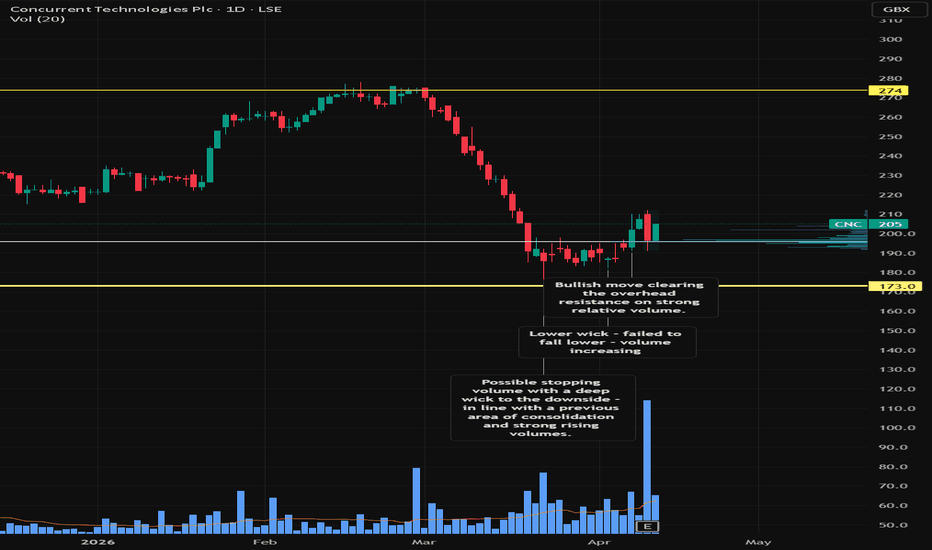
Will the 200p breakout for CNC move through the volume gap?A lovely setup that has been building nicely over the last few weeks.
After a long and painful fall, the price has been consolidating sideways and last week delivered exactly what we were looking for. A strong bullish candle clearing the 200p overhead resistance on very strong relative volume. The price has held above that level into Friday too, which is encouraging.
The volume profile on the right tells an interesting story. There is a notable drop off in volume traded between 208p and 260p. Thin volume areas act like thin resistance, once the price enters that zone there is very little to slow it down.
Coincidentally earnings are due on Monday. That could be exactly the catalyst needed to punch through that gap. Lets see what happens.
Price target: 270p
Potential Reward: 30.16%
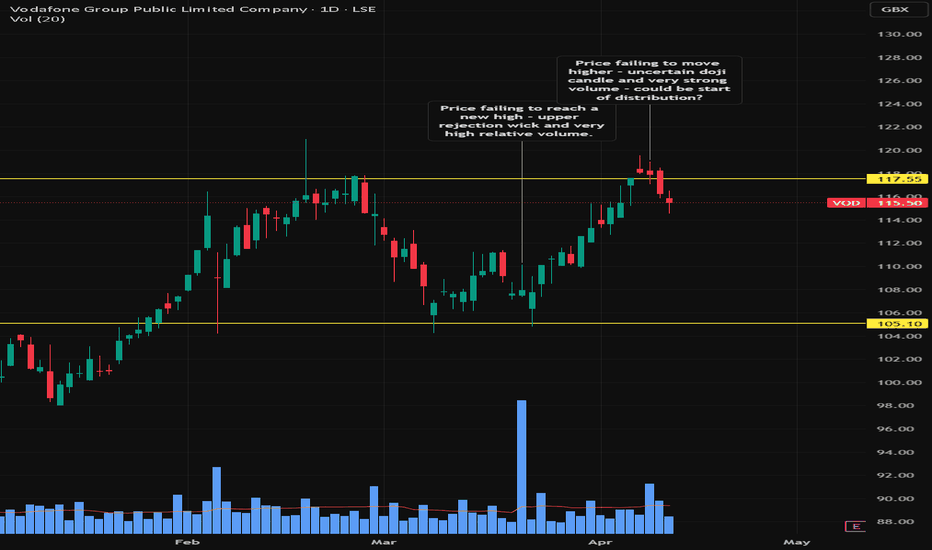
Distribution or Pause? High-Volume Resistance at 117pLooking a little toppy here after a strong run up from the lows earlier in the year.
The price is now approaching a previous area of resistance around 117p and Friday’s session raised a flag. A classic doji candle, which is about as indecisive as it gets, with an upper rejection wick that failed to make a new high. Volume behind that move was twice the average. Big effort, no result. That is the kind of footprint that suggests someone could be using this level to quietly unload a large position.
Could be the start of distribution. Could be a pause before another leg up. But the weight of evidence at this level leans cautious for me.
One to watch closely next week.
Price target: 106p
Potential reward: 10.1%
BP Trading Update Puts Numbers Behind War TailwindWe all knew the conflict in Iran would be a tailwind for London’s oil majors, but until this morning’s trading update from BP, we didn’t know quite how strong that tailwind had become.
Trading Strength Comes Through Clearly
The numbers begin to put substance behind the narrative. Brent crude averaged $81.13 per barrel in the first quarter, up from $63.73 in the prior quarter, while US natural gas prices also moved higher. BP’s own sensitivity guide suggests that every $1 move in oil prices can translate into around $340 million of pre-tax operating profit over a full year, which puts the recent move in crude into perspective.
That environment has fed directly into performance. BP expects its oil trading division to deliver an exceptional result for the quarter, a sharp improvement from the weakness seen at the end of last year. At the same time, refining margins have moved higher, with the refining indicator margin rising to $16.9 per barrel from $15.2, reflecting stronger realised pricing across the system.
There are trade-offs. Net debt is expected to increase into a $25 to $27 billion range, driven by a working capital build of between $4 and $7 billion as BP positions itself within a more volatile pricing environment. The takeaway is clear though. The tailwind is real and now quantified, but with the shares already moving higher into the update, the focus shifts to whether this is new information or confirmation of what price has already priced in.
Momentum Pauses as Price Tests Long-Term Highs
The momentum behind BP’s strong start to the year accelerated as the conflict began, but as price has pushed into long-term areas of resistance around the February 2023 and October 2018 highs, that momentum has started to stall.
Recent price action suggests a shift in behaviour rather than a change in trend. The strong directional move has given way to tighter price action, with swings becoming smaller and upside follow-through less consistent. This is often how markets behave when they reach significant levels after a sustained move, particularly when a large portion of the good news is already reflected in positioning.
From here, a period of consolidation near the highs looks the more likely outcome. The early signs of a triangle or wedge-type structure are beginning to form, which would allow the market time to reset before the next directional move. Periods like this are a normal part of strong trends, but they do require patience, with the next move likely to be driven by how price resolves this compression rather than the initial reaction to the news itself.
BP. Daily Candle Chart
Past performance is not a reliable indicator of future results
Disclaimer: This is for information and learning purposes only. The information provided does not constitute investment advice nor take into account the individual financial circumstances or objectives of any investor. Any information that may be provided relating to past performance is not a reliable indicator of future results or performance. Social media channels are not relevant for UK residents.
Spread bets and CFDs are complex instruments and come with a high risk of losing money rapidly due to leverage. 81.31% of retail investor accounts lose money when trading spread bets and CFDs with this provider. You should consider whether you understand how spread bets and CFDs work and whether you can afford to take the high risk of losing your money.
NEO HIGH RISK HIGH REWARDS!As of early 2026, the company is at a critical juncture in its transition from an explorer to a uranium producer.
trategy is focused on two primary South African assets:
Henkries Uranium Project: This remains the primary focus for near-term cash flow. Neo Energy aims to leverage the US$30 million in historical exploration to bring this low-cost, shallow mine into production rapidly.
New Beisa Mine (Beatrix 4 Shaft): In March 2026, the company commenced a three-phase development plan.
Phase 1 (Current): A 6–9 month implementation assessment to finalize capital costs and mining plans.
Operational Goal: The company is currently targeting the second half of 2027 for the Beisa Mine to be fully operational.
Share Suspensions: Trading was suspended in early 2026 due to delays in publishing the FY2025 annual report. While the company has since worked to restore its reporting timetable, these delays have caused sharp fluctuations in share price (dropping roughly 45% in early 2026).Funding: Neo recently secured up to £8 million in funding commitments from a London-based private equity fund, which is vital for meeting its 2026 development milestones at Henkries and Beisa
Portfolio Scale: The company now holds SAMREC-compliant resources of approximately 117 million lbs of $U_3O_8$ and over 5 million ounces of gold.Strike Length: Conditional agreements for Henkries South could extend their project strike length to 46km, significantly increasing the long-term life-of-mine potential.
Note: Investors should keep a close eye on the Section 11 and Section 102 approvals from the South African Department of Mineral Resources, which are expected by mid-2026. These are the "keys to the castle" for the Beisa Mine acquisition.
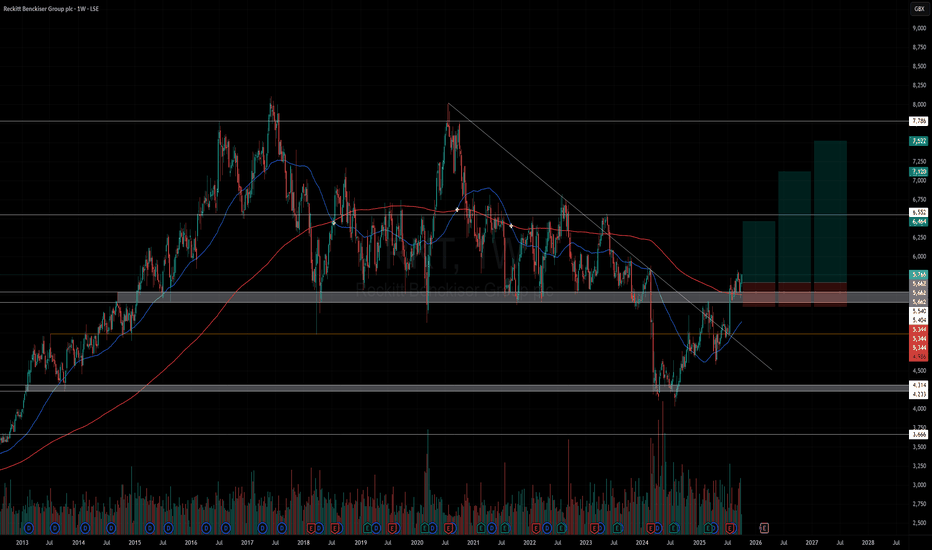
RKT on LSE - LongRKT on LSE - Long
Momentum trade
Price has broken out of trend line and reclaimed significant support level.
Price sitting on weekly 200ma.
Enter as close to entry price or support level.
TP1 - exit 35% position - Top of range & .618 Fib
TP2 - exit 35% position - .786 Fib
TP1 - exit 30% position - .886 Fib
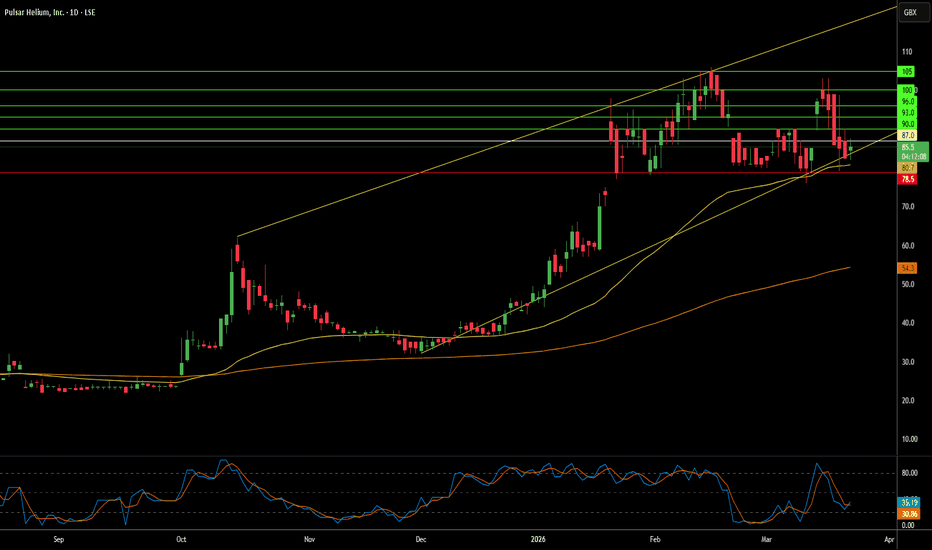
Is the Most Valuable Gas on Earth Hidden in Minnesota?While the world watches the 2026 helium crisis unfold in real time — a third of global supply gone overnight after Iranian strikes on Qatar's Ras Laffan facility and a Strait of Hormuz blockade that collapsed maritime traffic by 97% a small Canadian-listed explorer called Pulsar Helium has been quietly drilling into what may be the most strategically significant gas deposit on the planet. Their Topaz Project in Minnesota is the second-highest-grade helium project on Earth, with flow tests recording an 8.1% helium concentration more than 27 times the commercial viability threshold and a 100% drilling success rate across seven appraisal wells.
What elevates Topaz from a compelling helium story to a national security asset is the confirmed presence of Helium-3. Valued at approximately $18.7 million per kilogram, roughly 250 times the price of gold, Helium-3 is the only substance capable of cooling quantum computers to near-absolute zero operating temperatures, and a critical material for neutron detection systems and nuclear fusion research. Until now, virtually all supplies have come from decommissioned nuclear warheads. Two independent U.S. federal laboratories, the USGS and Lawrence Livermore National Laboratory, verified concentrations at Topaz of up to 14.5 parts per billion among the highest terrestrial levels ever recorded, prompting the U.S. government to designate domestic Helium-3 production a "national imperative."
The federal response has been swift and substantial. President Trump launched Project Vault to establish a domestic strategic helium reserve, backed by a $10 billion loan from EXIM Bank. The Department of Energy committed $500 million to domestic critical material processing, with priority given to projects reducing foreign supply dependence. Pulsar's profile is a primary deposit with no hydrocarbon dependency, located in a geopolitically safe jurisdiction, with zero exposure to Middle Eastern logistics positions; it is an almost textbook fit for this policy framework. The company is actively engaging U.S. government stakeholders on the Helium-3 discovery specifically.
Against this backdrop, the financial picture is striking. Pulsar's market capitalization stands at approximately $193 million, while analyst price targets average near $58 per share, compared with a current price of $1.13. A resource update is expected in summer 2026, followed by an economic feasibility study in the second half of the year. For investors, policymakers, and anyone tracking the intersection of geopolitics and advanced technology, the full analysis, including drilling data, valuation models, Helium-3 market forecasts through 2035, and complete sourcing, represents a thesis that the 2026 crisis has made impossible to ignore.
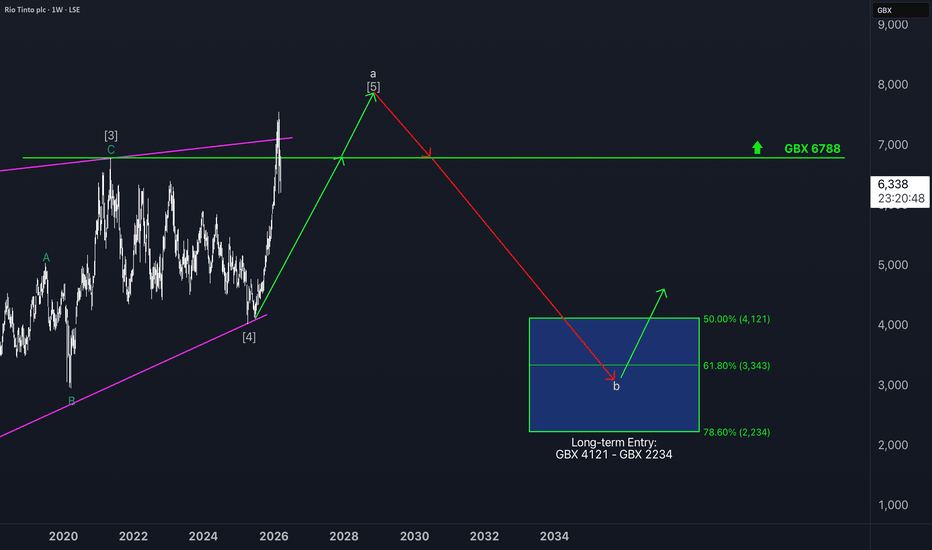
Rio Tinto Swings HigherWhat’s Changed?
Last Friday, Rio Tinto shares came under renewed selling pressure, slipping below the GBX 6600 mark. However, since the start of the new trading week, the copper producer has managed to recover and is now trading just above resistance at GBX 6788.
Primary Scenario
In theory, the high of this strong upward move could already be in place. According to our primary scenario, though, we’re allowing for a bit more upside. After that, we expect renewed downward pressure into our Long-Term Entry Range (GBX 4121–GBX 2234).
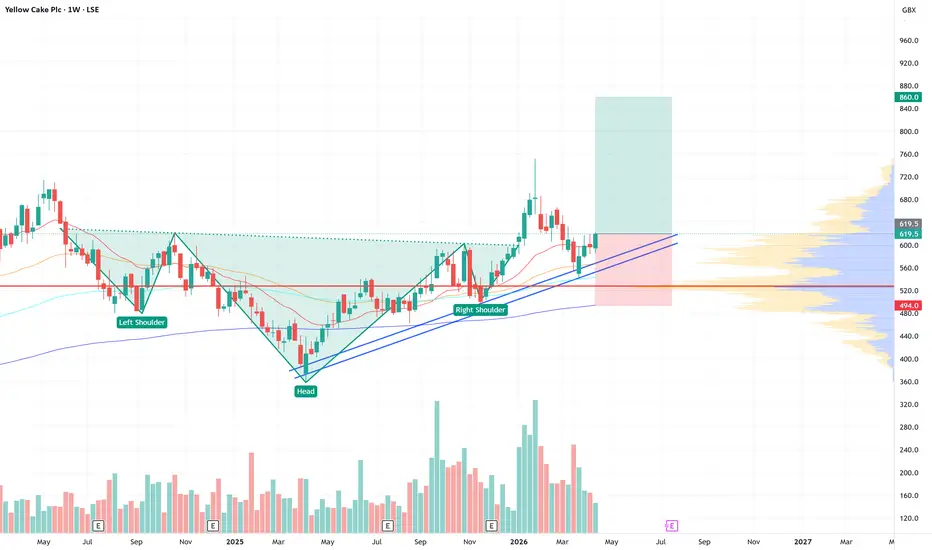
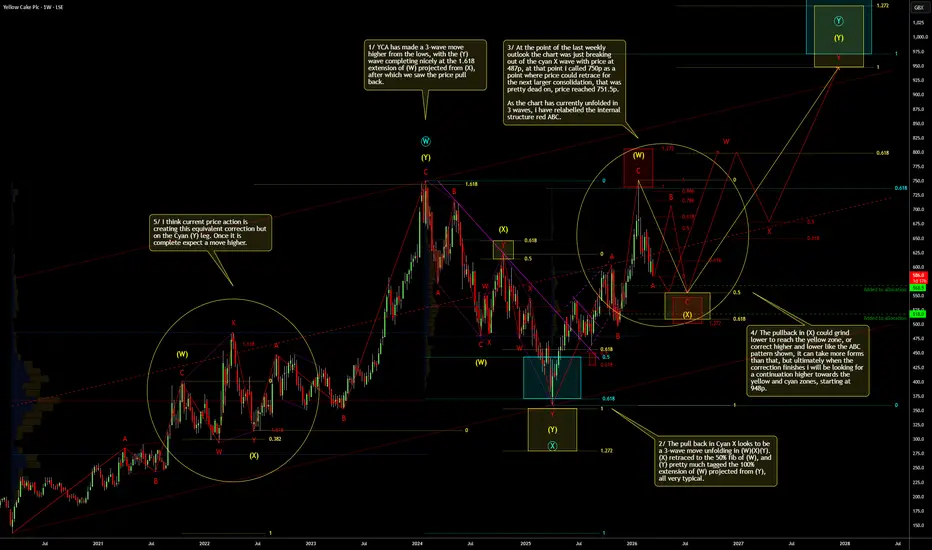
Weekly Outlook On YCA Yellow Cake PLC (Count 3)Here is the updated Weekly outlook on LSE:YCA .
At the point of the last weekly outlook the chart was just breaking out of the cyan X wave with price at 487p, at that point i called 750p as a point where price could retrace for the next larger consolidation, that was pretty dead on, price reached 751.5p.
The pullback in (X) could grind lower to reach the yellow zone, or correct higher and lower like the ABC pattern shown, it can take more forms than that, but ultimately when the correction finishes i will be looking for a continuation higher towards the yellow and cyan zones, starting at 948p.
Note: i create my outlooks with the browser tabs hidden (F11) so if they look squashed, that is why.
If you appreciate my analysis, i'd appreciate a like and follow.
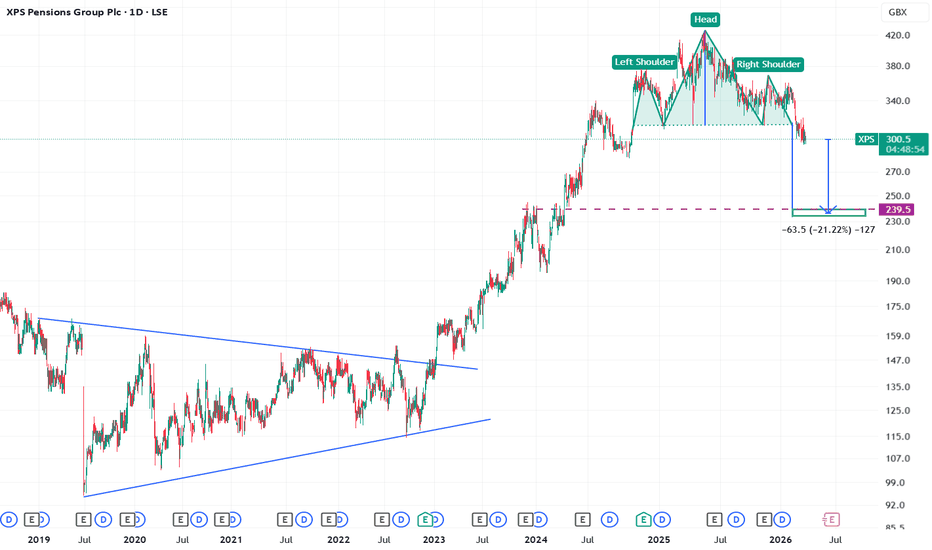
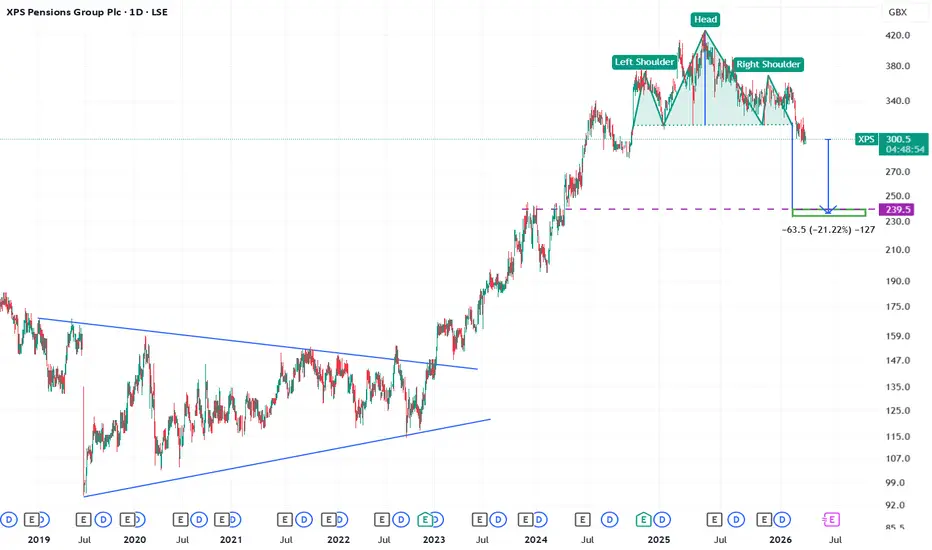
XPS to move lower - Head & Shoulders - bearish Bearish
Here are the main reasons XPS Pensions Group (LSE: XPS) could move lower, ranked most important first:
High valuation relative to earnings – The stock trades on a relatively high P/E multiple (around mid-20s) compared with many UK companies, so if growth expectations weaken the share price can fall.
Slower expected earnings growth – Forecast growth for the company is relatively modest compared with the wider market, which can reduce investor enthusiasm.
Profit decline despite revenue growth – In recent results, profit before tax fell even though revenue increased, suggesting margin pressure and operational costs rising.
Dependence on the UK pensions industry – The company’s revenues rely heavily on UK pension schemes; regulatory changes or reduced demand for consulting services could impact growth.
Insider selling – Company insiders have sold shares recently, which can sometimes reduce investor confidence.
Dividend sustainability concerns – The company’s dividend payout ratio has been reported at around 100%, which may raise questions about long-term sustainability.
General UK market sentiment – Smaller UK financial and consulting firms can fall when the broader UK market or financial sector weakens.
✅ Simple takeaway:
XPS could decline mainly because investors think the stock is relatively expensive compared with its growth prospects, especially if profits or sector demand slow.