• Products
  • Community
  • Markets
  • Brokers
  • More
Get started
  • Markets
  • /United Kingdom
  • /Stocks
  • /Ideas
Rotork stopping volume?observing a surge in trading volume alongside a minor upward price movement (small up candle) subsequent to a notable price decline suggests the potential emergence of a substantial support level at this juncture.
LSE:RORLong
by Stockso_Simple
SAVILLS UK HOUSING MARKET IS MAKING A MASSIVE RISING WEDGEHello Traders, Big rising wedge formation on Savills here with price on the top trend line of the wedge in overbought conditions with bear div on the RSI, it looks like a throw over. Is the UK housing market in a bubble or will the price break the top of the wedge into uncharted territory? Notice the bounce on the 24 year long trendline, I thought that was interesting anyway. Im bearish here based on the chart, but also realise price could break above the wedge. What are your thoughts?
LSE:SVS
by WickHunter
Updated
1
Rio Tinto: A Mid- to Long-Term InvestmentRio Tinto Rio Tinto is a British-Australian multinational mining and metals company headquartered in London, England. It is one of the world's largest mining companies, with operations in over 30 countries. Rio Tinto's primary products are iron ore, copper, aluminium, diamonds, and uranium. The company's market capitalization is approximately $100 billion. Rio Tinto is listed on the London Stock Exchange and the Australian Securities Exchange. Current and Future Projects Rio Tinto has a number
LSE:RIOLong
by TheTrade_Academ
2
BT.A - BT GROUP PLC - LONGThis is an analysis of BT GROUP PLC - a British telecom company, the following is strictly my own personal opinion and does not constitute financial advice. Key numbers: Dividend yield TTM - 6.47% P/B - 0.81 P/E - 5.56 (currently) Market cap 11 817 MGBP (11.8BGBP) Analyst estimates: Analyst estimate average for BT.A is 188.5 GBX which is equivalent to a 65.42% increase from todays price. Key information: CEO has been replaced with Telias ex-CEO Alison Kirkby, she claims to have the same visio
LSE:BT.ALong
by DonBboy
EZJ Hopeful Ping ZoneTrying to find a support level for EasyJet. Some signs of strength at 430 level.
LSE:EZJ
by benjo21
3
YCA - Yellow Cake breaks triangle Yellow Cake has broken its triangle formation which began in April 2022. There has been a retest at 398 although it is experiencing resistance at 448. The triangle formation in an uptrend is bullish. However, volume is low and, as a result, the breakout is weak. NOTE: This post if for education only and not a solicitation to buy, sell or hold. Do your own research and trade your own plan.
LSE:YCALong
by andmk2
Long for #BATS #BTIDiversion on RSI+ Monthly Support + Falling Wedge + W pattern
LSE:BATSLong
03:14
by dalvi21288
Airtel Africa #AAF.L Long positionA nice possible long position from support, at least for a 7.44@ gain and a Ratio of 1.06 Airtel Africa #AAF.L
LSE:AAFLong
by Betguardian
Updated
#BIRD #BBRDFBIRD - BLACKBIRD.LS FILLED FIRST GAP GAP AT 28P Share of the Decade. £37 taget. No advice
LSE:BIRDLong
by sideshowbull
#BIRD #BBRDF BIRD.LSE Not any other BIRD - BLACKBIRD PLC LONDON BLACKBIRD I am a buyer Breakout of falling wedge confirmed.
LSE:BIRDLong
by sideshowbull
Vistry on the moveBreaks above its weekly 50 ema and looks like there's more to come. Only thing is, volume could be higher.
LSE:VTYLong
by andmk2
Updated
MKS weekly time frame analysisMKS has created a higher low on the weekly time frame. It's a great confirmation of the uptrend after such a brutal long-term bear trend. Expecting 100 % move up on weekly so it will take some time but our target would be around 377 $. However it's not the best entry now as the stop loss would have to be placed below 90 $. So it's not a trading idea with a low risk and high reward setup. From another hand, if you believe in MKS bullish trend, it may be still a good investment for the next month
LSE:MKSLong
by vf_investment
2
Bullish Stocks Wolfe WaveStocks which are good for Bottom Picks as per Wolfe Wave Strategy.
LSE:BBOXLong
by YunusSayed
5 years for Sage to break out?It's taken 5 years for Sage to break out from 824 resistance. Good results today have seen the price initially increase by about 4%. Let's see if this is a true break or a bull trap as it was in Dec 2021. Looks bullish to me but do your own research and this is not a recommendation to trade.
LSE:SGELong
by andmk2
Updated
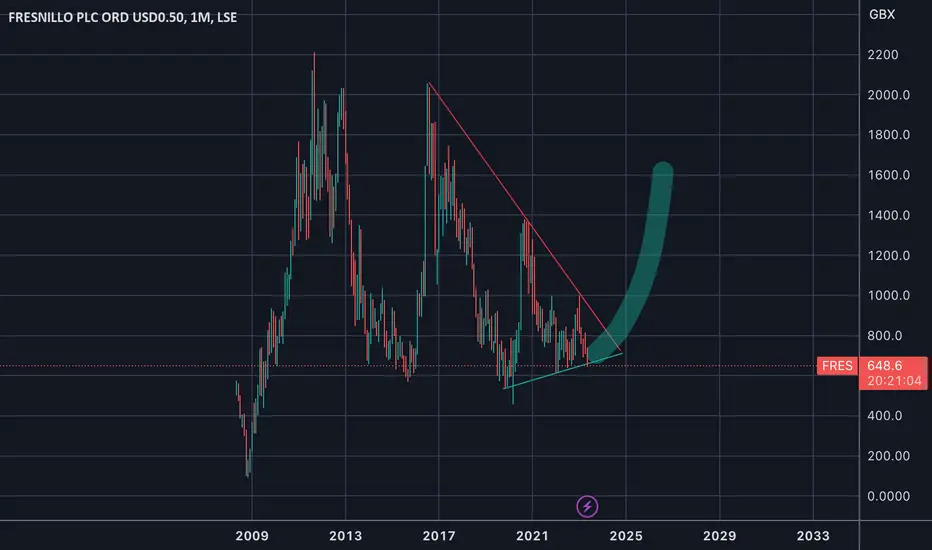
Fresnillo: Bearish Success 💪🐻The Fresnillo-bears can announce a first success: Finally, the share has arrived at the support at GBP 610! Next, our furry friends should push Fresnillo below this mark to gather further downward momentum. Then, the share should also pass the support at GBP 456.60 to develop wave C in turquoise. However, there still remains a 20% chance that Fresnillo could change direction and climb above the resistance at GBP 997. In that case, we would expect the share to place the new top of wave alt.B in t
LSE:FRES
by HKCM_Global
Anglo-American hmmmmmmmmOnly valid investing opportunity I can see is marked out as the 'Original Bullish OB.' However, this is a very high risk entry as the OB is not a significant OB but rather only caused a minor MSB.
LSE:AAL
by ahmad_ash123
$CMCXreclaim 180 and break downtrend not trading this having a look since they partnered with StrikeX with a 33% stake current market cap is 500 million down a fair bit rsi is unsure of which direction to take imo we go up lets see how it plays out . no clue about the FA except the fact they are headed in the right direction with above partnership .
LSE:CMCX
by CompoundingGain
#BIRD.LON #BLACKBIRDCLOUDChart is primed for a sling shot. No advice BWTFDIK
LSE:BIRD
by sideshowbull
$nwg natwest #nwg 1d candle time framedecent long term hold, that pays dividends. long term bullish for natwest, in a fallen wedge, that break to the upside 68% of the time, i could see a small pull back to 240, worse case would be a pullback to 206 happening before a major rally, nfa dyor
LSE:NWG
by TechnicallyBullish
$OTC:FNLP Key Support Line and Falling Wedge Pattern Introduction This concise analysis examines the silver chart, highlighting the significance of a key support line and the presence of a falling wedge pattern. These technical indicators provide insights into potential price movements and suggest a possible bullish outlook for silver. Key Line of Support The silver chart reveals a well-defined line of support that has held multiple times, demonstrating its significance. This support line acts as a price level where buying pressure tends to
LSE:FRESLong
by joepegler
CENTRICA ORD GBPCNA printing higher high and higher lows we can buy on 120.90 level with Taking profit level of 129.40 and 137.90
LSE:CNALong
by fahadidrees92
BOO Short Sell (Circa 7-8%)BOO Short Sell based on equilateral triangle pattern within levels of resistance. Breakout will favour bearish. TP 37.45 based on previous resistance levels.
BShort
by TomShakey
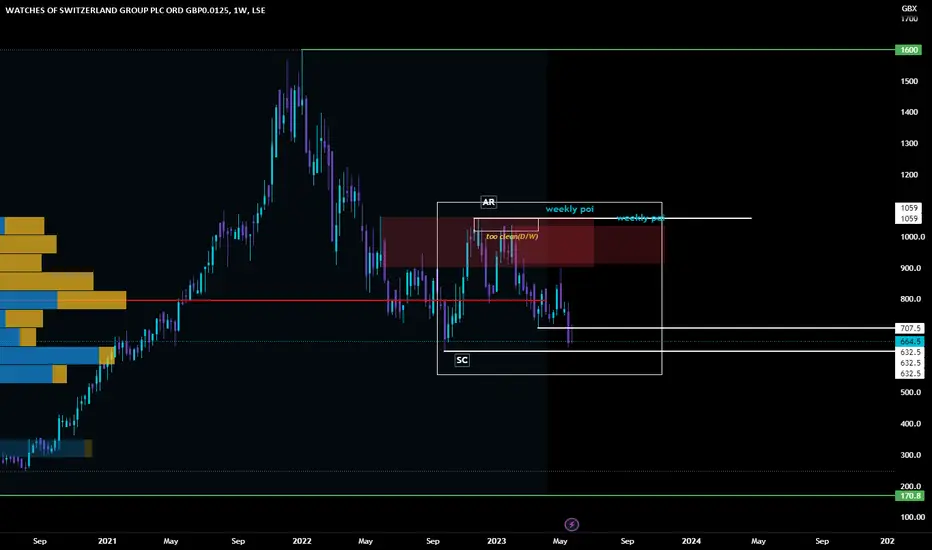
wyckoff WOSGpossibel wyckoff will be watching how this forms on weekly not financial advice
LSE:WOSG
by sayrylparra
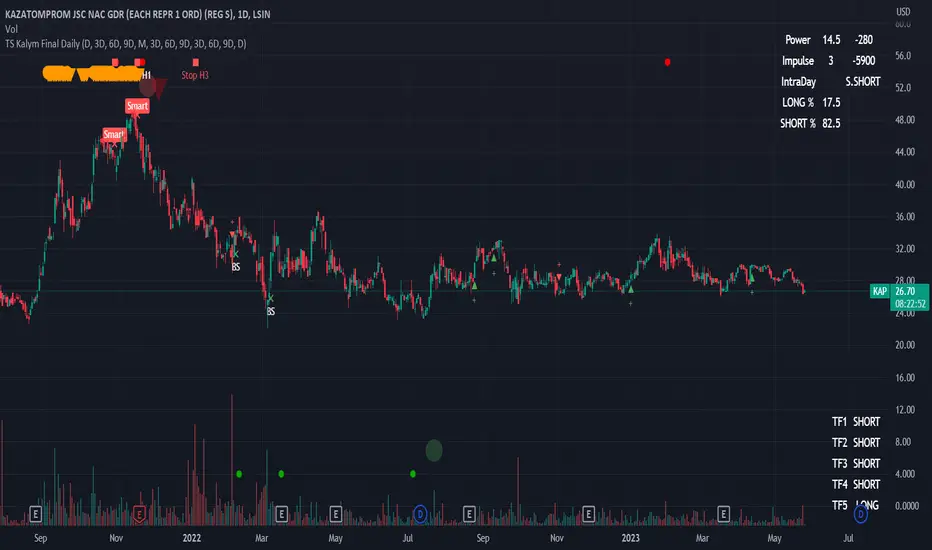
KAP - KazatompromBe carefully. The Budennovskoye was transferred free of charge to the Russian oligarch Anisimov. Oligarch Anisimov sold the Budennovskoye to the Russian state corporation Rosatom. The deal was approved by the Kazakhstani government, without benefiting the country. Neither Kazakhstan nor Kazakhstani companies received any money from the sale of the Budenovskoye. A scandal is brewing in Kazakhstan. Investing in Kazatomprom seems like a bad idea.
LSIN:KAPShort
by Arman2002
Updated
2
123456789101112131415161718192021222324252627282930313233343536373839404142
…999

Made by humans

Select market data provided by ICE Data Services. Select reference data provided by FactSet. Copyright © 2026 FactSet Research Systems Inc.Copyright © 2026, American Bankers Association. CUSIP Database provided by FactSet Research Systems Inc. All rights reserved. SEC filings and other documents provided by Quartr.© 2026 TradingView, Inc.

SOC 2 CompliantGDPR Compliant
More than a product
  • Supercharts
Screeners
  • Stocks
  • ETFs
  • Bonds
  • Crypto coins
  • CEX pairs
  • DEX pairs
  • Pine
Heatmaps
  • Stocks
  • ETFs
  • Crypto coins
Calendars
  • Economic
  • Earnings
  • Dividends
  • IPOs
More products
  • News Flow
  • Portfolios
  • Fundamental Graphs
  • Yield Curves
  • Options
  • Macro Maps
  • Pine Script®
  • MCP Server
Apps
  • Mobile
  • Desktop
Community
  • Social network
  • Wall of Love
  • Refer a friend
  • Creator program
  • House Rules
  • Moderators
Ideas
  • Trading
  • Education
  • Editors' picks
Pine Script
  • Indicators & strategies
  • Wizards
  • Freelancers
  • Marketplace
Tools & subscriptions
  • Features
  • Pricing
  • Market data
  • Gift plans
Trading
  • Overview
  • Brokers
  • Brokers comparison
  • The Leap
Special offers
  • CME Group futures
  • Eurex futures
  • US stocks bundle
About company
  • Who we are
  • Space mission
  • Blog
  • Help Center
  • Careers
  • Media kit
Merch
  • Tarot cards for traders
  • The C63 TradeTime
Policies & security
  • Terms of Use
  • Disclaimer
  • Privacy Policy
  • Cookies Policy
  • Accessibility Statement
  • Trust Center
  • Security tips
  • Bug Bounty program
  • Status page
Business solutions
  • Widgets
  • Charting libraries
  • Lightweight Charts™
  • Advanced Charts
  • Trading Platform
Growth opportunities
  • Advertising
  • Brokerage integration
  • Partner program
  • Education program
Community
  • Social network
  • Wall of Love
  • Refer a friend
  • Creator program
  • House Rules
  • Moderators
Ideas
  • Trading
  • Education
  • Editors' picks
Pine Script
  • Indicators & strategies
  • Wizards
  • Freelancers
  • Marketplace
Business solutions
  • Widgets
  • Charting libraries
  • Lightweight Charts™
  • Advanced Charts
  • Trading Platform
Growth opportunities
  • Advertising
  • Brokerage integration
  • Partner program
  • Education program
Look FirstLook First