 Long
Long
ANIC: price driven lower, buyers stepped inNegative sentiment is in full swing here, and Agronomics has been selling off hard since June. Very complicated one to get your head around, it’s an ‘investment company backing cellular agriculture and alternative protein businesses’ cultivated meat and precision fermentation’, just rolls off the tongue.
Worth noting the strong uptick in volume at the end of last week. Friday in particular, price sold off hard intraday only to retrace back near the open, a deep wick with a very clear rejection candle. That has the look of a classic tree shake, price driven lower to shake out weak hands before a larger buyer steps in, freeing up liquidity in the process.
TR-1 notices are thin on this one, but the director dealings are worth a look. Jim Mellon has taken his stake from roughly 15% to 18.3% over the past six months. Some of that’s been straightforward open market buying, but the bulk came via a direct, privately negotiated purchase from BlueNalu, one of Agronomics’ own portfolio companies, rather than anonymous sellers in the market.
Either way, it’s meaningful insider conviction from the man running the show. Whether this price level marks an early sign of a reversal is another question entirely, one I’d want more evidence for before calling it.  Long
Long
 Short
Short
 Long
Long
 Long
Long
 Long
Long
 Long
Long
 Long
Long
 Long
Long
 Long
Long
 Long
Long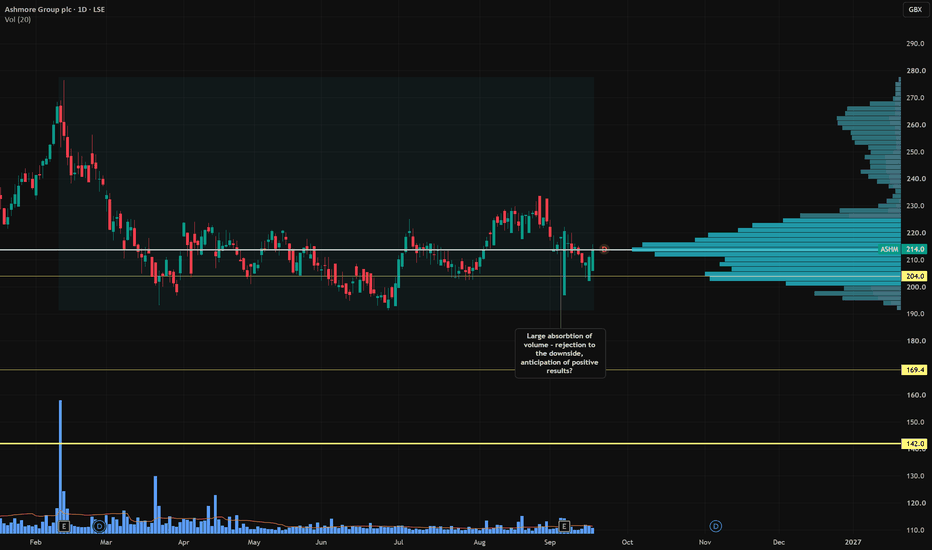
Britain Builds Steam Turbines Rolls-Royce Mini-Nuclear ReactorsBritish workers are set to manufacture steam turbines for Rolls-Royce’s planned fleet of small modular reactors (SMRs), in a move that promises to strengthen domestic manufacturing and reduce reliance on overseas suppliers for a critical piece of nuclear power equipment. Siemens Energy will produce the huge machines for the new generation of small modular reactors at its factory in Newcastle. The turbines will be used in the three Rolls-Royce-designed SMRs that are being built in Anglesey, as well as in further reactors that are set to be built in the Czech Republic and Sweden.
The decision marks a significant moment for British industry because it will be the first time in more than 20 years that large steam turbines have been made domestically. The expansion of the Newcastle factory will follow an investment understood to be worth tens of millions of pounds, and it is expected to create around 550 jobs. That combination of capital investment and skilled employment gives the announcement considerable weight, especially at a time when policymakers are focused on energy security, industrial capacity, and the resilience of supply chains.
The move also follows concerns raised by MPs that SMR components were set to be built abroad. Those concerns reflected a broader anxiety about whether Britain would capture the industrial benefits of its own nuclear ambitions or simply import the key parts from other countries. By choosing to manufacture the steam turbines in Newcastle, Siemens Energy and Rolls-Royce SMR are signalling that at least part of the supply chain will remain on British soil.
Rolls-Royce SMR said the decision by German engineering giant Siemens demonstrated how the company was “delivering its commitment to localisation, driving investment and re-shoring work that would have taken place overseas.” The phrase “re-shoring” is particularly important because it captures the idea of bringing back manufacturing activity that might otherwise have been located in another country. For supporters of domestic industry, that is a central part of the announcement’s appeal.
Rolls-Royce SMR is an independent company. It is majority owned by Rolls-Royce, but its investor base also includes Qatar and France’s Perrodo family. That structure means the business combines the heritage and engineering reputation of Rolls-Royce with additional international investment. The company’s chief executive, Chris Cholerton, framed the turbine decision as part of a longer industrial story. “We are building on a remarkable industrial legacy while creating and sustaining the skills and supply chain needed to deliver clean, secure and affordable energy for decades to come,” he said.
Darren Davidson of Siemens Energy also emphasised the wider significance of the work. “We’re preparing to manufacture the next generation of steam turbines for small modular reactors, supporting energy security, creating skilled jobs and helping power the UK’s future energy mix,” he said. His comments connect the project to three priorities that often appear together in debates about nuclear power: energy security, employment, and the transition to a lower-carbon energy system.
The Government awarded Rolls-Royce a contract to design and develop Britain’s first three SMRs last year. Those reactors will be built in Anglesey, North Wales, in a project aimed at proving the commercial viability of the still-nascent technology by the mid-2030s. Each reactor is expected to generate 470 megawatts of power. If the project succeeds, it could help establish small modular reactors as a viable option for producing reliable low-carbon electricity at a smaller scale than traditional large nuclear plants.
Rolls-Royce selected Siemens Energy as its supplier of steam turbines last year, but until now there had been uncertainty about where the key components would actually be manufactured. That uncertainty mattered because the location of manufacturing determines not only the direct economic benefits, such as jobs and investment, but also the strength of the domestic supply chain. The confirmation that the turbines will be built in Newcastle removes some of that ambiguity and gives the project a clearer industrial footprint.
The British company had faced a backlash earlier this year after it emerged that some other parts would be made overseas. Those parts included reactor pressure vessels that will be imported from either South Korea or the Czech Republic. That disclosure raised questions about how much of the SMR programme would genuinely support British manufacturing and how much would depend on foreign suppliers. The latest announcement does not answer every question about local content, but it does provide a notable counterweight by securing a high-value component for domestic production.
Taken together, the decision to build the steam turbines in Newcastle represents more than a single procurement choice. It is a signal about the kind of industrial ecosystem that Rolls-Royce SMR and its partners hope to create around small modular reactors. The project is still in its early stages, and the technology has yet to be proven commercially at scale. But the investment in the Newcastle factory, the creation of hundreds of jobs, and the return of large steam turbine manufacturing to Britain all suggest that the SMR programme is beginning to generate tangible industrial activity.
For the UK, the announcement touches on several important themes at once: the push to re-shore critical manufacturing, the desire to create skilled jobs in regions with strong industrial traditions, the need to strengthen energy security, and the ambition to develop a domestic nuclear supply chain. Whether those ambitions are fully realised will depend on the project’s execution over the coming years. For now, however, the decision to manufacture steam turbines in Newcastle gives the Rolls-Royce SMR programme a clearer domestic anchor and a more visible role in Britain’s industrial and energy future.  Long
Long
 Long
Long
 Long
Long
 Long
Long
 Long
Long
 Long
Long
Tesco — Downside Pressure Building Toward 430Tesco is currently displaying a fragile price structure, with the latest movement favoring the bearish side. The market is showing persistent weakness, and the prevailing setup suggests that the stock may have further room to depreciate before reaching the 430 target region.
The current price behavior indicates that upward recoveries are facing resistance, while downward moves are gaining greater traction. This imbalance keeps the selling scenario active and increases the probability of another leg lower if the present structure remains intact.
From the chart perspective, 430 stands out as the primary downside destination. The route toward this level could develop through several stages, with intermittent rebounds possible along the way. However, unless the market produces a meaningful structural reversal, such recoveries may remain limited within the broader bearish framework.
The current formation is particularly notable because sellers are dictating the rhythm of the move. Lower pricing is being accepted by the market, while attempts to regain lost territory have not yet produced sufficient strength to change the overall outlook.
External factors such as UK consumer sentiment, retail-sector conditions, inflation expectations, household spending, currency fluctuations, and company-specific developments can influence Tesco's volatility. Nevertheless, the technical configuration currently keeps attention firmly on the downside.
The projected sequence is:
Existing weakness → renewed selling activity → further price erosion → 430 objective.
📍 Market Bias: Bearish
📉 Trade Direction: Sell
⚠️ Current Condition: Weakness prevailing
🎯 Projected Level: 430
🔻 Scenario: Continued downside
The chart remains under pressure, and 430 is the key level in focus while the bearish formation continues to unfold.  Short
Short
Standard Chartered — Buyers Driving Toward 2627Standard Chartered is currently presenting a favorable bullish setup, with the latest price action indicating that buyers are gaining stronger control and creating scope for a continued advance toward the 2627 target area.
The underlying structure is showing positive development, with upward pressure becoming more prominent across the recent movement. Instead of displaying sustained weakness, price is maintaining a constructive trajectory that can support another leg higher as bullish participation continues to build.
The 2627 region is the principal upside objective for this analysis. A continuation of the current market behavior could allow the stock to progress through intermediate resistance levels and gradually extend its valuation toward the projected destination.
From a technical standpoint, the developing formation favors sustained appreciation. Buyers appear increasingly comfortable at higher levels, while bearish attempts have so far lacked the strength required to change the broader direction. This creates a favorable environment for the bullish scenario to remain active.
Standard Chartered's performance can also be influenced by global banking sentiment, interest-rate expectations, credit conditions, economic growth prospects, currency fluctuations, and developments across international financial markets. These factors may introduce volatility, but the current technical roadmap remains focused on the upside.
The projected progression is:
Positive structure → stronger buyer participation → continued appreciation → 2627 target zone.
📍 Bias: Bullish
📈 Trade Direction: Buy
🚀 Momentum: Positive
🎯 Target: 2627
⚡ Structure: Upside continuation
The chart continues to favor higher ground, with 2627 remaining the key projected destination as buyers attempt to extend the current advance.  Long
Long
Vodafone — Buyers Positioning for a Move Toward 131Vodafone is currently showing a constructive upside formation, with price action indicating that buyers are gradually gaining stronger influence over the market. The recent behavior suggests that the stock has room to develop another upward phase, keeping the immediate outlook tilted toward the buying side.
The 131 level stands as the primary upside objective in this setup. Current momentum provides a basis for a continued advance, with price potentially progressing through intermediate levels as bullish participation strengthens.
From a technical perspective, the market is attempting to establish a healthier upward trajectory. The developing structure indicates that downside pressure is losing its previous influence, while demand is becoming more prominent. Should this character remain intact, the next meaningful expansion could carry Vodafone toward the projected 131 region.
The broader backdrop may also be shaped by telecommunications-sector sentiment, subscriber trends, competitive conditions, regulatory developments, financing costs, and wider equity-market behavior. These elements can affect the pace of appreciation, but the present chart structure remains oriented toward higher levels.
The anticipated progression is:
Current positioning → strengthening demand → upward extension → 131 objective.
📍 Bias: Bullish
📈 Direction: Buy
🚀 Momentum: Improving upside participation
🎯 Target: 131
⚡ Structure: Bullish continuation
The chart is gradually shifting the balance toward the buyers, with 131 remaining the principal upside destination for this setup.  Long
Long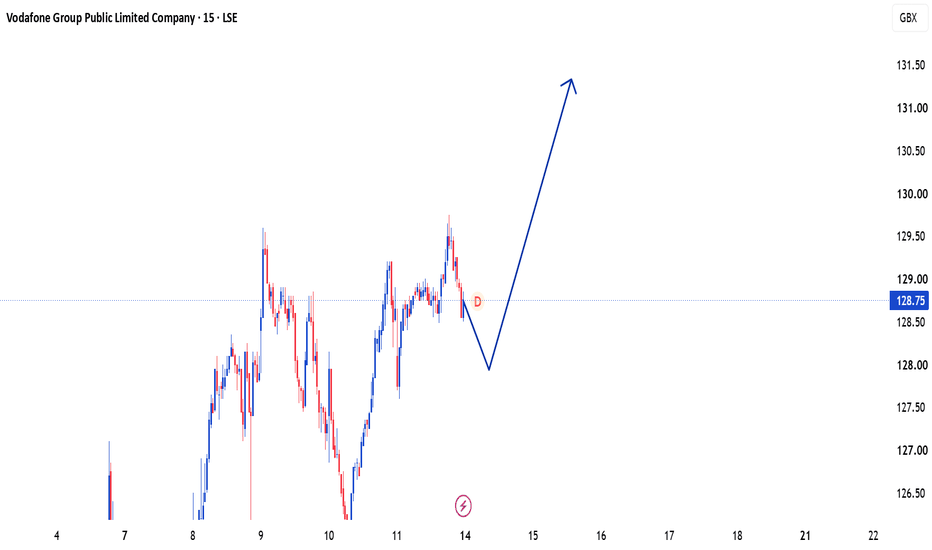
British American Tobacco — Downside Path Toward 3920British American Tobacco is currently developing a bearish setup, with the recent price behavior indicating that the stock remains vulnerable to additional weakness. The prevailing market tone is tilted toward the selling side, while upward attempts appear unable to establish a convincing reversal.
The technical picture points toward a continuation of the downward sequence, with 3920 emerging as the principal objective on the chart. As the current formation unfolds, further depreciation could take place before the market reaches this projected level.
Price action is presently reflecting a lack of sustained upside traction. The inability to regain stronger territory leaves the door open for another extension lower, particularly while bearish participation remains evident. Rather than treating the decline as a short-lived fluctuation, the structure suggests that sellers may continue pressing the valuation downward.
The broader environment can also influence British American Tobacco through consumer-sector sentiment, currency movements, regulatory developments, commodity costs, company-specific news, and changes in international equity conditions. Such factors may affect volatility and timing, while the chart continues to provide a clear downside framework.
The projected sequence is:
Current weakness → continued pressure from sellers → deeper retracement → 3920 target zone.
📍 Market Bias: Bearish
📉 Trade Direction: Selling
⚡ Price Structure: Downward
🔥 Momentum: Seller-led
🎯 Projected Objective: 3920
The market has established a vulnerable formation, and 3920 remains the key downside destination as British American Tobacco continues to face pressure from the selling side.  Short
Short


