PHE Breakout and RSI Positive DivergenceRecent breakout of PHE - 50% on Friday after announcement meeting can be found on IG trading or other platforms. I play about wih this looking for some channels but then realised the RSI positive divergece building - aims itself firmly at the next earnings report- how will it play out? are we looking at retesting the highs?
JET2 PLC LSE STOCK MARKET , at support, Long ?LSE:JET2
Jet2 like the rest of the aviation market had a terrible time performance wise due to covid and lock downs, price now at a long term support, i expect it to be respected and bounce from here, perfect place for a buy, fundamentals for Jet are great as well as the technicals which i have indicated in my TA.
shot firedBeen waiting a while for this ...moving more cash into this for i believe its accumulation zone....trouble is on the books here so its a small feeler,will add more charts etc.. another day when not so busy
ALong
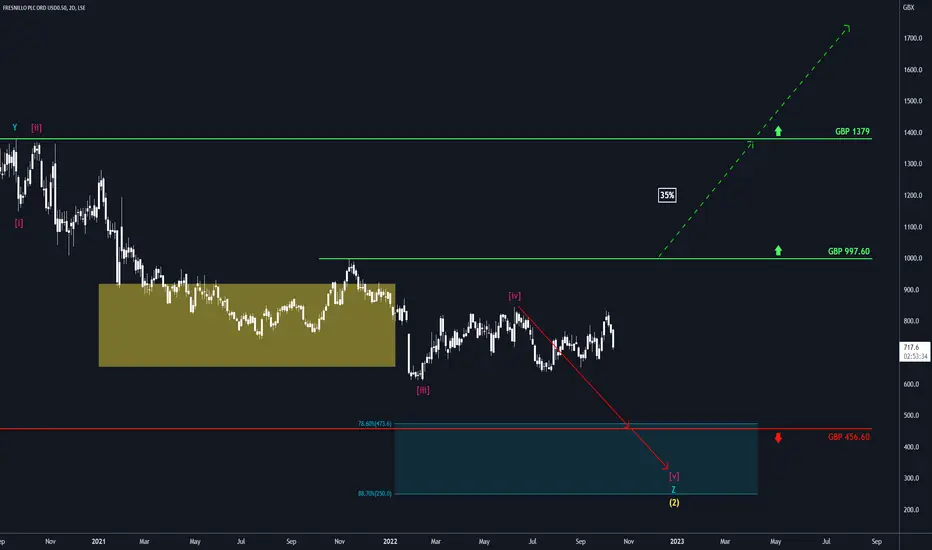
Fresnillo: ReasonableFresnillo is back to being reasonable and – in accordance with our expectations – has moved downwards again. Now, it should keep up this drive to make it below the support at GBP 456.60 and thus into the turquoise zone between GBP 473.60 and GBP 250.00, where it should finish wave (2) in yellow. There is a 35% chance, though, that Fresnillo could escape above the resistance at GBP 997.60, thus triggering further ascent above the next mark at GBP 1379.
hargreaves landowns stock, long term down trendLSE:HL.
1d candle chart, 4 year downtrend, short for me, maybe 2026 this thing will turn around,
support and resistance marked, for sensible entry and exits.
HShort
Trade it in, Auto Trader. AUTOAuto Trader is heading for a final leg in a downward impulse. Clear picture on the Elliott, backed up by indicators on the daily. Good luck!
We are not in the business of getting every prediction right, no one ever does and that is not the aim of the game. The Fibonacci targets are highlighted in purple with invalidation in red. Confirmation level, where relevant, is a pink dotted, finite line. Fibonacci goals, it is prudent to suggest, are nothing more than mere fractally evident and therefore
$PSNBig UK constructor.. I think the last swing high is in 3 rather than a 5 as labelled but we have 5 waves down from highs in A and trendline a logical place to reshort. You can see it held prior 4 ...unlike a lot of stocks it could not take out pre Covid highs in spite of speculative buying frenzy post Covid
Unilever (ULVR.l) bearish scenario:The technical figure Rising Wedge can be found in the daily chart in the UK company Unilever PLC (ULVR.l). Unilever plc is a British multinational consumer goods company. Unilever products include food, condiments, ice cream, cleaning agents, beauty products, and personal care. Unilever is the largest producer of soap in the world, and its products are available in around 190 countries. The Rising Wedge broke through the support line on 04/10/2022. If the price holds below this level, you can ha
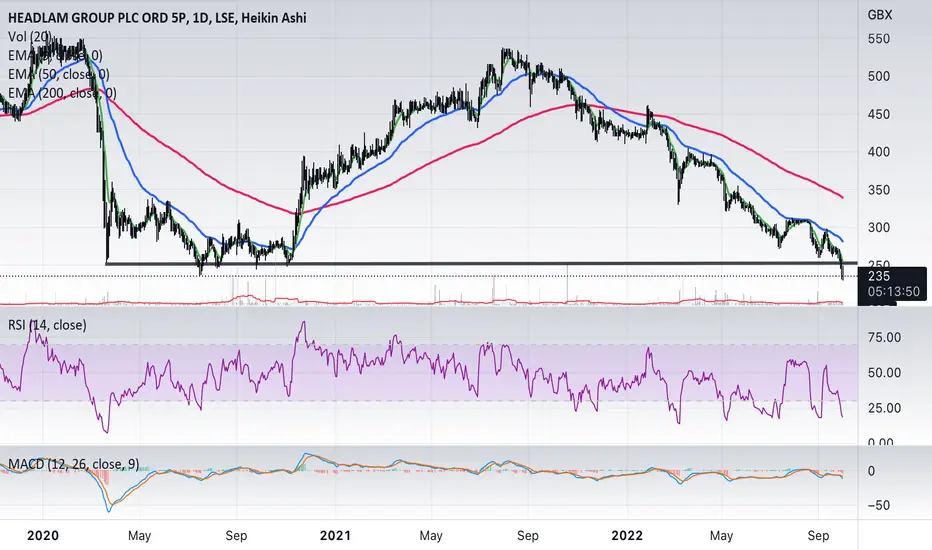
HEAD - Long term support brokenDowntrend continues and now long term support broken.
Buy back have been helping to slow the fall, however there isn't much left in the pot to continue.
Cost of living crisis will no doubt influence a poor latest quarter as homeowners hold back on purchases.
HShort
THG PLC: Reversal and Bullish Island Pattern1) I believe that the bullish wedge pattern (June-August) is still valid with the price target of 88.
2) Island Pattern, which is reversal and bullish.
3) Price to book ratio: 0.32
4) Insiders are buying the stock at these levels.
1st target: 88
2nd target: 104.85 (gap)
Barclays has no bulls at all. Yet.Barclays - 30d expiry - We look to Buy at 140.42 (stop at 134.98)
Price action continued to range between key support & resistance (140.00 - 175.00) and we expect this to continue.
We are trading at oversold extremes.
Short term momentum is bearish.
Early pessimism is likely to lead to losses although extended attempts lower are expected to fail.
Support is located at 140.00 and should stem dips to this area.
Support could prove difficult to breakdown.
With signals for sentiment at overs
Glencore is basically flat in USD this year!Check out the price of Glencore in USD. It's basically flat. How come? Their business is in USD and their business is booming. Trading will keep doing incredibly well, Coal is on fire (check out Whitehaven a pure play in OZ). It trades sub 5x EBITDA, yield close to 5%, and could be debt free in 12 months... No brainer buy in my mind.
Ageas SAAgeas SA is a Belgium-based international insurance company. The Company’s business segments include Belgium, the United Kingdom, Continental Europe, Asia, Reinsurance, and General Account. The stock is listed on the Belgium Stock Exchange. The price chart has formed a 16-month-long descending triangle with the horizontal boundary acting as strong support around the €38.70 level. A daily close below the €38 level will confirm the breakdown from the 16-month-long descending triangle with a possib