Marks & Spencer: A Rocky Start to Fiscal 2026Despite a strong start to the year, Marks & Spencer’s momentum has been overshadowed by a major cyberattack, disrupting online operations from April through July. While their reshaping strategy continues to deliver gains in volume, market share, and profitability, the breach is expected to dent fiscal 2026 operating profit by ~£300M.
An analyst warns of short-term reputational damage, and shares are down ~12% YTD.
📊 Technical View:
The price remains under pressure. A weekly close below 319.20 (Jan low) would complete a sizeable double top, with a potential 100-point downside target. The 200-week moving average at 239 is our initial target.
Upside resistance? The 55-week moving average at 359. Unless that’s cleared, pressure likely remains.
Disclaimer:
The information posted on Trading View is for informative purposes and is not intended to constitute advice in any form, including but not limited to investment, accounting, tax, legal or regulatory advice. The information therefore has no regard to the specific investment objectives, financial situation or particular needs of any specific recipient. Opinions expressed are our current opinions as of the date appearing on Trading View only. All illustrations, forecasts or hypothetical data are for illustrative purposes only. The Society of Technical Analysts Ltd does not make representation that the information provided is appropriate for use in all jurisdictions or by all Investors or other potential Investors. Parties are therefore responsible for compliance with applicable local laws and regulations. The Society of Technical Analysts will not be held liable for any loss or damage resulting directly or indirectly from the use of any information on this site.
 Short
Short

British Banks Dodge a Legal BulletBritish Banks Dodge a Legal Bullet, but Still Face Billion-Pound Costs
Ion Jauregui – Analyst at ActivTrades
The UK Supreme Court relieves financial institutions from paying up to £44 billion over the car finance scandal. The FCA is preparing compensation plans that could cost up to £18 billion.
British banks have narrowly avoided a legal blow that threatened one of the largest payouts in their recent history. The UK Supreme Court ruled against applying broad compensations for inflated commissions on car finance agreements—a case that could have cost the sector up to £44 billion.
The decision was met with relief by the market. Shares of Close Brothers Group, Lloyds Banking Group, Barclays, and Bank of Ireland, all with direct or indirect exposure to auto loans, posted significant gains following the verdict.
However, the legal outcome does not mark the end of the matter. The Financial Conduct Authority (FCA) has announced it is working on a more limited compensation plan, which could result in payouts between £9 billion and £18 billion. Lloyds, one of the most affected entities, currently holds a provision of £1.2 billion, which its management believes will not need to be significantly increased.
Moody’s has rated the situation as credit negative for the UK banking sector, warning that despite the favorable ruling, regulatory and reputational risks remain.
Fundamental Analysis of Lloyds
Lloyds Banking Group (LSE: LLOY) remains a cornerstone of the UK financial system. Backed by strong capital ratios and a diversified portfolio, the bank has managed to weather regulatory and macroeconomic challenges in the post-Brexit, inflationary environment.
In its latest quarterly report, Lloyds posted a net profit of £1.63 billion, beating market expectations. The bank reported a ROTE of 15.3% and a CET1 ratio of 13.9%, providing a solid buffer to absorb potential future shocks. Additionally, the board announced an interim dividend of 0.92 pence per share, underscoring its commitment to shareholder returns despite ongoing uncertainties.
Technical Analysis of Lloyds (LSE: LLOY)
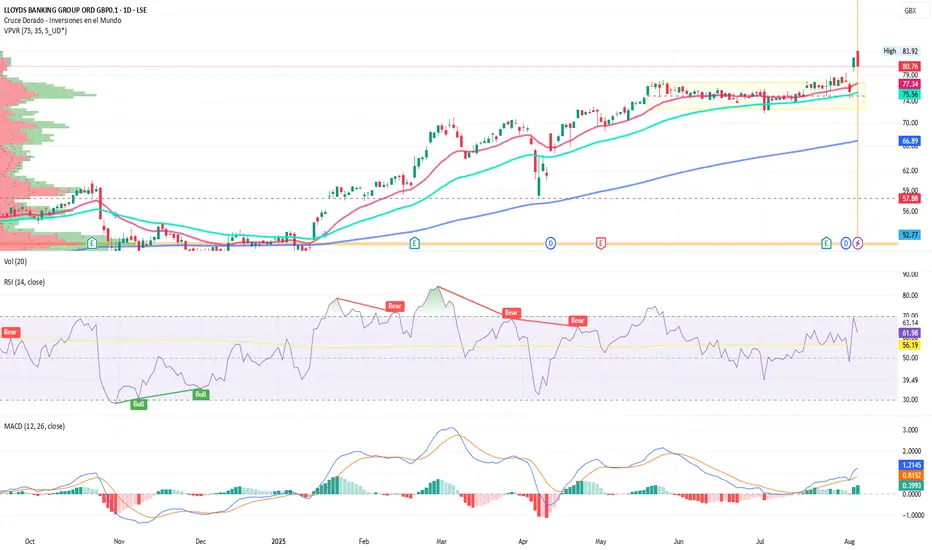
Lloyds has shown remarkable technical momentum so far this fiscal year. After hitting lows of £49.93 in January and forming a base that led to a golden cross of moving averages, the stock experienced a temporary dip to £57.88 following the announcement of new US tariffs.
Since then, the share price has advanced steadily, recently touching a new all-time high of £83.92 after forming a clear accumulation zone between May and July. This week, the stock decisively broke out of that range, entering what appears to be a potential “blue-sky” scenario, with no defined resistance levels above.
The move is supported by a bullish MACD crossover and increased trading volume, signaling momentum strength.
On the other hand, the RSI, currently at 61.98, indicates a slight moderation in the trend, especially after Tuesday's bearish candle, which could hint at a short-term correction toward the point of control (POC) at £75.20.
Key Indicators:
• MACD: Expanding, confirming strong upward momentum.
• RSI: At 61.98, suggesting moderate overbought conditions and possible pullback.
• Moving averages: Diverging, reinforcing the bullish trend structure.
Levels to Watch:
• Support: £77.50 – a break below this level could trigger a return to the accumulation zone.
• Resistance: With no clear ceiling in place, a continuation of the current breakout could see the stock approach the £90 mark.
In summary, while a short-term pullback is possible if regulatory pressure intensifies, Lloyds' technical outlook remains firmly bullish, supported by growing volume and strong momentum signals.
Dodging the Bullet
The Supreme Court ruling provides short-term relief for the UK banking sector, but the financial impact of the car finance scandal remains unresolved. As the FCA outlines its compensation plan, Lloyds stands out for its solid fundamentals and bullish technical setup—albeit with room for short-term corrections. The UK banking industry, although momentarily having dodged a bullet, still faces unresolved regulatory challenges and market scrutiny. The case has reignited the debate around sales practices in the UK auto finance market, a segment that until recently had avoided the level of oversight applied to other financial products.
*******************************************************************************************
The information provided does not constitute investment research. The material has not been prepared in accordance with the legal requirements designed to promote the independence of investment research and such should be considered a marketing communication.
All information has been prepared by ActivTrades ("AT"). The information does not contain a record of AT's prices, or an offer of or solicitation for a transaction in any financial instrument. No representation or warranty is given as to the accuracy or completeness of this information.
Any material provided does not have regard to the specific investment objective and financial situation of any person who may receive it. Past performance and forecasting are not a synonym of a reliable indicator of future performance. AT provides an execution-only service. Consequently, any person acting on the information provided does so at their own risk. Political risk is unpredictable. Central bank actions can vary. Platform tools do not guarantee success.
 Long
Long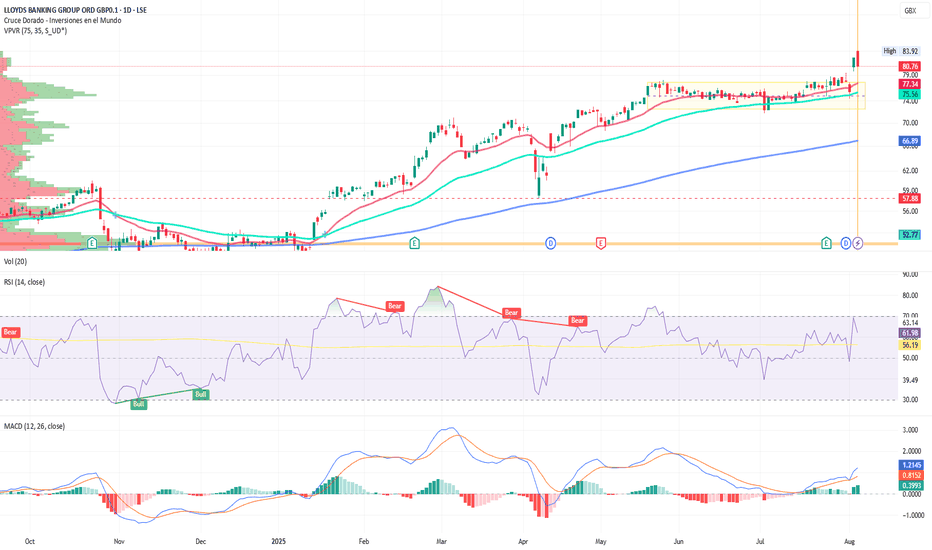
 Long
Long
 Short
Short
 Long
Long
 Long
Long
Long 
 Long
Long
 Short
Short
 Long
Long
 Short
Short
 Long
Long
 Long
Long
Head and Shoulders Pattern on the 1H and Daily TimeframesKey Observations:
1. **Bullish Gartley Pattern on the 2-Day Timeframe**
- This is a strong reversal pattern, indicating potential upside.
2. **Head and Shoulders Pattern on the 1H and Daily Timeframes**
- The **inverted head and shoulders** suggests a bullish breakout, especially after a long consolidation phase.
3. **Consolidation for Almost 3 Years**
- If this consolidation is ending, a breakout could be significant.
4. **Indicators Showing Bullish Divergence**
- **MACD turning up**
- **RSI divergence (lower price, higher RSI)**
### Potential Upside Target: **178 GBX**
- If the reversal plays out, your projection to **178 GBX** is possible.
However, keep an eye on key resistance levels like **116.4**, **127.3**, and **151.5**. If price struggles at these levels, short-term retracements might occur before a full breakout.
As of June 2024, Alphawave IP Group plc (LON:AWE) reported the following financial figures:
- **Debt-to-Equity Ratio**: 49.6%, with total debt of US$217.9 million and total equity of US$439.2 million. citeturn0search0
- **Cash and Cash Equivalents**: US$76.3 million. citeturn0search0
Additionally, the company's total assets were US$873.0 million, and total liabilities amounted to US$433.8 million. citeturn0search0
These figures indicate that Alphawave IP Group has a moderate level of debt relative to its equity and maintains a cash position that contributes to its financial flexibility.
⚠ **Not Financial Advice** – Always manage risk and confirm signals before trading.  Long
Long
Ferro-Alloy and Eurasia Mining:High-Potential Mining InvestmentsIn the volatile world of mining, where geopolitical risks and market fluctuations often overshadow opportunities, two companies stand out for their potential to deliver significant returns: Ferro-Alloy Resources and Eurasia Mining. Both are focused on critical minerals-vanadium and platinum group metals (PGMs), respectively-that are essential for the global energy transition. With ambitious projects, strong financial backing, and strategic positioning in emerging markets, they offer investors a unique chance to capitalize on the growing demand for these resources. However, their path to success is fraught with challenges, including regulatory hurdles and operational risks. I suggest exploring the investment potential of these companies, including their strengths, opportunities, and risks, of course. Because where can we step without potential risks today?
Ferro-Alloy Resources: A Rising Star in Vanadium
Ferro-Alloy Resources (FERRO-LSE:FAR), dual-listed on the London Stock Exchange (LSE) and the Astana International Exchange (AIX), is developing the Balasausqandiq vanadium deposit in Southern Kazakhstan. With a market capitalization of $66 million and net debt of $13 million, Ferro-Alloy is well-positioned to benefit from the rising demand for vanadium, which is used in energy storage and steel production.
The Balasausqandiq project is unique due to its potential for the lowest cash-cost vanadium production in the industry. A phased development plan, supported by a robust financial model, promises an impressive internal rate of return (IRR) of 30%. This high return is driven by low operating costs and vanadium’s strategic importance to the renewable energy transition. Specifically, vanadium redox flow batteries (VRFBs) are expected to see exponential growth as large-scale energy storage becomes critical for integrating wind and solar power.
The company’s shareholder base includes Vision Blue Resources with a 22.9% stake, providing capital and strategic guidance from industry veterans. Leadership, including CEO Nicholas Bridgen, brings decades of experience in mining and finance. However, the project’s location in Kazakhstan, while relatively geopolitically stable, carries risks of regulatory changes and infrastructure development. Additionally, reliance on external financing could expose the company to market volatility.
Nevertheless, Ferro-Alloy’s potential is clear. As vanadium demand is likely to outstrip supply by 2030, the Balasausqandiq project could position the company as a key player in the global market. For investors willing to embrace the risks, Ferro-Alloy offers an attractive opportunity to invest in a critical mineral with a bright future.
Eurasia Mining: A Future Leader in PGM Extraction
Eurasia Mining LSE:EUA , listed on London’s AIM market, focuses on a portfolio of PGM and nickel projects in the Arctic region. With a market capitalization of around $100 million, the company has garnered attention for its plans to revive the Monchetundra and NKT projects, which together hold over 184.6 million ounces of platinum equivalent.
The company’s strategy has shifted toward selling these assets - a process initiated in 2020. Recent geopolitical developments have rekindled interest in Eurasia’s projects. According to Oak Securities , the target price for the company’s shares is six times the current level, reflecting their immense potential.
The flagship NKT project is a Tier-1 nickel sulfide deposit with a net present value (NPV) ranging from $1.2 to $1.7 billion (per a 2021 report). The project benefits from proximity to a major processing plant, reducing capital expenditures. Additionally, the West Kytlim project in the Urals is already operational and generating cash flow.
However, investing in Eurasia Mining comes with risks. The company’s assets are located in a region with geopolitical challenges. Despite signs of potential collaboration on critical minerals, the situation remains unstable. Potential regulatory changes, international trade restrictions, or political upheavals could derail the company’s plans. Price volatility in commodities and operational complexities also pose challenges.
Despite these hurdles, Eurasia’s growth potential is pretty promising. A dual listing on the AIX in Kazakhstan opens access to investors from various regions, potentially boosting liquidity and valuation. For investors with a high risk tolerance, Eurasia Mining offers a rare opportunity to tap into the PGM and nickel markets.
Balancing Risks and Opportunities
Both Ferro-Alloy Resources and Eurasia Mining present compelling investment prospects, but with several notable risks, of course. Ferro-Alloy’s success hinges on widespread VRFB adoption, while Eurasia Mining must navigate Russia’s geopolitical challenges. For people, whose attention has been caught by these companies, the key to success lies in understanding these risks and balancing them against potential rewards. Diversification, thorough analysis, and a long-term perspective are essential when investing in mining companies, especially in emerging markets. But for those, willing to take the leap, these companies may offer unique opportunities in the critical minerals sector.  Long
Long
 Short
Short