• Products
  • Community
  • Markets
  • Brokers
  • More
Get started
  • Markets
  • /United Kingdom
  • /Stocks
  • /Ideas
AVCT - will the historic resistance at 92p finally break?The price has approached a historic resistance level and the action on Thursday and Friday is worth paying close attention to. Both sessions saw the price reject around this level on very strong volume. The million dollar question is how many sellers are still sat up here. If the queue is long, the price will struggle to break through and could turn back down from here. The only scenario where that changes is if the fundamentals behind the business have shifted meaningfully since December last year. If institutions believe the story has genuinely changed they will be willing to pay up and push through that resistance regardless of the sellers sitting there. It is too early to call either way. I will be watching how this one unfolds over the next week or so before forming a stronger view.
LSE:AVCTShort
by Stockso_Simple
22
Glencore giant cup n handleGiant cup and handle has formed over 14 years and positioned to breakout. Upside 85%!
LSE:GLEN
by suep22
MTEC - ready to see if the momentum can push up to 45pThe longer term trend is pointing upwards but this one comes with some very wide gyrations along the way, so make sure your stops have plenty of breathing room with stops. Friday stood out. A strong bullish candle with the price rejecting firmly as sellers tried to push it lower, on volume over twice the average. The effort from the sellers was there but the result was not. That is exactly the kind of footprint that suggests buyers are in control at this level. Could this have enough momentum to carry back to the top of the range? The ingredients are there. Price target: 45p Potential reward: 17%
LSE:MTECLong
by Stockso_Simple
AMRQ - will the rising lows lead to a 104p breakout?Another series of rising lows that caught my eye. The volume picture looks subdued on first glance but it is worth noting that the chart is being skewed by the massive spike on the 8th April. Strip that out and Friday’s volume was actually close to twice the average, which tells a different story. The price is squeezing upwards with tight price action and the lows keep stepping higher. The supply of lower prices is running out. A convincing break above 104p on strong volume would be the trigger for me. Until then I am watching and waiting.
LSE:AMRQLong
by Stockso_Simple
CNC - will the 200p resistance trigger a reversal?I rode a decent trade out of this one below 200p, although I got out too early as usual. The price has now pushed all the way back up to the top of its trading range and this is where I start to pay close attention. Friday’s candle is one of uncertainty, and volume has started to creep back up at this level. That combination at a known resistance level is worth respecting. My best opportunities consistently come from the edges of trading ranges rather than the middle, so there is no rush here. The discipline is in waiting for the right moment rather than forcing a trade. I will hold out and watch how this develops before considering a reversal. Stick to the plan.
LSE:CNCShort
by Stockso_Simple
Market Insight: Understanding the -10 EGP GDR Discount 🤔 What does the "-10" actually mean? Currently, the London Global Depositary Receipt (GDR) when converted to Egyptian Pounds is trading roughly EGP 10 cheaper than the local listing on the EGX. 📉 This represents a significant ~7.4% discount. 💡 The Arbitrage Opportunity: Essentially, you are looking at the exact same company, but it is 7.4% cheaper to purchase in London than in Egypt. 🏦 This is known in the financial world as an "Arbitrage Gap" or a "Price Gap." 💹 ⚖️ Why does this gap exist? Several factors contribute to this pricing discrepancy: EGX Overbought Conditions: Local demand in Egypt may have pushed the local stock price to overextended levels. 📈🔥 Capital Controls: The gap persists because moving capital and converting shares between the Egyptian and London markets is complex and restricted. 🚧💱 Currency Sentiment: These gaps are often "pressure gauges" for the EGP. When currency controls are relaxed or liquidity improves, the gap typically shrinks as prices converge. 📉🔄 📝 Bottom Line: A wide discount often suggests that the local EGX price may be due for a correction, or the London price is anticipating a shift in the exchange rate. Watch this gap closely it’s one of the best indicators for market sentiment! 🔭💎 If you like my insights, follow and boost! 🙌💙🚀 🎁 $15 TradingView Discount: 🔗 www.tradingview.com ✨💸🤑
TURQUOISE:CBKDLShort
by mnmabroukw36ix
IWG - Workspace as a ServiceIWG is the global leader in flexible office space. It operates nearly 6,000 coworking and serviced office locations across more than 120 countries under brands such as Regus and Spaces. In simple terms, it provides flexible workspace solutions to businesses of all sizes, increasingly through a capital-light partnership model with landlords.
LSE:IWGLong
by CristiL
SSPG - could buyers be mopping up supply at the old gap support?Tuesday’s price action was a clear anomaly and it is the kind of thing that only stands out if you are watching the relationship between price and volume closely. Volume price analysis is not an exact science, it is more of an art. What I like to do is look back at similar sized candles and compare the corresponding volume to understand whether there is a pattern worth paying attention to. In this case 3 times the average volume on a lower rejection wick tells me buyers were actively mopping up the sell orders being thrown at them. What adds another layer of confidence is the price level itself. This is exactly where the gap was formed back in December. Old gaps have a habit of acting as support, and that appears to be exactly what is happening here. Price target: 208p Potential reward: 29%
LSE:SSPGLong
by Stockso_Simple
PRV - could rising lows and high volume lead to a 760p break?Some of the hardcore technical traders out there would call this a pennant or a wedge. I try not to get too hung up on the fancy names. What I see is a pattern I recognise and understand. The logic is straightforward. If you are accumulating stock you want to do it at the cheapest price possible. But if you keep absorbing the sellers below 750p, eventually you run out of sellers at that level. That is exactly what appears to be happening here. A steady reduction in supply, with the lows creeping higher each time the price dips. Friday’s session was interesting. Extremely high relative volume on tight price action. That could be one last push to clear out the remaining sellers before a breakout. A move above 760p would be the signal for me. That said I want to be clear, I have seen stocks dump hard from exactly these patterns before. There is no certainty in markets, only probabilities. The long term trend is pointing upwards which adds a layer of confidence, but manage your risk accordingly.
LSE:PRVLong
by Stockso_Simple
IGR - is the CEO's £800k buy the ultimate sign of confidence?This one came up on my screener on Thursday due to a significant volume spike and it is easy to see why. Since the strong breakout on the 30th April there has been a very encouraging series of rising lows building each day. The price is quietly squeezing upwards and the volume behind the move has been consistently elevated. That combination is exactly what you want to see building underneath a potential breakout. The gap created back in August is now acting as the overhead resistance around the 90p area and the price is pushing up against it with real conviction. Whether it can break through is the key question. What adds an interesting fundamental layer here is that the newly appointed CEO has recently purchased around £800k worth of shares. That is not a token gesture, that is a serious vote of confidence from someone who knows exactly what is going on inside the business. Price target: 90p Potential reward: 21%
LSE:IGRLong
by Stockso_Simple
GTLY - could the rising lows signal the end of the recent fall?I hold this one as a long term investment so I have a little more context than usual, which also means I am probably more perplexed than most about the scale of the share price fall recently. Two things concern me fundamentally. Receivables currently sit at around 48% of sales, which feels high and is worth watching closely. The 13% dividend yield also looks unsustainable at these levels, and a yield that high is often the market telling you something the income statement hasn’t confirmed yet. The chart however is starting to tell a slightly more encouraging story. The price has been moving sideways for around a month with very tight price action, and there is a slight curl upwards in the lows which is a positive early sign. Then there is that volume spike which is hard to ignore. If that represents genuine accumulation rather than a large holder distributing, I would want to see a convincing breakout above 76p before getting too excited.
LSE:GTLYLong
by Stockso_Simple
Heads up... SolGold just broke a 4-year descending triangle...Got in at 10.5p while everyone's chasing AI nonsense. Now sitting at 15.7p and this is just the warm-up. My friend Sean Tufford put me onto the LSE:SOLG SolGold telegram and here's what hit me - we need 80+ new major copper mines by 2030 just to electrify the world. Takes 20 years to build one. The math is broken. Copper is the new oil. The Setup That's Printing Position: Loaded at 10.5p First Target: 34p Franco Nevada and Osisko just wired $750M for streaming rights. That's not a bet, that's conviction. Why This Goes Parabolic: Cascabel isn't some exploration play. It's one of the largest copper-gold deposits on the planet that's not owned by a major. Yet. 540Mt reserves. First quartile costs. 28-year mine life that could triple. Trading at 0.11x NAV while peers sit at 0.30x. The market's asleep. Jiangxi Copper took a 12% stake at 45% premium. BHP owns 10%. Newmont owns 10%. Three majors circling like sharks. The Trade: The 4-year triangle break is your signal. The institutional money flooding in is your confirmation. From 10.5p to 34p = 224% minimum. That's just getting back to the old highs before the real move starts. Once the market wakes up to what $5 copper means for a first-quartile producer, this rips to 50p+. Stay long. Outguess the crowd. The descending triangle was the accumulation. Now we ride the impulse wave.
SLong
by ridethepig
Updated
1111
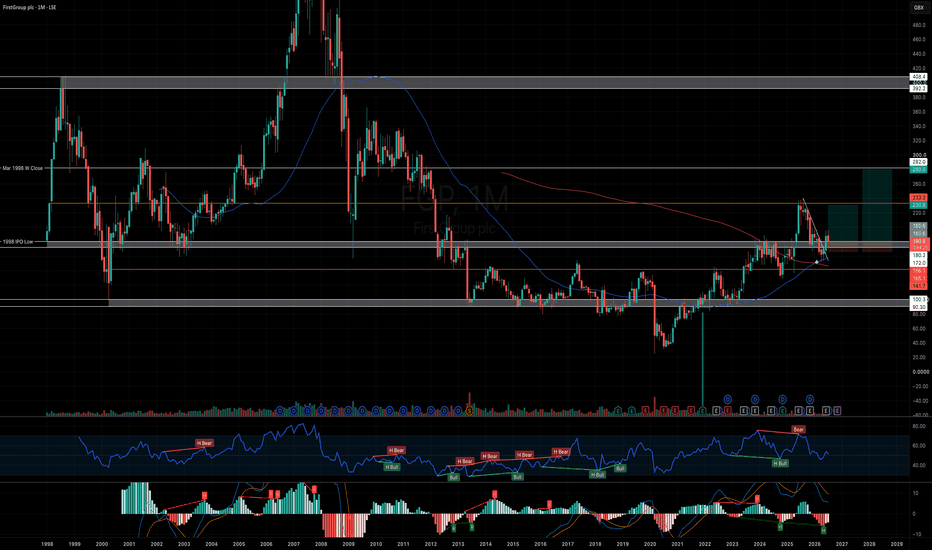
FGP could the market makers be clearing stock at current levels?Wednesday saw the price break to a 52 week low, which is always a significant psychological level. When these break they can often keep going. The upper wick on Wednesday’s candle coupled with volume three times the average suggests the market makers were unloading into the high of the day. Thursday then produced a big green candle on the surface, but do not be fooled. It opened at the low of the day, which looks to me like a test of how many buyers are sitting below this price level. The volume profile on the right hand side shows very little volume transacted below current levels. The market makers know that, and could use the thin order book to push the price further down. That is my theory anyway.
LSE:FGPLong
by Stockso_Simple
XPP is this textbook volume confirmation the real deal?This one has been on my watchlist for a while and I never pulled the trigger. Story of my life. Tuesday saw the price make a new high since the start of the year with volume rising alongside it, both in agreement. Then Wednesday it burst upwards another 13% on huge volume again. Textbook confirmation. Zoom out and the price is now pushing the top of its current range and threatening to break into the gap above. When you factor in the lack of volume traded between 1750p and 2350p it becomes something of a vacuum, and vacuums tend to get filled quite quickly.
LSE:XPPLong
by Stockso_Simple
SVS is this massive volume at 800p accumulation or distribution?A clear area of consolidation between 800p and 863p with a massive wave of volume sitting at this level. The volume profile covering the start of the year confirms there is real weight here. The question as always is whether this is accumulation or distribution. For me I want to see the price squeeze tighter with a trail of rising lows before I get too excited. That would suggest the supply is genuinely reducing rather than a large holder slowly offloading. Price target: 1000p Potential reward: 22%
LSE:SVSLong
by Stockso_Simple
SEE could the breakout from 3.5p lead to a 50% reward?Currently I hold this one in my SIPP, so factor in any biased opinion I have on this. Fundamentally because of the July 2026 EU mandate, which requires camera-based Driver monitoring systems in all new vehicles, I think this could really have the wind in its sails in the medium term. Interestingly the price bumped up 23% on effectively no news, quite simply the price has broken out of this consolidated area away from the 3.5p price ceiling on strong volume, price also closed at the high of the day which indicates buyers are firmly in control here. Will this have the momentum to take it back to the recent highs? the potential gains are not to be ignored. Price target: 6.25p Potential reward: 50%
LSE:SEELong
by Stockso_Simple
GFTU - ready for a consolidation phase before the next move?A choppy chart, but the increasing volume coming in around the 878p support level is worth noting. Friday the price gapped up, but on lower volume, which tells me the move lacks conviction for now. I would expect a little more consolidation at this level before any meaningful reversal takes hold. If momentum can carry the price back to the top of the range there is a modest gain on offer. Price target: 990p Potential reward: 12%
LSE:GFTULong
by Stockso_Simple
LRE - did you see the volume concentration at support?A deep wick falling all the way to the previous support level around 558p, with a significant concentration of volume at exactly that price. That kind of combination rarely happens by coincidence. This could be a heavy buyer still loading up on their position at a known support level. One caveat worth raising. It was not that long ago the price gapped down and that gap could act as strong overhead resistance for some time unless the underlying fundamentals have shifted. Worth keeping in mind before committing.
LSE:LRELong
by Stockso_Simple
TRI could be ready for a 37% move toward 86pHard to ignore this massive volume spike, which was over 7 times the average traded. What makes this particularly interesting is that the volume came in at a slightly higher price level than the previous reversal at the end of March, suggesting support is building between these two price points. Tight price action, small rejection wick, and if you zoom right out this also sits on a long term support level. Price target: 86p Potential reward: 37%
LSE:TRILong
by Stockso_Simple
JET2 could market makers be unloading into a rising market?I already have negative sentiment baked in here. Fundamentally I think airlines and travel are going to suffer for a good 12 months yet. Wednesday’s price activity was strange. The price opened below the recent support of 1029p and only clawed its way back to the low of the previous day. Volume was around twice the average, which to me looks like the market makers unloading as much stock as possible into a rising market. The following two days showed average up candles on declining volume. Could be wrong, I often am. But I think this one may trend lower for a while yet.
LSE:JET2Short
by Stockso_Simple
KEYS - could insider activity lead to a push past 580p?This is a very interesting one to start with. Lets talk insider dealing. Whilst I didn’t flag this one immediately before its rise, I did note a slight up tick back in volume on the 30th March. Then there was some very suspicious trading activity that took place in the 2 days leading up to its results this week. On the Monday and Tuesday this week the volume transacted was twice the average, it just so happens that the results were positive and ahead of expectations. I guess the high volume of buyers here were just lucky? It since rose 13%. With enough momentum it could push the next area of resistance around 580p
LSE:KEYSLong
by Stockso_Simple
Will Tesco shares plunge in May or June?Food retailers such as Tesco have traditionally been viewed as safe, defensive investments. They tend to attract beginner investors as well as those looking for stability, largely because demand for groceries remains relatively consistent regardless of economic or geopolitical turmoil. After all, food is a basic necessity, so revenues and profits in this sector have historically proven more resilient during periods of uncertainty. However, that long-standing assumption may now be facing a serious challenge. Recent findings from the consumer group Which? suggest that pressure on UK supermarket chains is intensifying, raising concerns about whether these businesses can maintain their defensive reputation in the current climate. In my view, Tesco’s share price could be at risk of a notable downturn. There are several warning signs that investors should not ignore. What’s driving concern? According to Which?, consumer sentiment in the UK was already weak even before the recent escalation in geopolitical tensions in the Middle East. Since then, confidence has deteriorated further. Their mid-April survey revealed that expectations for the UK economy dropped sharply to -62 — the lowest level recorded since the peak of the cost-of-living crisis. The outlook among consumers is overwhelmingly pessimistic. Only 9% of respondents believe economic conditions will improve over the next year, while a striking 71% expect things to get worse. This kind of sentiment typically has direct consequences for spending behaviour, especially in retail. Impact on shopping habits The data shows that consumers are already adjusting how they shop and eat. More than two-thirds of UK adults reported making at least one change to their habits in the past month. These adjustments include: Opting for cheaper alternatives (43%) Switching to supermarket own-brand budget ranges (37%) Taking advantage of promotional deals more frequently (31%) More concerning still, financial strain is beginning to affect basic consumption. Around 15% of households said they had gone without certain food items, and one in ten reported skipping meals altogether. This signals a deeper level of economic stress that could significantly impact supermarket revenues. What this means for Tesco While Tesco may be better positioned than many competitors due to its scale, supplier relationships, and strong brand recognition, it is not immune to these pressures. Its size allows it to negotiate lower costs and offer competitive pricing, while its Clubcard loyalty programme gives it a valuable data advantage to target promotions effectively. Even so, the challenges are mounting. With profit margins already thin — around 4.3% last year — Tesco has limited ability to offset rising costs by increasing prices. At the same time, increased consumer frugality could weigh heavily on sales volumes. Another area of concern is Tesco’s non-food segment. General merchandise accounts for roughly 5% to 10% of its revenue. If consumers are cutting back on essential grocery spending, discretionary purchases in this category could see an even sharper decline. Could the share price fall? The broader geopolitical situation adds another layer of risk. If global tensions persist or escalate, the economic fallout could further weaken consumer spending power, intensifying pressure on supermarket earnings. At the same time, Tesco’s valuation appears stretched. Its share price has risen around 30% over the past year, pushing its forward price-to-earnings ratio to approximately 18.9 — significantly above its historical average range of 12 to 13. This suggests that a lot of optimism may already be priced in. If upcoming updates fail to meet expectations, the downside could be significant. Tesco’s next trading update, scheduled for 18 June, will be a key moment. Any disappointing figures or cautious guidance could trigger a sell-off. Moreover, the shares could start to decline even before then if economic data continues to weaken or consumer confidence deteriorates further. Bottom line While Tesco remains a fundamentally strong business, the combination of worsening consumer sentiment, constrained margins, and elevated valuation creates a potentially fragile setup. Investors should be aware that even traditionally defensive stocks are not immune to sustained economic pressure — and in this case, the risk of a correction is becoming increasingly difficult to ignore.
LSE:TSCOLong
by KalaGhazi
HTWS ready for a retrace toward the 172p target?The price is bordering on a new 52 week high so don’t be surprised to see this one break to the upside at some point. But Wednesday gave me pause for thought. What I saw looked like a very traditionally drawn out area of distribution, and it is worth remembering that the giant funds operate on a completely different scale to the rest of us. When they need to reduce a position they cannot just hit sell and walk away. It takes time. It is within these upper ranges that you can sometimes spot that process playing out, and Wednesday looked like there was enough liquidity in the market for them to quietly clear some stock without spooking the price too much. A sustained break below 194p would be the signal for me that the sellers are winning this battle. Watching carefully. Price target: 172p Potential reward: 12%
LSE:HTWSShort
by Stockso_Simple
112233445566778899101011111212131314141515161617171818191920202121222223232424252526262727282829293030313132323333343435353636373738383939404041414242
…999999

Made by humans

Select market data provided by ICE Data Services. Select reference data provided by FactSet. Copyright © 2026 FactSet Research Systems Inc.Copyright © 2026, American Bankers Association. CUSIP Database provided by FactSet Research Systems Inc. All rights reserved. SEC filings and other documents provided by Quartr.© 2026 TradingView, Inc.

More than a product
  • Supercharts
Screeners
  • Stocks
  • ETFs
  • Bonds
  • Crypto coins
  • CEX pairs
  • DEX pairs
  • Pine
Heatmaps
  • Stocks
  • ETFs
  • Crypto coins
Calendars
  • Economic
  • Earnings
  • Dividends
  • IPOs
More products
  • News Flow
  • Portfolios
  • Fundamental Graphs
  • Yield Curves
  • Options
  • Macro Maps
  • Pine Script®
Apps
  • Mobile
  • Desktop
Community
  • Social network
  • Wall of Love
  • Refer a friend
  • House Rules
  • Moderators
Ideas
  • Trading
  • Education
  • Editors' picks
Pine Script
  • Indicators & strategies
  • Wizards
  • Freelancers
  • Paid Spaces
Tools & subscriptions
  • Features
  • Pricing
  • Market data
  • Gift plans
Trading
  • Overview
  • Brokers
  • Brokers comparison
  • The Leap
Special offers
  • CME Group futures
  • Eurex futures
  • US stocks bundle
About company
  • Who we are
  • Space mission
  • Blog
  • Help Center
  • Careers
  • Media kit
Merch
  • TradingView store
  • Tarot cards for traders
  • The C63 TradeTime
Policies & security
  • Terms of Use
  • Disclaimer
  • Privacy Policy
  • Cookies Policy
  • Accessibility Statement
  • Security tips
  • Bug Bounty program
  • Status page
Business solutions
  • Widgets
  • Charting libraries
  • Lightweight Charts™
  • Advanced Charts
  • Trading Platform
Growth opportunities
  • Advertising
  • Brokerage integration
  • Partner program
  • Education program
Community
  • Social network
  • Wall of Love
  • Refer a friend
  • House Rules
  • Moderators
Ideas
  • Trading
  • Education
  • Editors' picks
Pine Script
  • Indicators & strategies
  • Wizards
  • Freelancers
  • Paid Spaces
Business solutions
  • Widgets
  • Charting libraries
  • Lightweight Charts™
  • Advanced Charts
  • Trading Platform
Growth opportunities
  • Advertising
  • Brokerage integration
  • Partner program
  • Education program
Look FirstLook First