Long
Long
 Long
Long
 Short
Short
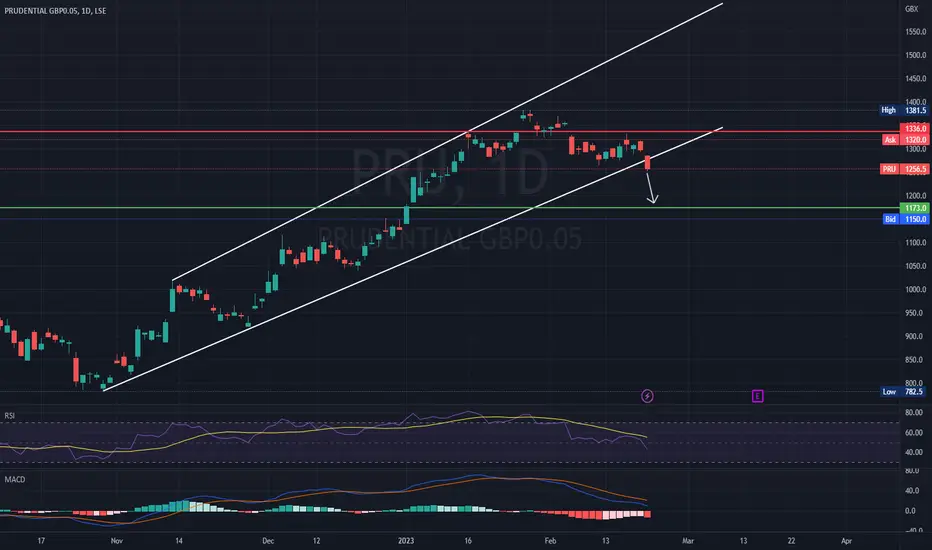
Prudential (PRU.l) bearish scenario:The technical figure Channel Up can be found in the daily chart in the UK company Prudential plc (PRU.l). Prudential plc is a British multinational insurance company. It was founded in London in May 1848 to provide loans to professional and working people. The Channel UP broke through the support line on 22/02/2023. If the price holds below this level, you can have a possible bearish price movement with a forecast for the next 25 days towards 1 173.20 GBX. According to experts, your stop-loss order should be placed at 1 336.00 GBX if you decide to enter this position.
Prudential's stock increased significantly by 41% over the past three months. But the company's key financial indicators appear to be differing across the board and that makes us question whether or not the company's current share price momentum can be maintained.
While the company does have a high rate of reinvestment, the low ROE means that all that reinvestment is not reaping any benefit to its investors, and moreover, its having a negative impact on the earnings growth.
Prudential's earnings have declined over five years, contributing to shareholders 21% loss.
Risk Disclosure: Trading Foreign Exchange (Forex) and Contracts of Difference (CFD's) carries a high level of risk. By registering and signing up, any client affirms their understanding of their own personal accountability for all transactions performed within their account and recognizes the risks associated with trading on such markets and on such sites. Furthermore, one understands that the company carries zero influence over transactions, markets, and trading signals, therefore, cannot be held liable nor guarantee any profits or losses.  Short
Short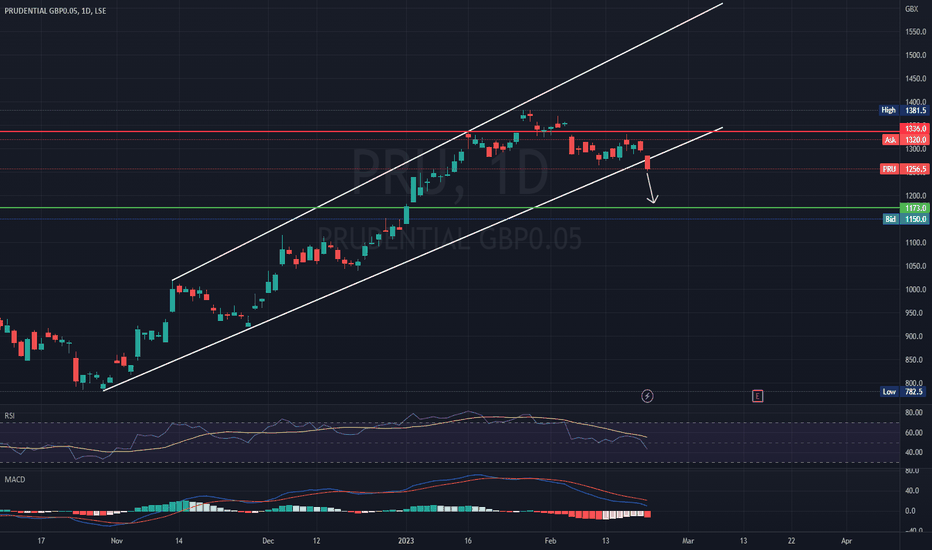
 Long
Long
 Long
Long
 Long
Long
Long 
Long 
 Long
Long
 Long
Long
 Long
Long
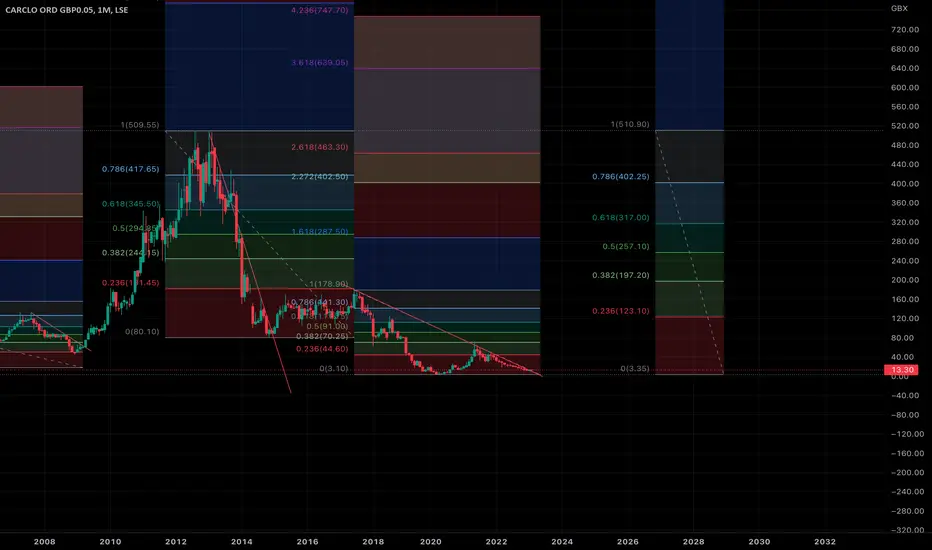
Breakout for a 2,200%-plus return?This is Carclo, an industrial share listed on the London Stock Exchange’s Alternative Investment Market. It looks like it is breaking out from a 68-month decline that, if the past is any guide, could return huge multiples on any investment at this stage.
Some of this company’s subsidiaries have been trading almost 100 years, but this century it has been a hugely volatile share. It began with the general market decline after the dotcom bubble at the turn of the millennium. A major slide in price was triggered in June 2000, bringing it down almost 90% from peak to trough across 33 months.
It took 26 months for the share to rebound to the 50% Fib (this share loves a Fibonacci level) and, after hitting resistance there, retraced to the .382 Fib where it bobbled along for the best part of a year. By August 2007 it had risen 650% from the bottom.
But then came a double top and another major decline, hitting resistance at the 50% Fib in September 2008 and setting eight months’ worth of relative equal highs from there. (A very nice trading range, that.)
Price reversed again at the .236 Fib and this was where the fun started. Across the next four years, Carclo rose 1,000%, trough to peak.
Since that January 2013 peak, another double top almost 10 years ago to the day, Carclo has been in seemingly terminal decline. There can’t be many bulls left to sell and you get the sense capitulation is around the corner.
Although there was a slight recovery in price from November 2014 to June 2017 (31 months), it met resistance at the .236 Fib and rolled over again. The peak-to-trough decline, at the nadir of the Covid lockdowns in 2020, was 99.19%.
But this is no junk share. It has had its problems with its pension liabilities and with debt but it has arranged new banking facilities with its lenders that give it good headroom. Net assets are almost £30m against a market cap of <£10m.
But the key thing is how *every single time* this share has opened on the monthly above the trendline after a multi-month decline, it has sparked a tremendous rally in price over the medium term. It opened above again yesterday. I’m eyeing as my first TP the 50% Fib on the most recent decline, where there are five months of relative equal highs to mitigate.
From there, a return to the .618 Fib on the broader, 67-month downtrend would also draw price to the monthly swing low and ICT fair-value gap from June 2013, which also remains unmitigated. And if you believe in cups and handles and head-and-shoulders patterns, there’s every reason to believe a C&H and inverse H&S could form very soon.
Hitting the .618 Fib at 317p would constitute a near 2,200% return for anyone investing today. Better still, given the current zeitgeist of war and ageing populations, Carclo’s specialisms (e.g. heavy-duty cabling for the aviation industry and technical plastics for the medical sector) could create a new era of enormous value for the business. Who’s to say it wouldn’t rocket beyond old support-and-resistance levels to make new ATHs?
After all, this share has made big, big moves before.
BUT DYOR. GLA.  Long
Long