• Products
  • Community
  • Markets
  • Brokers
  • More
Get started
  • Markets
  • /United Kingdom
  • /Stocks
  • /Ideas
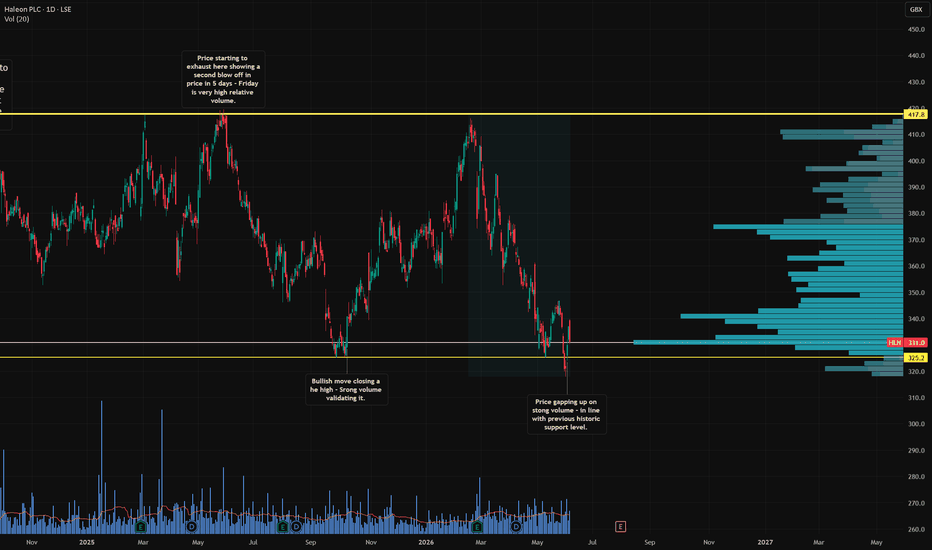
HLN sentiment changing, ready to trade back to the top?Another stopping volume style setup, just playing out over a longer timescale this time. This is effectively what Anna Coulling describes as a stop to the prevailing trend, where volume remains as high or even increases while the price simply refuses to fall any further. Since my last annotation on this one the downtrend has clearly halted, with a nice sideways consolidation now forming. Over the last week price action has tightened up further, with four sessions of above average volume backing it up. Zoom out on this chart and there is an extra layer of confidence too. This level also lines up with a previous area of support, adding further weight to the case. Could this work its way back to the top of the range? Price target: 415p Potential reward: 23%
LSE:HLNLong
by Stockso_Simple
FCH tight price compression a precursor to a 150p breakout?The price has started to curl upwards since the start of May and a couple of things are grabbing my attention. The rising lows are the first signal worth noting, and 150p looks like the key resistance point standing in the way. Friday’s price action was particularly tight, with a small rejection wick to the downside on volume that matched the much wider ranging candle from the day before. That is the kind of anomaly that suggests price compression rather than weakness. Overall this is starting to feel like it is coiling for a move higher. 160p is the next level to watch, but for the reward to genuinely justify the risk here I would be looking towards 176p. Price target: 175p Potential reward: 18%
LSE:FCHLong
by Stockso_Simple
WISE will go lower before reversalMy Elliott Waves count shows how the company sets itself to prosper long term. The chart magically reflects underlying strength of the business (sacrificing margins in favour of winning customers, building infrastructure, licensing banks I regions of presence, Nasdaq listing etc.) Leading diagonals refer to the patterns that imply explosive growth in the bigger structure. So blue wave (3) is supposed to be generous for investors. Near-term weakness, associated with the court case, will disappear once wave 5 of C of blue (2) is over. I think that at least 38.2% fibo of the diagonal shall be filled so it will go to at least as near as 705-690 GBX. Then reversal signs are anticipated. I will post long idea when it is time. Stay tuned.
LSE:WISE
by evgenii_tr_tech
ENOG is the sharp stopping volume wick a major turnaround sign?A fairly clean sign of stopping volume here. The price made a new low for the day but snapped back, leaving a clear rejection wick. Couple that with strong and rising volume and it starts to look like buyers are taking a renewed interest at this level. Worth noting the volume profile on the right hand side too, with volume actually increasing as the price has fallen, which is exactly the kind of anomaly worth paying attention to. Possible turnaround in play here. Let’s see how this one develops.
LSE:ENOGLong
by Stockso_Simple
National Grid (NG.) Daily: Bearish Channel Rejection SignalsNational Grid (NG.) Daily: Bearish Channel Rejection Signals Continued Downward Rotation toward $1,181 Support Cluster ### 🇬🇧 National Grid plc (NG. - LSE) Daily Technical Study (Ref: NG._2026-06-18_09-30-56.png) We are highlighting a structural trend setup on National Grid plc ( LSE:NG. - LSE) on the Daily (1D) timeframe. The utility asset is demonstrating clear technical adherence to a well-defined descending structural framework. The price action is currently trading down at **1,199.5 (-1.36%)**, validating a localised rejection at a key moving average intersection. --- ### 🔍 Technical Geometry & Trend Analysis: 1. **The Descending Channel:** The stock is structurally locked within a reliable **Bearish Channel** (delimited by the outer diagonal red lines). The upper boundary (LTB) has consistently functioned as a major institutional supply zone, capping any counter-trend breakout attempts. 2. **Dynamic Moving Average Resistance:** The recent local rally faced explicit rejection exactly at the **17-period EMA (red line at 1,216.7)**. Trading well below both this short-term filter and the long-term **72-period EMA (blue line at 1,250.5)** indicates that sellers remain in complete control of the order flow. --- ### 🎯 Downside Projections & Fibonacci Confluence: As the price rotates lower from the upper dynamic boundary, the path of least resistance points toward a retest of the immediate structural demand block: * **The Key Structural Floor:** The first line of defense for buyers sits at the heavy horizontal support level plotted at **1,181.5** (thick horizontal red line). * **The Fibonacci Cluster Confluence:** Directly intersecting this static support zone is the **0.382 Fibonacci retracement level at 1,178.0**, which aligns closely with the minor internal support line. Should selling pressure accelerate through this block, the next technical liquidity node rests at the **0.5 Fibonacci level (1,163.5)**. ### Operational Blueprint: The current stance remains defensive for long exposures. We are looking for price exhaustion and bullish volume absorption to materialize around the **1,181 – 1,178** confluence cluster before evaluating a potential low-risk, mean-reversion counter-trend setup. Until then, the structural trend remains entirely heavy. --- 📊 **ChartPro Data** | By Rogerio Zaglia *Utilities Sector Analysis, Trend Channel Dynamics & Mathematical Support Zoning.* ⚠️ **Disclaimer:** For educational and informational purposes only. This chart update represents a personal trading framework and does not constitute financial or investment advice.
LSE:NG.Short
by ChartPro_Data
LSE:GST--NASDAQ Spinoff-one to add to ur watchlist ## LSE:GST | 🚀 Massive NASDAQ Spinoff Catalyst vs. Key Structural Risks## The Setup: Mispriced Fintech & Cyber Play GSTechnologies (LSE: GST) is currently trading as a heavily watched micro-cap penny stock. However, a major corporate transformation is quietly playing out behind the scenes. While the market focuses on near-term volatility, the underlying value of its assets creates an asymmetric risk-to-reward setup for patient investors. ------------------------------ ## 🚀 The Bull Case Catalysts## 1. The $54M NASDAQ Spinoff Catalyst * Value Unlock: GST is preparing to spin off its machine-learning cybersecurity subsidiary, Semnet, onto the NASDAQ. * Massive Upside: The binding pre-IPO agreement values Semnet at US$54 million. * Asset Backing: GST owns a 66.67% stake, which translates to an implied valuation of US$36 million (£28M+). * The Valuation Disconnect: GST’s entire current market capitalization floats well below this asset value, presenting a major fundamental disconnect. ## 2. $10M Strategic War Chest Secured * Institutional Backing: GST recently secured a massive US$10 million unsecured loan facility from Clarivan Group. * Smart Money Connection: The lender's leadership has deep corporate ties to Semnet's CEO, indicating internal institutional confidence in Semnet's core technology and upcoming IPO. * Growth Fuel: This funding secures immediate general working capital and helps scale GST's wider UK AngraFX neobanking ecosystem. ## 3. Legal Cleanup De-Risks the IPO * Aggressive Defense: GST is actively pursuing US$4.2 million in damages against former management in the Singapore Supreme Court. * Court Victory: The court threw out the defendants' attempts to delay the trial, allowing the case to move forward rapidly. * Clean Cap Table: This swift legal progress ensures a clean, regulatory-ready structure that US institutional investors demand before a NASDAQ debut. * Risk Shielded: Listing partner TGC is footing up to US$2 million in IPO costs, keeping GST's core capital protected. ------------------------------ ## ⚠️ Risk Management & Bear Case Scenario To maintain a disciplined trading plan, watch these critical risk factors that could invalidate the bullish thesis: ## 1. Shareholder Dilution Risk * The Threat: The US$10 million loan features a clause allowing debt conversion into non-voting preference shares. * The Impact: Because GST shares trade in the low penny range, a full conversion by the lender could trigger equity dilution for existing retail shareholders. ## 2. Legal Deadlocks & IPO Delays * The Threat: A protracted, messy trial could drain management resources. * The Impact: US regulators (SEC) and NASDAQ underwriters require pristine corporate governance. Ongoing litigation regarding insider breaches could stall or postpone the IPO timeline. ## 3. Execution Risk in Regulated DeFi * The Threat: GST recently halted its standard crypto trading services to pivot fully toward "Regulated DeFi" (RegDeFi) compliance. * The Impact: Compliance pivots in the UK and Europe are notoriously slow. If AngraFX fails to rapidly scale its regulated payment volumes, the company will remain reliant on debt to fund operations. ------------------------------ ## 🎯 Bull vs. Bear Price Targets With the stock hovering near 0.45p following the fresh loan news, we have a clear trading plan based on structural support and major fundamental catalysts: 0.15p ------ 0.35p --------------------- 0.45p --------------------- 0.78p ------ 1.70p (52-W Low) (Stop/Invalidation) (Spot Price) (Mid-Target) (52-W High) * Target 1 (0.78p - Short-Term Breakout): The consensus analyst upper band for initial technical recovery. A breakout here marks the confirmation of a shifting trend as court directions lock in the trial timeline. * Target 2 (1.70p - The NASDAQ Rerating): This matches the stock's 52-week high. If the Singapore Supreme Court awards the US$4.2M in damages and the NASDAQ IPO goes live at the US$54M valuation, it could drive a fundamental rerating to this level. * Invalidation Zone (0.35p): Critical structural support line. A weekly close below 0.35p indicates that the market is pricing in either massive loan dilution or an impending regulatory delay to the Semnet spinoff. This serves as a key exit signal to protect capital. * Target 3 (0.15p - Absolute Floor): The asset's established 52-week low. This level would likely only be triggered if the listing agreement with TGC completely falls through or the Singapore trial ends in a legal defeat.
LSE:GSTLong
by Derrick_Johnson
Aston Martin ($AML): Bearish Compression Matrix – Wave 3 BreakdoAston Martin ( LSE:AML ): Bearish Compression Matrix – Wave 3 Breakdown Targeting the $35.00 Structural Floor ### 🇬🇧 Aston Martin Lagonda ( LSE:AML ) Daily Technical Matrix (Ref: AML_2026-06-17_09-03-56.png) We are releasing a structural equity study on Aston Martin Lagonda Global Holdings Plc ( LSE:AML - OANDA) on the Daily (1D) timeframe, flashing a highly defined bearish continuation blueprint. ### 📉 Macro Trend & Structural Compression The underlying trend for LSE:AML remains firmly **Bearish**. Price action continues to distribute well beneath its long-term institutional trend filters—the **200-period EMA (blue line at 56.49)** and the **72-period EMA (red line at 45.65)**. Currently, the price is undergoing an intense geometric squeeze, compressed between two major trendlines: 1. **Primary Descending Trendline (LTB):** The upper diagonal resistance line that consistently caps any counter-trend bullish rallies. 2. **Minor Ascending Trendline (LTA):** A short-term diagonal support line that is keeping the market temporarily afloat during this local consolidation phase. --- ### ⚡ The Wave 3 Breakdown Trigger (The $40.00 Zone) The market is rapidly approaching a major inflection point. We are systematically monitoring the horizontal and diagonal support cluster located in the **$40.00 zone**, which closely aligns with the **0.5 Fibonacci retracement level (39.62)**. * **The Trigger:** A clean, decisive daily candle close below this LTA and the $40.00 floor will officially invalidate the local consolidation and activate a powerful **impulsive Wave 3 downward expansion**. * **The Strategy:** Traders can monitor this breakdown node or wait for a structural retest of the broken support-turned-resistance to initiate high-asymmetry short positions. ### 🎯 Fibonacci Projection & Major Demand Confluence Once the breakdown is validated, the technical liquidity vacuum points directly toward our master downside targets: * **Fibonacci Target:** The **1.0 Fibonacci expansion node sits precisely at 35.18**. * **Structural Support:** This quantitative target sits directly within a historical macro demand zone, highlighted by the heavy horizontal support line at **35.72** (with major historical buying tails down to **35.40**). This $35.00 area represents a heavy institutional block where the bearish cycle is highly likely to encounter strong profit-taking and deceleration. --- 📊 **ChartPro Data** | By Rogerio Zaglia *Systematic Equity Architecture, Wave Principle & Fibonacci Projections.* ⚠️ **Disclaimer:** For educational and informational purposes only. This technical study represents a personal trading framework and does not constitute financial or investment advice.
LSE:AML
by ChartPro_Data
EMG could clearing overhead supply ignite a fresh rally?Very clear breakout from Man Group this week. Keeping things simple here, on Tuesday the price broke free of its overhead resistance around 285p. Not only that, but the stock gapped up on the open and continued to rise throughout the day to finish 3.3% up. The effort required to clear out any remaining sellers was nearly 3x the average volume, representing around £24m worth of transactions. This is now trading at a 52-week high. With the heavy overhead supply officially cleared out of the way, momentum could easily allow this to continue upwards from here.
LSE:EMGLong
by Stockso_Simple
JSG could a failure at the old ceiling trigger a deep slide?Price has come back up to revisit an old resistance ceiling which it has touched around three times in the past. Tuesday saw the price open right at this level, only to trigger a fast sell-off on a huge spike in volume. The size of this daily candle completely engulfed the previous day’s entire trading range. In VPA terms, a bearish engulfing pattern on high effort is a clear signal of structural weakness. I am always more conservative when highlighting shorting opportunities because the risks involved can increase massively. If you are going to play the short side, I highly recommend using guaranteed stops. Could this massive volume spike be indicative of further falls ahead? The line in the sand is very clearly defined at that old ceiling.
LSE:JSGShort
by Stockso_Simple
On the Beach (OTB) - recovery on IF there's an Iran DealA break above 50 day moving average and previous resistance will continue if there looks like a deal happening in Iran. This is also be backed up by fundamentals, forecast profit for 2027 & 2028 puts this on a PE of 9 & 5 based on net profit growth of 100% & 62%.
LSE:OTBLong
by JustinWelshy
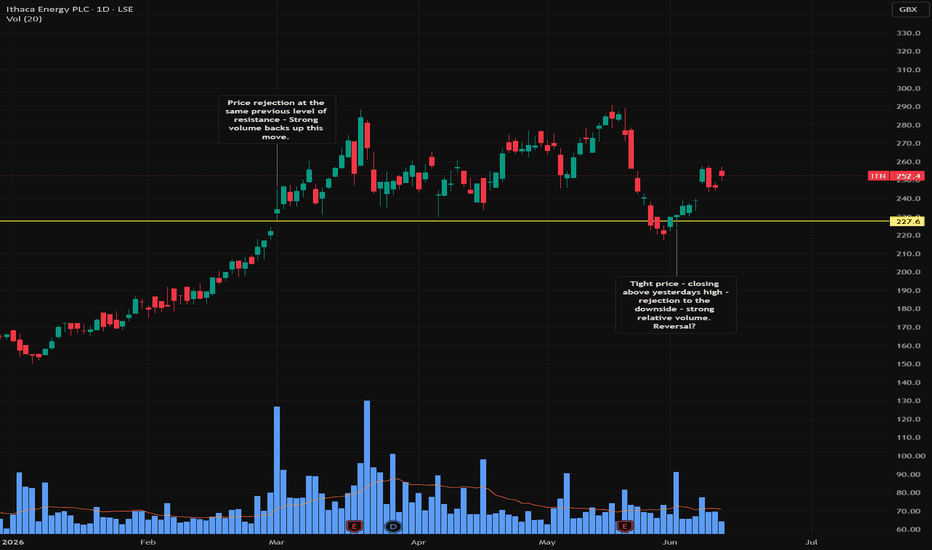
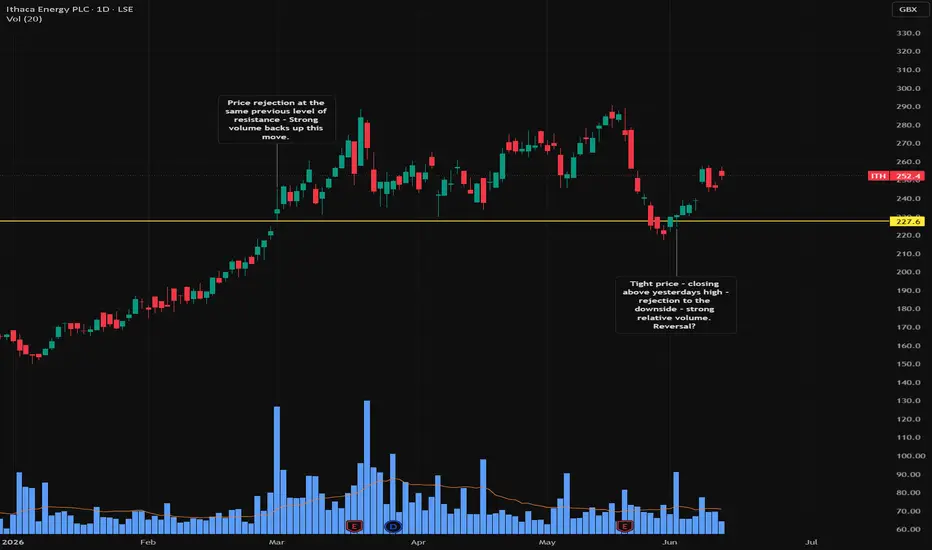
ITH will the 2.25x volume floor spark a 21% run?Very interesting setup forming out here. What historically looked like a major resistance level, formed by that nasty gap down during November last year, looks like it has now flipped to become a reliable support area for the price to rebound from. After pushing right through 230p and tagging recent highs of 290p, the price has since drifted back down to test this key floor roughly three times. Tuesday’s session was a clear sign that someone was showing their hand. The price exhibited some really tight compression and was firmly rejected on the downside on 2.25x the average volume. That tells me the buyers were sitting there supporting the price, quietly absorbing the selling pressure at the key level. We could be looking at a major change of sentiment right here at the floor, and the price could easily gear up to retest those recent highs. Definitely one to watch. Price target: 290p Potential reward: 21%
LSE:ITHLong
by Stockso_Simple
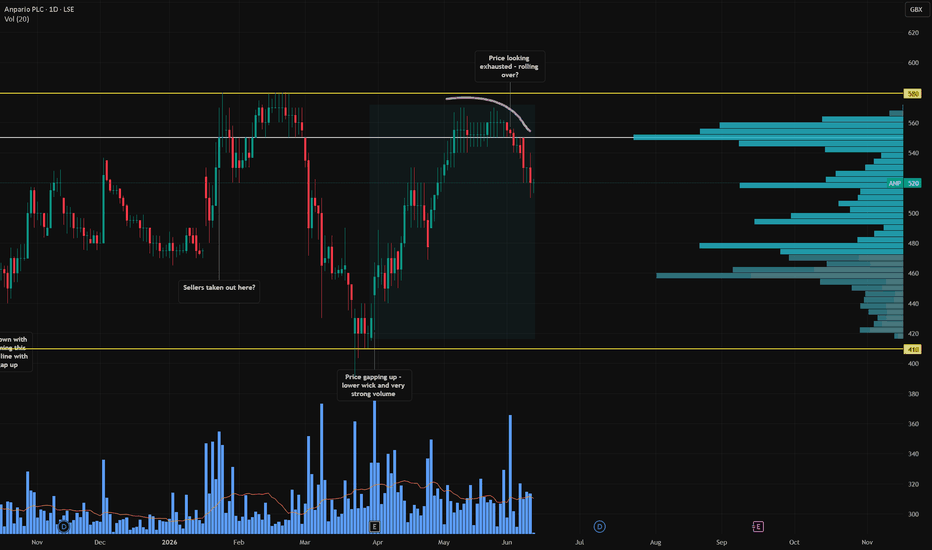
ANP is the five-day lower high streak a warning of a deeper dropLooks like more price weakness here with Anpario. Over the past week the price has really started to roll over, and taking into account the volume profiles on the right hand side, this looks like a significant price level where investors have heavily transacted. For five days straight, the price has made continued lower highs. Could this indicate that larger holders are scrambling to reduce their positions before a deeper drop? Taking a closer look at the resistance level here also reveals something quite telling. Previously back in February, the price touched 580p. This time around, however, it completely failed to push that high. Sellers greeted the move with more stock well before it could get there, showing a clear lack of demand. Prices could continue to fall here for some while yet.
LSE:ANPShort
by Stockso_Simple
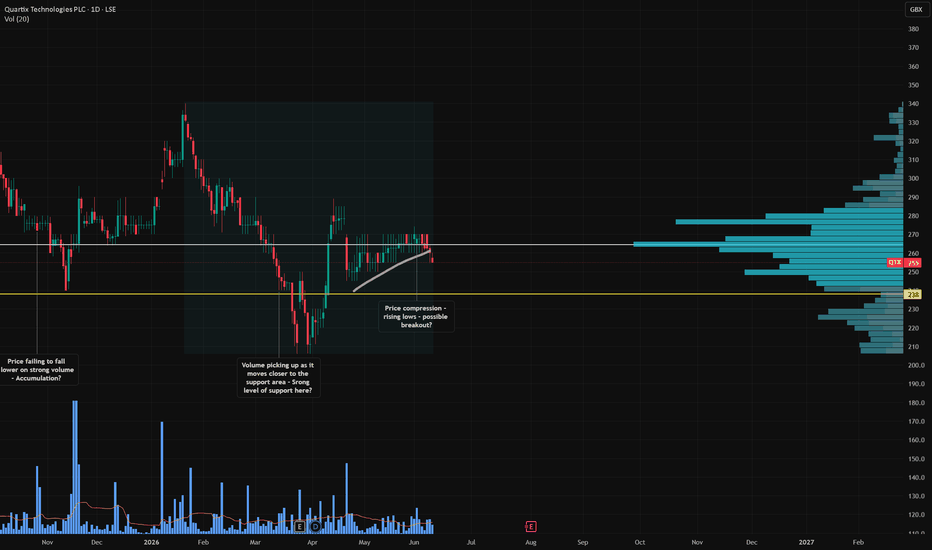
QTX the mid-range price compression trigger a 21% run to 335p?While being mindful that the price has fallen from its highs since the start of the year, we are now looking at some very interesting price compression right in the middle of the range. Historically, trading right in the middle of a range doesn’t normally yield great rewards for me. I much prefer taking positions right at the edges where the risk is defined. However, as noted by my purple annotation, there is a very clear pattern of rising lows forming here. To my eye, this is a classic Wyckoff signal that floating supply could be drying up. Naturally, the heavy buyers want to accumulate at the absolute lowest prices possible, so a series of rising lows suggests these “cheaper” prices are getting snapped up aggressively before they can drop further. This doesn’t mean the price couldn’t just tank right here, anything can happen. But my money is pricing this to clear the compression and break upwards toward 275p. I am more than happy to take a small, defined loss to find out if the this theory is right. Price target: 335p Potential reward: 21%
LSE:QTXLong
by Stockso_Simple
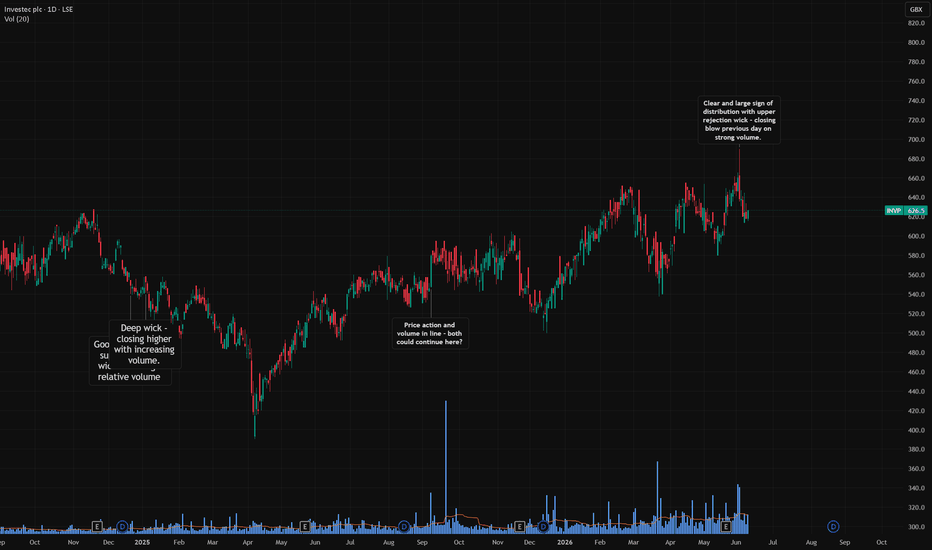
INVP 2.5x volume anomaly a warning of institutional distributionEven though I have added an annotation pointing out that massive rejection wick to the upside on high volume, take a look at the session right before it. We have an average-sized green day, with the price only moving around 2%. But look at the volume bar below it, it is a staggering 2.5x the volume of the prior day. This is a textbook price and volume anomaly. Why did it take so much effort to only move the price a measly 2%? The only logical read is that institutional holders were aggressively unloading their blocks directly into that retail rise, absorbing the demand. The stock has since sold off even further, confirming the distribution. However, given it remains locked in a clear, long-term uptrend, this could just be natural profit-taking before it settles.
LSE:INVPShort
by Stockso_Simple
CRDA - Long (UK LSE)Long CRDA Price is back at historical levels and retraced to deep value fib levels Sellers have failed to break down Worth taking a shot 2 take profits 10% Stop Loss
LSE:CRDALong
by StockHog100
Updated
SAA: classic distribution as buyers run out of steamThe trend looks like it is coming to an end here. Zooming in to the detail, there are clear signs that the effort to push this higher is exhausting. Prices have failed to make new highs since the 21st of May, carving out a slow series of lower highs instead. To me, that is a classic sign of distribution, there is a bit more desperation creeping in from the sellers to exit. Thursday’s price action was the real giveaway. We saw a massive amount of effort on the day with 6x the average volume, yet the result was a 3.5% drop right into the dead low of the session. That is serious price weakness. It feels like the sellers are firmly in control now, and this could continue downwards for some while yet.
LSE:SAAShort
by Stockso_Simple
HLN is the 325p volume spike a sign of institutional absorption?Got a very long and drawn-out trading range here that poses another potential reversal opportunity. This popped up on my evening screener on Thursday. The price gapped up in the morning and kept climbing to close up 2.7% on the day. After a long trend down, that immediately catches the eye. When you look at image you can see that move happened right in line with a previous historic support level around 325p. Throw in the solid volume spike that came with it, and it really adds to the notion that the institutions are finding value at this floor. Classic Wyckoff accumulation behavior. Friday made another nice move up, but the volume dropped off a bit. Effort didn’t quite match the result there, so it is one to watch. Putting the fundamentals to one side, a trip back to the top of the range could easily take three to four months. That said, the reward still looks decent for that kind of timeframe. The 325p floor is our obvious line in the sand. Price target: 410p Potential reward: 21%
LSE:HLNLong
by Stockso_Simple
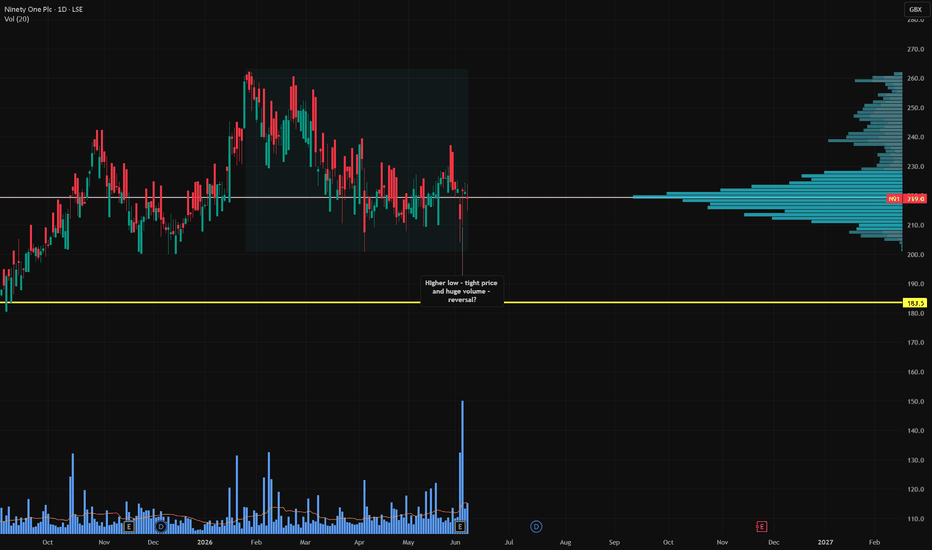
N91 Huge Thursday volume a sign of genuine institution support?Thursday looked like a significant day of trading with massive volumes transacting, even though this was a day after they released their results. Effectively it gapped up on the day, tried to sell off but it looks like it was his by a wave of buyers, with the price retracing back to near the open. Volumes were very high indicating that the buying here was genuine. Looks like a solid base forming, might be able to make its way back up to the recent highs? Price target: 260p Potential reward: 17.4%
LSE:N91Long
by Stockso_Simple
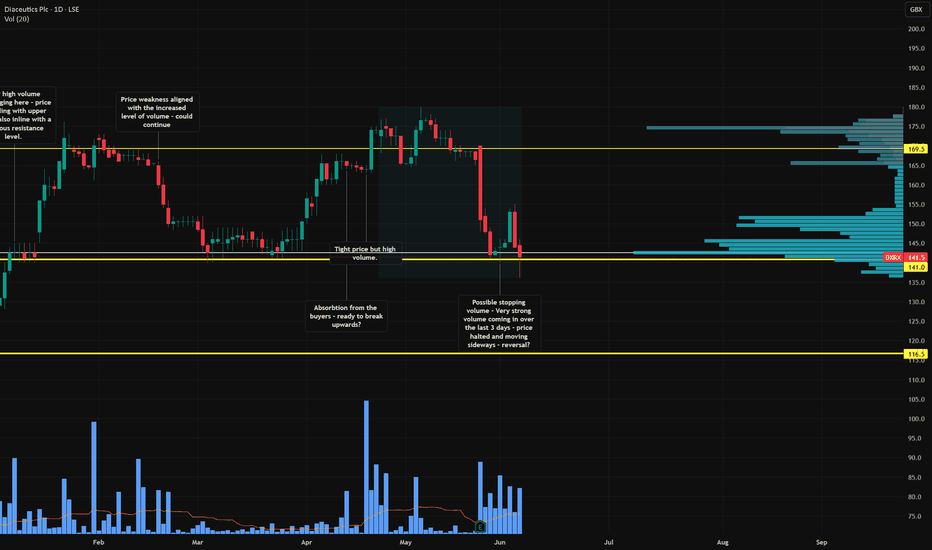
DXRX: heavy volume, no sell-off—buyers are absorbing the supply?A well formed trading range and the price is currently flirting with the 141p support level, which has had three notable interactions in the past. That kind of repeated testing of the same level is always worth paying attention to. This came up on my screener on Monday evening as the price stubbornly closed near its open on solid volume. Since then volume has been elevated for nine consecutive sessions and yet the price refuses to sell off. That is a significant detail. When sustained above average volume fails to push a price lower, the most logical explanation is that buyers are absorbing every sell order being thrown at them. The risk reward setup here also looks favourable. With a stop placed below the recent rejection wick around 134p, the ratio works out at approximately 1:2.9. Risking £1 for a potential return of £2.9 Everyone has a different risk profile of course, but for me that is a setup worth considering. Price Target: 175p Potential Reward: 22.5%
LSE:DXRXLong
by Stockso_Simple
NCC 6.4x volume spike a sign that supply has dried up?A clear series of rising lows building over the last couple of weeks, which is always an encouraging sign that supply is gradually drying up. Then Friday delivered an extraordinary volume spike of 6.4 times the average. That is not a quiet day by any stretch. The volume profile on the right shows a significant concentration of activity weighted around the current price level, suggesting there is real participation and interest here rather than just noise. The question now is whether this can build enough momentum to retest the highs around 160p. Price target: 160p Potential reward: 12.13%
LSE:NCCLong
by Stockso_Simple
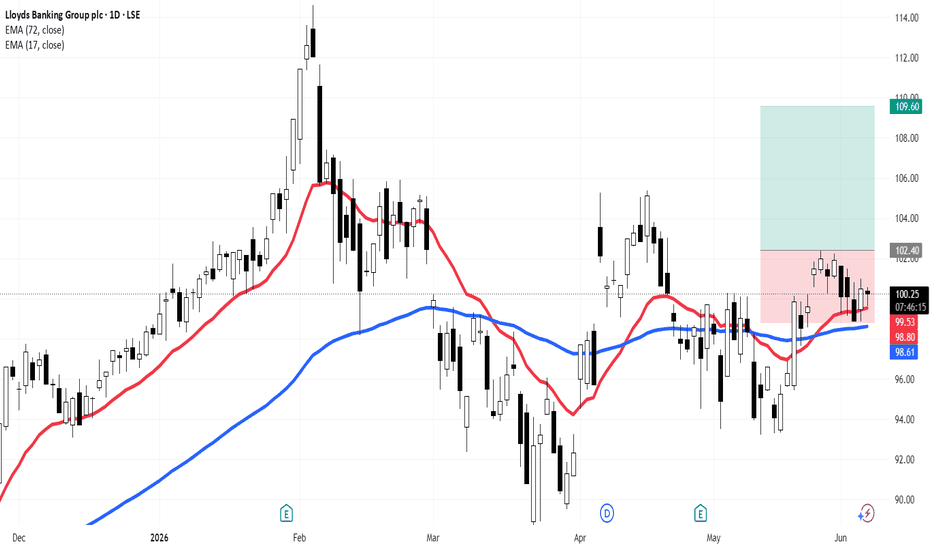
Lloyds (LLOY) Daily: Swing Setup Guided by 17/72 EMA Alignment &We are introducing an educational swing trading model on Lloyds Banking Group plc ( LSE:LLOY - LSE) utilizing a robust dual-EMA framework on the Daily (1D) chart to capture the next structural expansion leg. For this study, we are tracking momentum using the **17-period Exponential Moving Average (17 EMA - red line)** and the **72-period Exponential Moving Average (72 EMA - blue line)**, which serve as highly reliable trend filters for medium-term swing positions. ### Structural Framework & Technical Indicators: * **The Dynamic Realignment:** After an extended period of consolidation and noise throughout April and May, the technical picture has cleared. The faster **17 EMA (98.52)** has successfully established a bullish cross above the slower **72 EMA (98.22)**. * **The Support Cluster:** Price action is currently consolidating healthily right above this dynamic baseline, validating that institutional buyers are actively defending the newly formed accumulation floor. ### The Trade Execution Matrix: The long position tool on the chart outlines a highly disciplined breakout execution framework: 1. **The Entry Trigger:** The setup activates upon a clean daily break above the recent local structural top at **102.40**, signaling an official expansion drive. 2. **The Risk/Reward Parameters:** A precise **2.0X Risk/Reward ratio** is projected: * **Stop Loss:** Firmly set at **98.80** (3.60p / 3.516%), structurally protected right below the dual-EMA support cluster. * **Full Target (2.0X):** Projected at **109.60** (7.20p / 7.031%) into historical liquidity pools. ### Professional Position Management Blueprint: To eliminate emotional bias and secure portfolio equity against sudden market rotations, we apply a strict fractional exit playbook: * **Partial Take-Profit 1 (1.0X):** Upon reaching a 1:1 risk-to-reward ratio, exactly **50% of the position size** is closed to lock in localized gains. * **The Break-Even Adjustment:** Simultaneously, the Stop Loss for the remaining 50% is trailing-shifted directly to the **entry point (102.40)**, establishing a completely risk-free position. * **The Target Run:** The remaining half of the asset is left running to capture the maximum mathematical expansion toward the ultimate **109.60** target wall. Let the market bring the volume and trigger the structural levels before initiating risk. --- 📊 **ProData Chart** | By Rogerio Zaglia *Swing Trading Architecture, Technical Analysis & Risk Management.* ⚠️ **Disclaimer:** For educational and informational purposes only. This study does not constitute investment advice or trading recommendations. Past performance is not indicative of future results.
LSE:LLOYLong
by ChartPro_Data
NCC huge 6.4x volume spike a sign that supply has dried up?A clear series of rising lows building over the last couple of weeks, which is always an encouraging sign that supply is gradually drying up. Then Friday delivered an extraordinary volume spike of 6.4 times the average. That is not a quiet day by any stretch. The volume profile on the right shows a significant concentration of activity weighted around the current price level, suggesting there is real participation and interest here rather than just noise. The question now is whether this can build enough momentum to retest the highs around 160p. Price target: 160p Potential reward: 12.13%
LSE:NCCLong
by Stockso_Simple
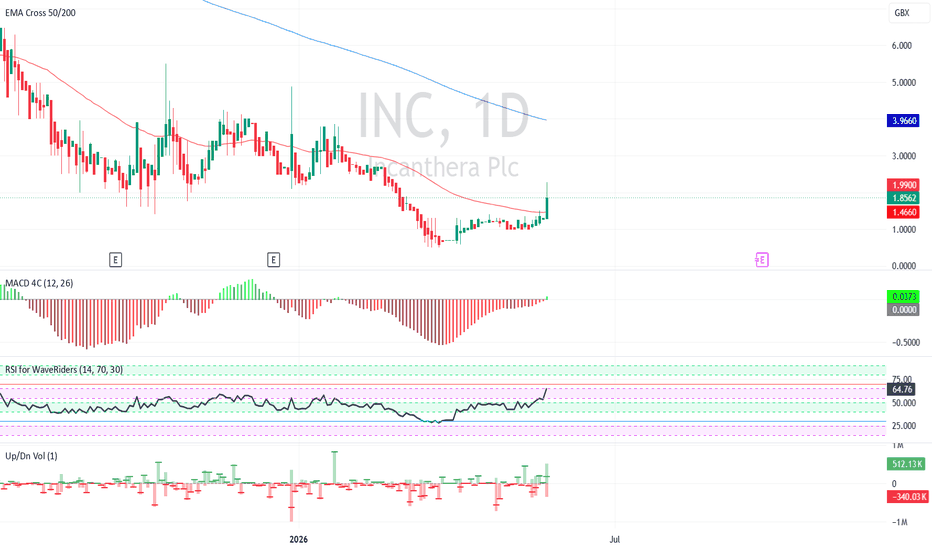
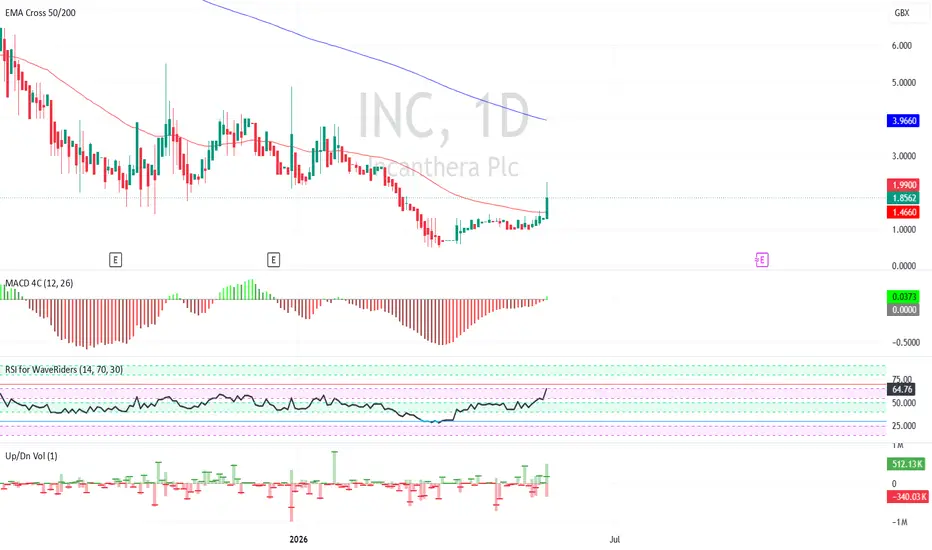
£INC.PL (Incanthera) – Micro-Cap Turnaround Play £INC.PL (Incanthera) – Micro-Cap Turnaround Play Poised for a Rebound! 🚀 The Catalyst: The failed Marionnaud deal is firmly in the rearview mirror. Incanthera has initiated a major corporate reset with the acquisition of premium Swiss skincare brand Énielle in an all-share transaction. Why the Bull Case is Strengthening: Unlocking High-Value IP: The combined entity brings together Incanthera’s patented dermal delivery platform and "Sol" skin cancer prevention formulation (protected to 2040) with Énielle’s T-Mero-Protect® anti-senescence cellular technology. New Elite Leadership: A complete board refresh. Énielle founder Stuart Robertson (ex-EY, Accenture, CK Hutchison) steps in as CEO to drive an aggressive multi-channel commercial rollout. Skin in the Game: Robertson has backed the turnaround with a £250k convertible loan, with compensation tied to strict revenue milestones. Asset-Light Efficiency: No costly retail footprint. A lean 8-person team leveraging Swiss lab partner Frike Cosmetic and outsourced 3PL fulfilment. Immediate Revenue Potential: Over 6,000 premium finished serum units ready for near-term monetisation via retail and digital channels. Low Liquidity Setup: Trading volume remains extremely light, which amplifies volatility—small inflows have already driven sharp moves and could accelerate upside if momentum builds. The Setup: With a tiny ~£1.76M market cap and shares already jumping as much as 41% on Aquis following the deal news, this is a classic high-risk, high-reward turnaround. If the new team executes commercially, the asymmetric upside could be significant. 📈
AQUIS:INCLong
by Derrick_Johnson
112233445566778899101011111212131314141515161617171818191920202121222223232424252526262727282829293030313132323333343435353636373738383939404041414242
…999999

Made by humans

Select market data provided by ICE Data Services. Select reference data provided by FactSet. Copyright © 2026 FactSet Research Systems Inc.Copyright © 2026, American Bankers Association. CUSIP Database provided by FactSet Research Systems Inc. All rights reserved. SEC filings and other documents provided by Quartr.© 2026 TradingView, Inc.

More than a product
  • Supercharts
Screeners
  • Stocks
  • ETFs
  • Bonds
  • Crypto coins
  • CEX pairs
  • DEX pairs
  • Pine
Heatmaps
  • Stocks
  • ETFs
  • Crypto coins
Calendars
  • Economic
  • Earnings
  • Dividends
  • IPOs
More products
  • Portfolios
  • Fundamental Graphs
  • Yield Curves
  • Options
  • Macro Maps
  • Pine Script®
  • MCP Server
Apps
  • Mobile
  • Desktop
Community
  • Social network
  • Wall of Love
  • Refer a friend
  • Creator program
  • House Rules
  • Moderators
Ideas
  • Trading
  • Education
  • Editors' picks
Pine Script
  • Indicators & strategies
  • Wizards
  • Freelancers
  • Marketplace
Tools & subscriptions
  • Features
  • Pricing
  • Market data
  • Gift plans
Trading
  • Overview
  • Brokers
  • Brokers comparison
  • The Leap
Special offers
  • CME Group futures
  • Eurex futures
  • US stocks bundle
About company
  • Who we are
  • Space mission
  • Blog
  • Help Center
  • Careers
  • Media kit
Merch
  • TradingView store
  • Tarot cards for traders
  • The C63 TradeTime
Policies & security
  • Terms of Use
  • Disclaimer
  • Privacy Policy
  • Cookies Policy
  • Accessibility Statement
  • Security tips
  • Bug Bounty program
  • Status page
Business solutions
  • Widgets
  • Charting libraries
  • Lightweight Charts™
  • Advanced Charts
  • Trading Platform
Growth opportunities
  • Advertising
  • Brokerage integration
  • Partner program
  • Education program
Community
  • Social network
  • Wall of Love
  • Refer a friend
  • Creator program
  • House Rules
  • Moderators
Ideas
  • Trading
  • Education
  • Editors' picks
Pine Script
  • Indicators & strategies
  • Wizards
  • Freelancers
  • Marketplace
Business solutions
  • Widgets
  • Charting libraries
  • Lightweight Charts™
  • Advanced Charts
  • Trading Platform
Growth opportunities
  • Advertising
  • Brokerage integration
  • Partner program
  • Education program
Look FirstLook First