Long
Long
 Long
Long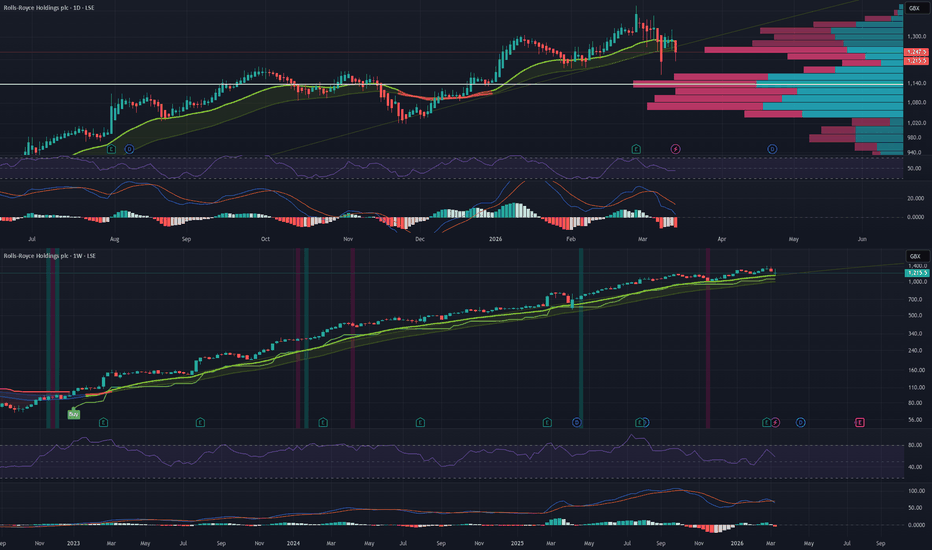
0HAC - International Infrastructure HeavyweightACS Group has had a great run over the last year, putting in a steady gain of roughly 100% . Based in Spain but operating globally through major subsidiaries like Turner and Hochtief, they are a dominant force in international engineering and construction .
Fundamentally, this strong momentum is being driven by a massive surge in their global order backlog , particularly in next-generation projects like AI data centers, high-speed rail, and healthcare facilities . They recently reported a 15% jump in net profit for 2025, hitting €950 million alongside confident guidance for the rest of 2026.
What sort of projects? How about a dry dock for nuclear submarines at the Pearl Harbor Naval Shipyard (Hawaii) . The U.S. Department of Defense has awarded Dragados USA a $2.84 billion contract to build a new dry dock for the maintenance and repair of nuclear submarines in the Pacific Fleet at the Pearl Harbor Naval Shipyard in Hawaii. The project is expected to be completed in September 2027.
Looking at the yearly chart at the top of the page, this pullback has brought the price down into a much better value area. It has perfectly tagged and bounced off the 20-day SMA (the green line), which has acted as a reliable short-term floor during this steep uptrend. The RSI has cleanly reset from overbought territory back down to around 59 and is starting to hook back up to attract new buyers. While the MACD is still crossed down, the histogram is showing lighter red bars, suggesting the recent selling pressure is already fading.
Could be one to keep an eye on.
..................................................
PLEASE NOTE: Nothing I post is trading advice. All investing involves risk, and past performance doesn’t predict future results. Trends can and do end. For 2026 , my goal is to try and post one new asset each trading day. Something outside the usual gold, silver, BTC, or big tech names. I like to find stocks worldwide showing steady trends with some good gains, a recent pullback, and signs of renewed strength. I don’t necessarily hold positions in these. They are simply companies I find interesting at the time of posting. I’ll often revisit them within a week to see how they went and share any updates. If you enjoy these posts, please BOOST and FOLLOW ME to discover more under-the-radar stocks and businesses from around the world.
..................................................  Long
Long
 Long
Long
 Long
Long
$VTU UK's Most Undervalued Car Dealer at a 20-Yr Demand ZoneThis is the longest timeframe setup in this entire war watchlist a monthly chart going back to 2007 on one of the UK's most overlooked small cap plays.
Vertu Motors is the UK's fourth largest automotive retailer, trading at just 60p with a P/E ratio of 10, a dividend yield of 3.28%, and a net income that just jumped from £2.15 million to £14.27 million in a single reporting period.
And the chart is sitting at a demand zone that has only been visited twice in 20 years.
Here is why the Iran war makes this trade even more compelling right now:
Oil prices are surging toward $100 a barrel. That means fuel prices across the UK are about to spike hard. When fuel costs rise, consumer appetite shifts dramatically away from fuel-heavy vehicles and toward more efficient ones.
Vertu's franchise dealerships include Toyota, Honda, Kia, Hyundai, MG, and BYD precisely the brands that benefit most from a fuel cost shock. This is a war-driven tailwind hiding inside a stock almost nobody is covering.
The technical buy signal on daily moving averages is currently rated Strong Buy. The analyst price target sits at 78-80p, representing over 30% upside from current levels. The next earnings report is May 13, 2026 giving this trade a clear near-term catalyst.
Nivag Holdings recently increased its stake to 6% of voting rights, signalling insider confidence at these levels.
Two operations directors also purchased shares through the company's share scheme recently.
Revenue TTM sits at £4.44 billion. EBITDA is £99.98 million. This is a profitable, cash-generating business trading at a fraction of its intrinsic value with a 20-year monthly chart that says the floor is right here.
🟢 Buy Zone Current Level (32p area)
This is a single high-conviction entry on the monthly chart at a 20-year demand zone. Price is deep in the 0.236 Fibonacci level, with the long-term ascending channel offering structural support.
Stop: 5.00p below entry (15.480%) /
Risk/Reward Ratio: 11.28
Target: +174.613% (88.7p area / Amount: £1,064,000)
Key Levels:
🔑 Current Price: 60p
🔑 Buy Zone: ~32p
🔑 52-Week High: 67p
🔑 52-Week Low: 47.15p
🔑 All-Time High: 103p (Feb 2007)
🎯 Analyst Target: 78-80p
🎯 Full Extension Target: 88.7p (+174% from buy zone)
🎯 Target Amount: £1,064,000
⚠️ Hard Stop: 5p below entry (15.48%)
This is not a trade for those looking for a quick flip. This is a monthly chart position targeting a multi-year move back toward the top of a 20-year range.
The Iran war, rising fuel prices, and a shift toward efficient vehicles all point to Vertu's brand mix being in exactly the right place at exactly the right time.
Small cap. Long timeframe. Enormous R/R.  Long
Long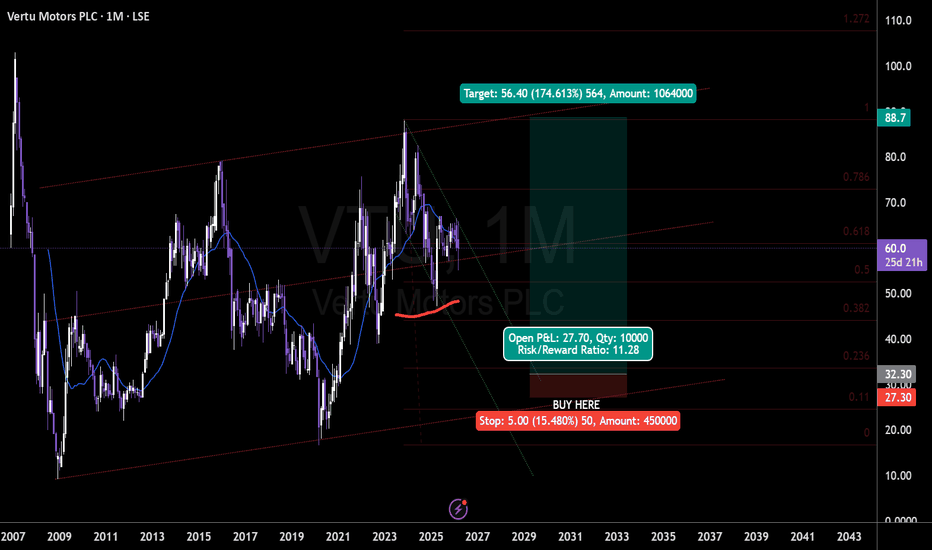
Long 
 Long
Long
 Short
Short
Diageo:Bitter toast for shareholders,strategic pivotDiageo: Bitter toast for shareholders, strategic pivot for the future
By Ion Jauregui – Analyst at ActivTrades
Diageo Diageo faces a moment of truth. The giant behind Johnnie Walker and Guinness has started 2026 with a move that does not leave anyone indifferent: a dividend cut and a more aggressive pricing strategy to regain market share. A clear message: shareholder payout takes a back seat to financial stability and competitiveness.
The new CEO is not here for window dressing. After a period of weak sales and margins under pressure, the priority is to preserve cash and recover volume. Consumers are more selective and distributors are tightening, and maintaining the dividend would have been just a temporary patch. What Diageo is aiming for is deeper: rebuilding its growth cycle from the ground up. The market reacted quickly. The stock suffered immediate pressure.
The dividend cut impacts the yield and, by extension, Diageo’s perception as a defensive stock. However, the measure frees up liquidity to face a weaker consumption environment and protect margins. It is a tactical sacrifice: less immediate return, but greater flexibility to defend market share and reposition brands.
Compared to its peers, Diageo maintains an advantage in scale and diversification. Pernod Ricard keeps somewhat more stable forecasts, while Rémy Cointreau suffers more from the slowdown in the U.S. and China. But Diageo’s move is more direct: it is not about waiting for the market to adapt, but about taking control of the cycle, even if it unsettles shareholders.
Technical Analysis – Diageo (Ticker LSE: DGE)
After a couple of years under bearish pressure, Diageo suffered a strong hit yesterday: the stock fell -16.2%, closing at recent lows of 1,554 GBp. Today’s opening has been positive following management’s comments, though the overall feeling remains cautious.
The stock’s point of control is around 1,734 GBp, a mid-range level that has served as a reference from September 2025 until now. Currently, the price seems to be forming a third floor, which, if it consolidates, could allow a rebound toward the point of control, despite the long-term bias remaining bearish and the short-term bias staying neutral‑bearish.
If the strong support at yesterday’s lows holds, we could see a gradual recovery toward 1,824 GBp, coinciding with the 200-day moving average and previous consolidation reference. Conversely, if it fails, the stock could enter a free-fall phase, with no prior floors to stop the pressure.
Regarding indicators, moving averages show no clear trend change, the RSI is in moderate oversold territory at 36.86%, and the MACD remains in negative territory with a descending histogram. The ActivTrades Europe Market Pulse indicator reflects neutrality, showing neither capitulation nor buying euphoria.
In summary, the technical signal is clear: there is no definitive capitulation, but neither are there signs of a structural reversal. Investors are watching and waiting, measuring every move while the company navigates a scenario of strategic adjustment and elevated volatility.
The thesis is clear: it is not a sweet toast, but it is necessary.
The real question for investors and analysts is not whether the dividend was sustainable, but whether the company will manage to regain traction before the market loses patience. In a sector where competition tightens and consumers do not forgive, the dividend cut and pricing aggressiveness could mark the beginning of a stronger cycle. Diageo is not toasting for the short term; it is rebuilding its future.
*******************************************************************************************
The information provided does not constitute investment research. The material has not been prepared in accordance with the legal requirements designed to promote the independence of investment research and such should be considered a marketing communication.
All information has been prepared by ActivTrades ("AT"). The information does not contain a record of AT's prices, or an offer of or solicitation for a transaction in any financial instrument. No representation or warranty is given as to the accuracy or completeness of this information.
Any material provided does not have regard to the specific investment objective and financial situation of any person who may receive it. Past performance and forecasting are not a synonym of a reliable indicator of future performance. AT provides an execution-only service. Consequently, any person acting on the information provided does so at their own risk. Political risk is unpredictable. Central bank actions can vary. Platform tools do not guarantee success.
 Short
Short
 Long
Long
Rolls-Royce Accelerates: Million-Pound Buyback& Industrial ShiftRolls-Royce Accelerates: Million-Pound Buyback, Industrial Shift and Technical Strength at Highs
By Ion Jauregui – Analyst at ActivTrades
Rolls-Royce Holdings could announce, together with its annual results, a new share buyback program of up to £1.5 billion (≈ $2.0 billion), according to its latest report. This program would reinforce management's confidence in the company's cash-generating potential after a year with improved forecasts for operating profit (up to £3.2 billion) and free cash flow (£3.1 billion), and a buyback program already executed of £1.0 billion in 2025.
Production Relocation and Industrial Strategy
Beyond the financial component, Rolls-Royce has been adjusting its global industrial footprint. Historically concentrated in the United Kingdom and the U.S., the company has moved parts of its production and supply chain outside the United States to countries in Europe, Asia, and the Middle East to reduce exposure to trade tensions, manage costs, and gain preferential access to markets where demand for civil aviation and defense is accelerating. This diversification of operations is part of a broader plan for operational resilience and margin optimization.
In parallel with its financial discipline, Rolls-Royce Holdings has accelerated in recent years a strategic adjustment of its industrial footprint, moving part of its production and engineering capabilities outside its traditional centers in the United Kingdom and the United States. The group has consolidated in Singapore one of its main Asian hubs for manufacturing and assembling Trent engines, including the production of critical components such as titanium fan blades, while in India it has strengthened its technology center in Bengaluru and expanded agreements with local suppliers to increase the supply of aerospace components. In continental Europe, Germany continues to play a key role through its industrial subsidiary, especially in power systems and defense. This geographic diversification responds to a strategy aimed at improving margins, reducing geopolitical and commercial risks, and bringing production closer to markets with higher structural growth in civil aviation and defense spending, thus strengthening the resilience of its global supply chain.
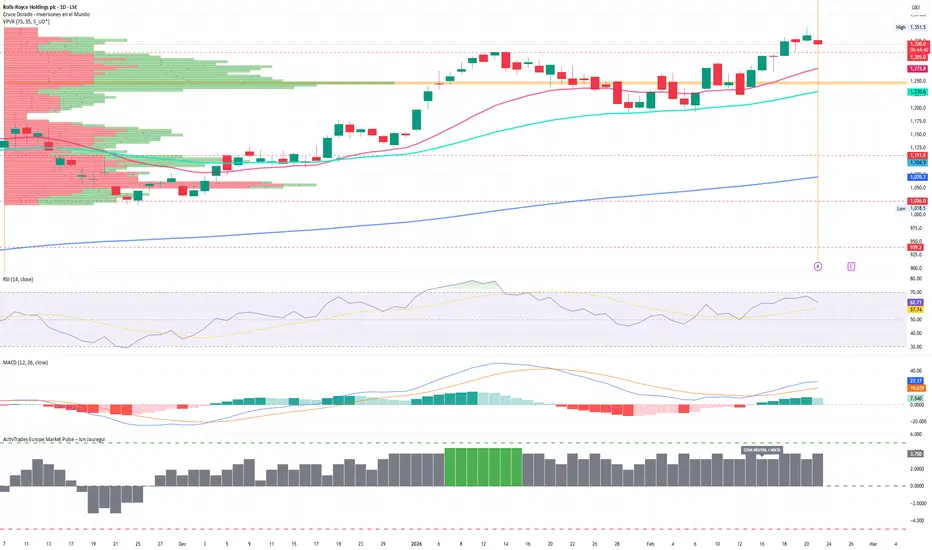
Technical Analysis (Ticker AT: RR.UK)
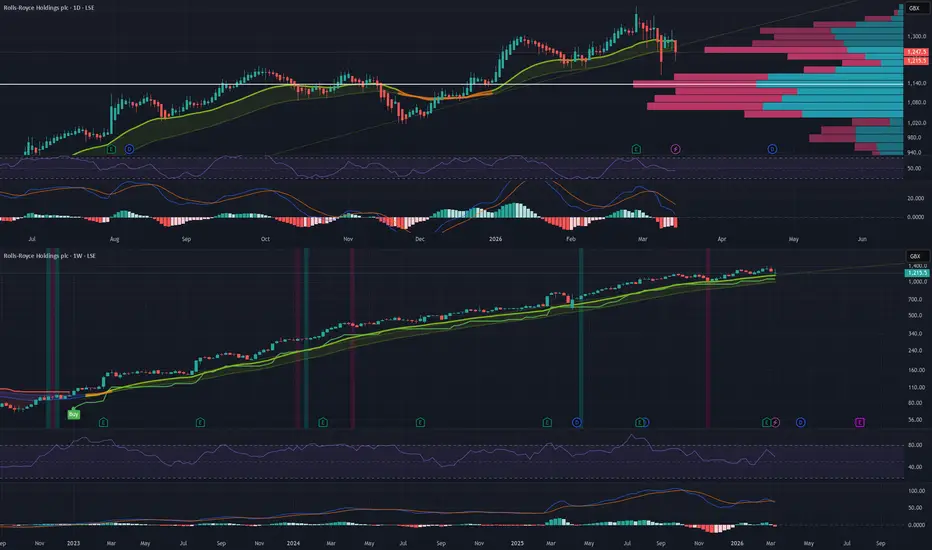
On the British stock market, the stock’s technical behavior is supported by its optimism. Shares are trading in a clear long-term bullish structure, remaining above the main 50, 100, and 200 moving averages, which continue to slope upward, with the price pushed above the 100-day moving average, which supports around 1,200 pence. Both in the short and medium term, the trend is clearly bullish and near record highs, with Monday opening lower in the first hour of trading and a point of control (POC) around the current trading zone near 1,327 pence. The MACD is in positive territory, suggesting bullish momentum, although its histogram is negative, indicating possible exhaustion of strength and price consolidation in the current area. The RSI is currently in the mid-zone around 50%, without extreme overbought or oversold conditions, suggesting some neutrality. Current support levels are at 1,305 pence, with clear resistance at the high zone, as a free rise did not occur in Friday’s session or today’s.
In technical terms, the bullish momentum remains strong, although with signals that call for monitoring key levels:
Trend and Moving Averages
Moving averages (MA) from short to long term (MA50, MA100, MA200) show a bullish bias, with mostly positive crosses and prices above the reference averages, reinforcing the positive trend.
Momentum Indicators
The MACD is in positive territory, suggesting bullish momentum.
The RSI is around mid-levels (~50), without extreme overbought or oversold conditions, but close to a zone that deserves attention if it rises further.
Support and Resistance
Important pivot and resistance levels are around 1,305 and 1,200 pence per share.
The set of recent technical indications points to a general buy signal / bullish momentum, confirmed by multiple moving averages and positive momentum, although with risk of consolidation if the price approaches static resistance or if the RSI enters overbought zones.
Solid Cash Flow
Rolls-Royce combines strong cash flow with disciplined capital allocation (buybacks), an industrial strategy that reduces geopolitical risk, and a technical trend that remains predominantly bullish. Ultimately, Rolls-Royce is not only reinforcing shareholder returns through buybacks but also redefining its industrial positioning on a global scale. The combination of strong cash generation, production diversification, and technical strength in the market paints a constructive scenario for the stock. The key now will be to confirm that this international expansion and margin improvement translate into sustainable growth in the coming years, in an environment still marked by uncertainties. However, monitoring key resistance and support levels will be crucial to validate the continuation of the movement.
*******************************************************************************************
The information provided does not constitute investment research. The material has not been prepared in accordance with the legal requirements designed to promote the independence of investment research and such should be considered a marketing communication.
All information has been prepared by ActivTrades ("AT"). The information does not contain a record of AT's prices, or an offer of or solicitation for a transaction in any financial instrument. No representation or warranty is given as to the accuracy or completeness of this information.
Any material provided does not have regard to the specific investment objective and financial situation of any person who may receive it. Past performance and forecasting are not a synonym of a reliable indicator of future performance. AT provides an execution-only service. Consequently, any person acting on the information provided does so at their own risk. Political risk is unpredictable. Central bank actions can vary. Platform tools do not guarantee success.
 Long
Long
 Long
Long
 Long
Long
 Long
Long
 Long
Long
ATYM (LONDON) – Strong Momentum Stock Digesting Gains Near HighsAtalaya Mining has been a standout over the past year, up roughly 140% and trending consistently higher. The chart shows a clean series of higher highs and higher lows, which is exactly what you want to see in a sustained move. The company is a copper producer focused on Spain, giving it direct exposure to the broader electrification and infrastructure build-out theme.
On the business side, production has remained steady and copper pricing has been supportive. Tight supply and long term demand expectations continue to underpin the sector. While resource names can be cyclical, Atalaya has managed to align improving operational delivery with a constructive commodity backdrop, which helps explain the strength in the share price.
Technically, the longer term uptrend remains intact . Price is still holding above the rising 50 and 100 day moving averages, both of which are clearly sloping upward. The stock is currently just under the 20 day moving average after a recent push to fresh highs, suggesting short term consolidation rather than structural damage. The pullback so far looks orderly and controlled , with no aggressive breakdown through key support. Volume expanded on the prior rally and has eased during the pause, which keeps the overall picture constructive. RSI has reset back toward the mid range and is starting to turn up, pointing to a momentum cool-off rather than a reversal . MACD has pulled back from elevated levels but remains within a broader bullish configuration.
If price can reclaim the 20 day and hold above the 50 day area, it would reinforce the idea that this is simply a healthy pullback within a strong trend .
This could be one to watch if the trend continues to build from here.
..................................................
PLEASE NOTE: Nothing I post is trading advice. All investing involves risk, and past performance doesn’t predict future results. Trends can and do end. For 2026 , my goal is to try and post one new asset each day. Something outside the usual gold, silver, BTC, or big tech names. I like to find stocks worldwide showing steady trends with some good gains, a recent pullback, and signs of renewed strength. I don’t necessarily hold positions in these. They are simply companies I find interesting at the time of posting. I’ll often revisit them within a week to see how they went and share any updates. If you enjoy these posts, please BOOST and FOLLOW ME to discover more under-the-radar stocks and businesses from around the world.
..................................................  Long
Long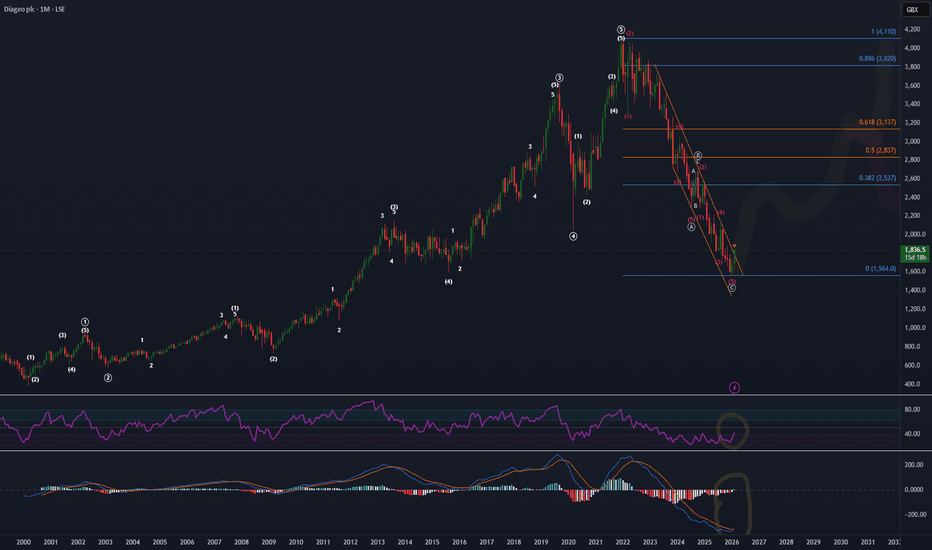
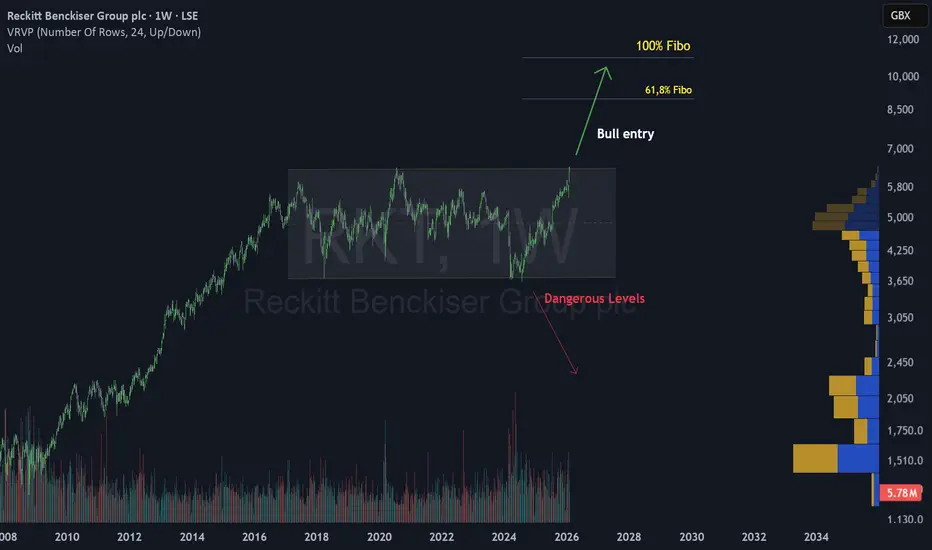
A Rare Pattern Ready To Break in RKTHello Team! 👋
Have you seen the LSE:RKT chart today?
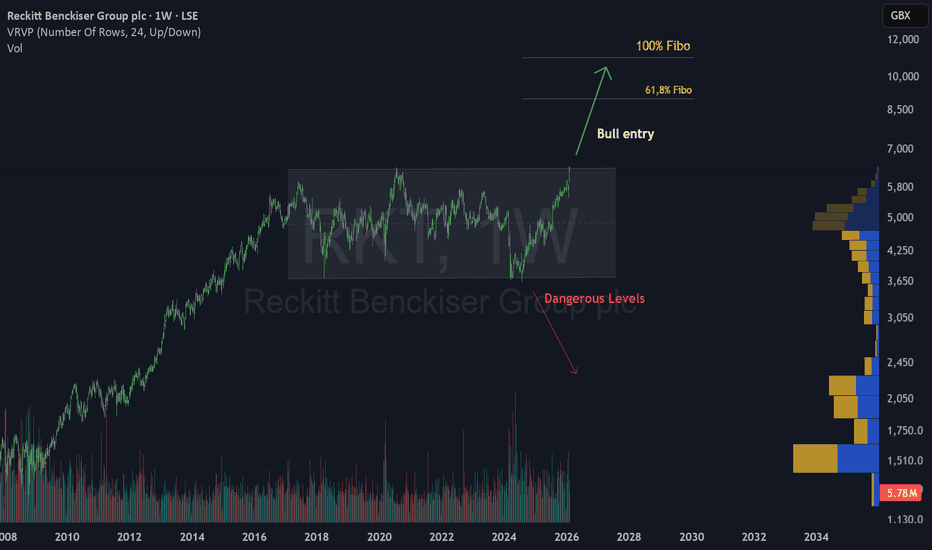
After a prolonged consolidation phase within a massive horizontal range , price is finally showing signs of life . We are currently witnessing a potential structural shift as the price approaches the upper boundary of this multi-year accumulation zone. The Bull entry signal is flashing as we challenge the previous resistance.
Looking at the Volume Profile (VRVP), we can see a significant cluster of trading activity at lower levels, which now acts as a solid floor for the current move. The liquidity at the top of the range is being tested, and a decisive move here could change the long-term trend.
From this technical setup, two main scenarios are in focus:
Scenario 1: A confirmed weekly breakout above the range high . If the price manages to hold this level, it could trigger a powerful continuation toward the 61.8% Fibo and eventually the 100% Fibo target near 11,000 GBX.
Scenario 2: A rejection at this key resistance area. If the price fails to sustain the breakout, we could see a retreat back into the range to hunt for more liquidity. A slide toward the "Dangerous Levels" marked on the chart would invalidate the immediate bullish bias.
As long as the price remains above the breakout point and uses the old resistance as new support, the overall outlook remains bullish. Remember that patience is key when trading multi-year breakouts, wait for confirmation and always prioritize risk management.
What do you think? Is LSE:RKT ready for the 100% Fibo target? Let me know in the comments!
👇 WANT MORE?
🚀 Hit the rocket, read my profile and follow so we can find each other again.  Long
Long