• Products
  • Community
  • Markets
  • Brokers
  • More
Get started
  • Markets
  • /United Kingdom
  • /Stocks
  • /Ideas
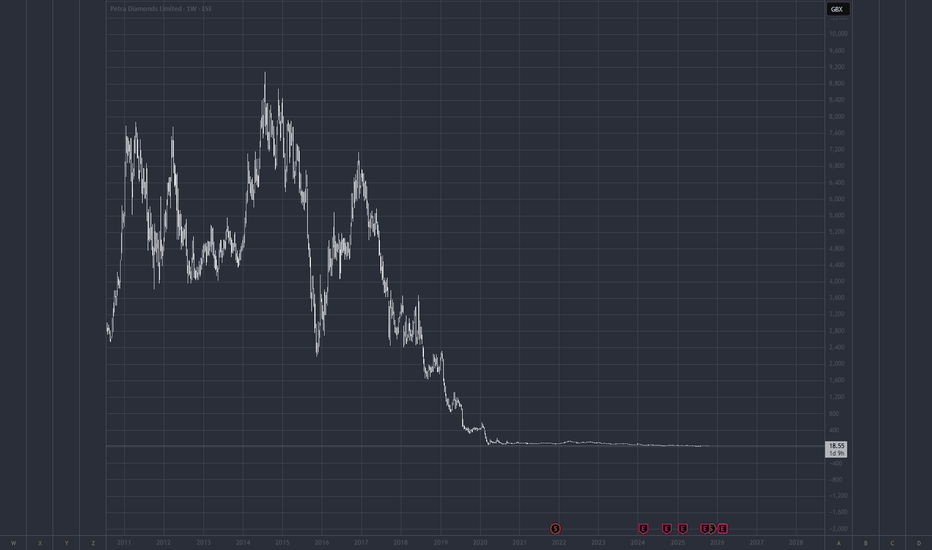
biggest potential i have ever seenPetra Diamonds, one of worlds biggest provider of diamonds with 3 operating mines in afrcia with millions of tons carat every year in finest natural organic diamonds trading as a penny stock due to financial restructering and 10 year old lawsuits for bad working environments will be the biggest comeback of this century - the age of gold, silber, rare earth, gemstone and diamonds is coming back (has never been really gone and will come back from now). In my opinion natural diamonds will always be valuable and will always be more valuable than fake diamonds from a laboratory, thus its extremely hard to start new mines, so there remains huge potential in petra diamonds existing mines weirdly this stock is trading at 20 cents per share, but it could come back to 70/80 pounds per share
LSE:PDLLong
by MrKrft
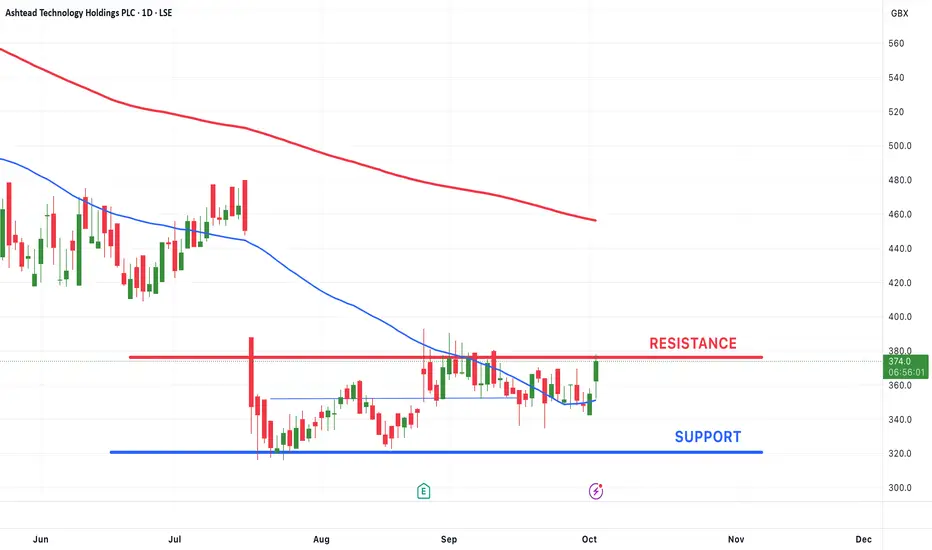
resistance comingChart is strong, very strong but possible resistance coming I hope it breaks right through
LSE:KEFI
by Andy_Wa
WOSG Long - Already in trade. Slim chance of re-entryWOSG Long Already in this trade but there may be a slim chance of re-entry on a pull back as close as possible to entry price. Otherwise SL is pretty wide and not ideal. Could ladder in with some DCA orders to entry, but you may not get it. Price back at historic levels with double bottom type structure. Spring back test of 340 price level on daily. Bullish divergence on weekly MACD and RSI, suggesting reversal. Targeting old highs and significant price levels. Price action at lower orange levels may experience so congestion/consolidation. TP1 could be reached quickly. TP2 and 3 may be far fetched as luxury goods run was probably a result of excess spending during covid and low interest rates, but worth a shot. Might be worth 50-60% exit on TP1 and see how the trade goes for the remaining TPs, so as to lock in returns.
LSE:WOSGLong
by StockHog100
Updated
SVT Long - Buy now or DCA to stop loss levelSVT Long - Buy now or DCA to stop loss level Long term uptrend Consecutive higher lows, also resembling ascending triangle Price reacting to old high with bullish engulfing candle Dividend paying 4 TPs at converging highs and fib levels, and fib extension levels.
LSE:SVTLong
by StockHog100
Updated
11
Empire Metals Accumulation Empire Metals caught my attention at 40, quite late compared to some traders, but early enough to take 1/2 profits when it hit 80.. Since then its been shaken around, but the very recent publication of a major upgrade to the quality and extent of potential Titanium reserves might explain the gyrations as larger players with a longer view look to build positions To me, the current price offers a decent entry - based on a VSA analysis of the price action as shown on the chart
LSE:EEELong
by Entoknox
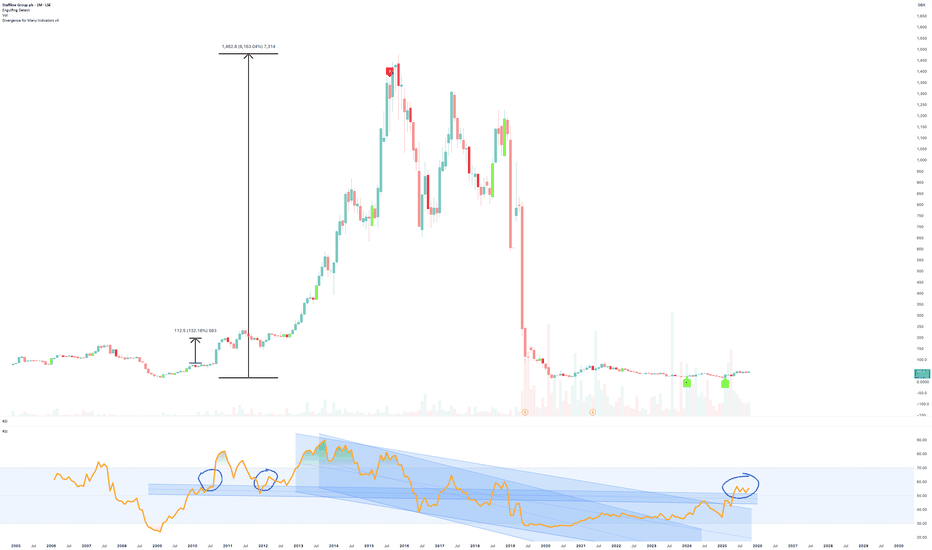
Staffline Group plc – Echoes of 2010? – October 2025Every few years, a forgotten stock resurfaces from deep decline, usually long after most investors have moved on. Staffline Group (LSE: STAF) appears to be one of those cases. Once a high flyer in the UK employment services sector, its chart today is a mirror of a company that has seen both extreme euphoria and devastating collapse. At its 2010 breakout, STAF delivered over 8000% in gains before peaking in 2018. The decline that followed erased nearly the entire move, sending the share price back to pre-2010 levels. For over five years, the chart has traded sideways, seemingly lifeless. But beneath that quiet surface, something interesting is happening: the RSI structure that has been in decline since 2014 has finally broken out of its long-term resistance channel, a condition not seen since before its 2010 run. This suggests that momentum, while still early, may be reawakening. What’s Next The RSI breakout is the first real bullish signal in years, but confirmation still matters. The long-term chart shows two key ingredients that historically preceded Staffline’s explosive move: RSI breakout from a multi-year downtrend, followed by a retest. Higher low formation within a multi-year base Both conditions are now present. If price continues to consolidate above its recent support zone (around £38–£40), the probability increases that this structure represents the early stages of a major cyclical recovery. Of course, those gains took time, and extreme patience. But as you well know, I don’t do patience. I do conditional probability, and it works. Should the structure hold, then the first technical resistance sits near £270, followed by a final run to £1400 Conclusions After more than a decade of decline, Staffline Group plc is showing its first signs of structural recovery. The RSI breakout mirrors early 2010 behaviour, the same condition that preceded one of the strongest rallies in its history. While this does not guarantee a repeat, it certainly shifts probabilities toward a bullish long term bias. Momentum is awakening, but confirmation is still king. Until price reclaims and holds above resistance, this remains a developing setup, not a breakout. For investors who can stomach volatility and think in years rather than days, this might be one to quietly watch. Patience first, position later. Ww ================================================ Disclaimer This analysis is for educational purposes only and expresses personal opinion, not financial advice. Equity markets carry significant risk, and past performance is not indicative of future results. Always perform your own research and analysis before making investment decisions. Confirmation and risk management always matter more than prediction.
LSE:STAFLong
by without_worries
Updated
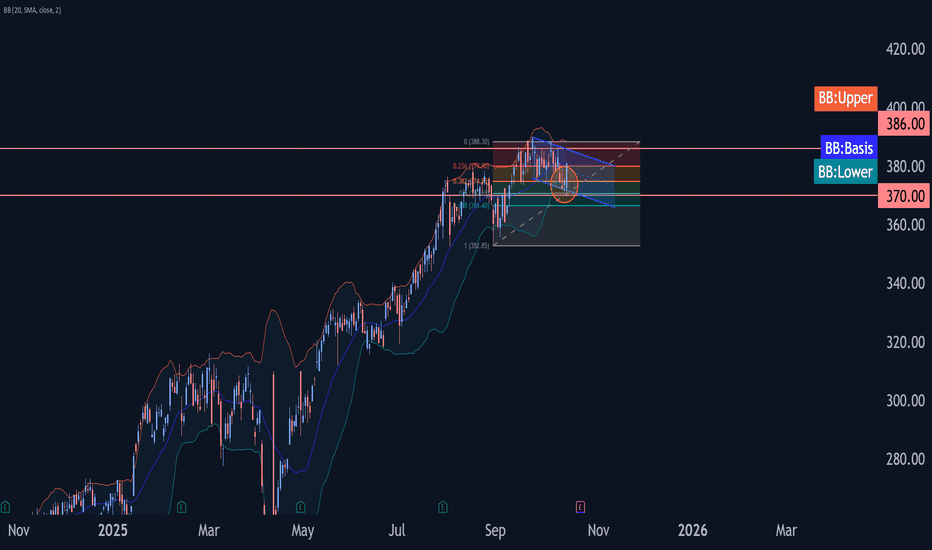
Barclays Wave Analysis – 14 October 2025 - Barclays reversed from support area - Likely to rise to resistance level 386.5 Barclays recently reversed up from the support area between the pivotal support level 370.00 (which has been reversing the price from August), lower daily Bollinger Band and the support trendline of the daily down channel from September. The upward reversal from this support area is likely to form the daily Japanese candlesticks reversal pattern Morning Star. Given the strong multi-month uptrend, Barclays can be expected to rise to the next resistance level 386.5 (which reversed earlier waves i and b).
LSE:BARCLong
by FxPro
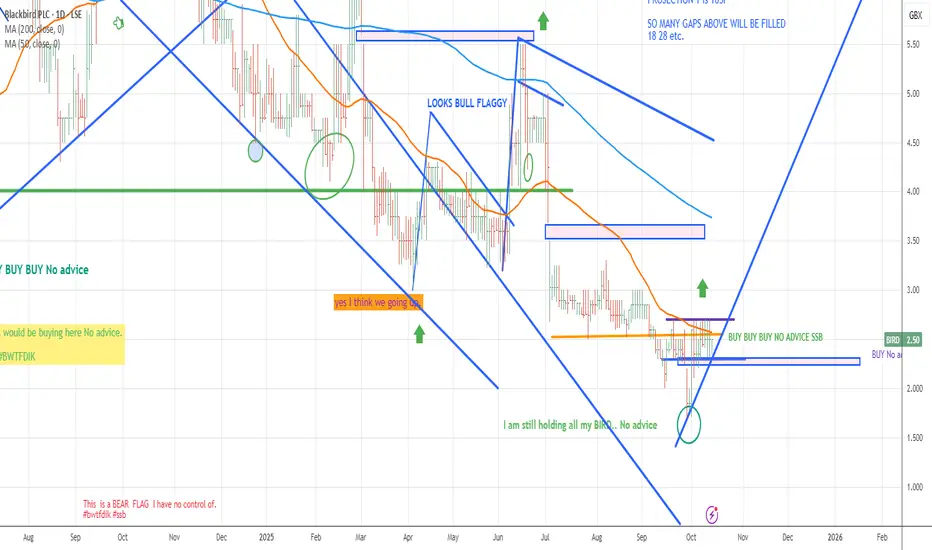
#BIRD #blackbirdplc.Blackbird has been one of those AIM safe bets, where we all know it will go up eventually, when considering the IP cash absolute mass market. #BIRD.LSE is a buy Massive buy London stok exchange BIRD
LSE:BIRDLong
by sideshowbull
11
PHP Long - Buy now or DCA in until stop lossPHP Long Volume has picked up since interest rates started to fall. Nice big dividend. Price is at bottom of range/rectangle at historic levels with bullish engulfing candle. 3 TPs, top of range and old price highs.
LSE:PHPLong
by StockHog100
Updated
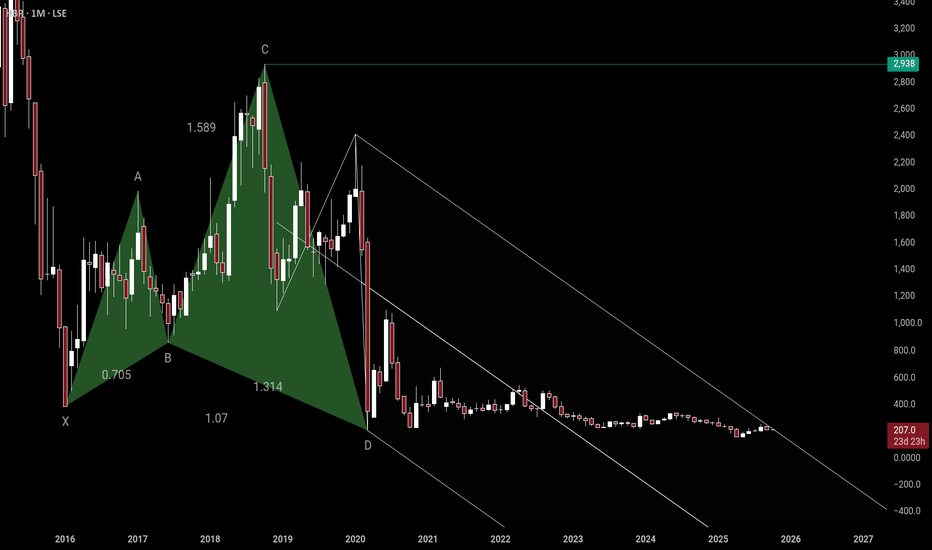
HBR massive shark pattern.This one shows a shark harmonic with schiff pitchfork. The fact this has been in consolidation/PRZ since 2020 means 1 of 2 things. 1. Bearish, the pattern has failed. 2. Bullish, this going to explode so fast and hard. The fact Brent oil is threatening to clear its main resistance leads me to the latter.
LSE:HBRLong
by frequencyshift
Long term bullishTriple bottom at 217 and historically strong support. Good tech. MACD and RSI bullish buy signals.
LSE:OCDOLong
by bobkingleythrow
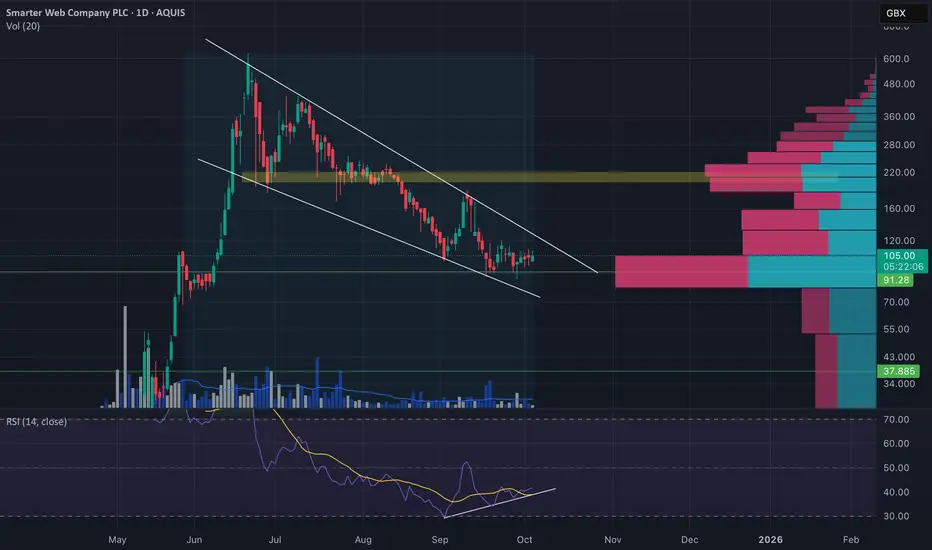
$SWC compressing + bullish RSI daily divSmarter Web Company stock hasn't reacted at all yet to BTC's recent rally, but we can see price compressing under the $109 res, around the volume POC. This, coupled with the strong bullish RSI divergence and falling wedge pattern, suggests to me that a volatile move is brewing. Adding this to my watchlist. DYOR, NFA
SLong
by RSI-Guy
11
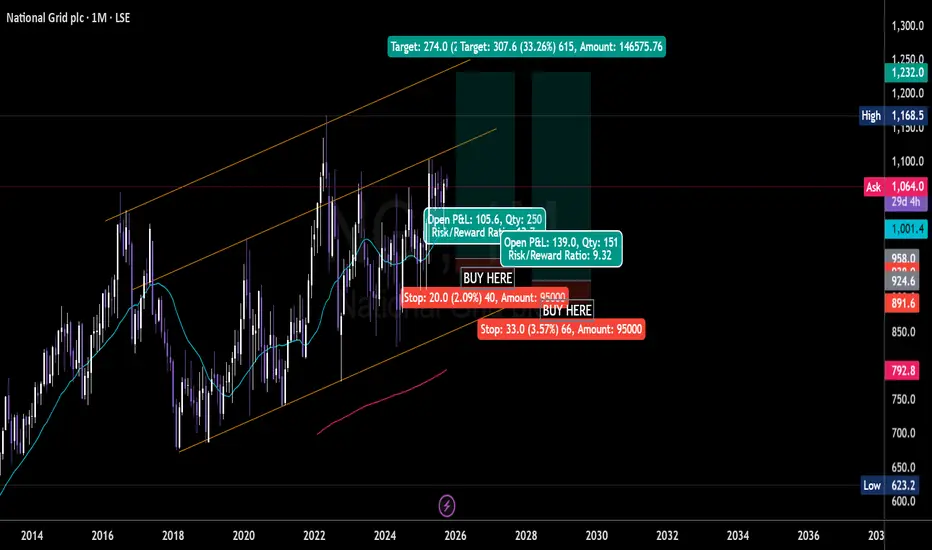
National Grid NGG Stable Utility Dividend Play STRONG BUYNGG is one of the largest electricity and gas utility companies, delivering steady dividends and defensive stability. A core holding for income investors seeking exposure to the UK and US energy infrastructure.
LSE:NG.Long
by ConnectmyCurrency
Last Day of trading on AIM - IHT funds exiting?Has the selling pressure eased off in AT.? Near resistance and last day of trading on AIM tomorrow, so last day for IHT funds to exit, although would have expected them to have done so before tomorrow. This is also the most shorted company in the UK. Will shorts also unwind? If so maybe a break of resistance will occur.
LSE:AT.
by JustinWelshy
Aberdeen Group Wave Analysis – 30 September 2025 - Aberdeen Group broke daily down channel - Likely to rise to resistance level 200.00 Aberdeen Group continues to rise after breaking the resistance trendline of the daily down channel from August (which enclosed the previous medium-term ABC correction (2)). The breakout of this down channel accelerated the active intermediate impulse wave (3) from the start of September. Given the strong daily uptrend, Aberdeen Group can be expected to rise further to the next round resistance level 200.00, the breakout of which can lead to further gains toward 205.00.
LSE:ABDNLong
by FxPro
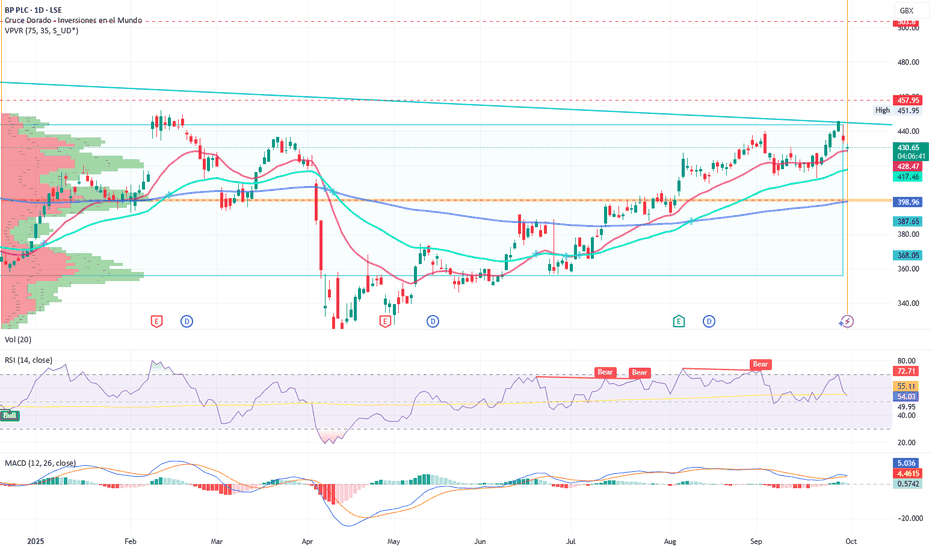
BP and TotalEnergies Step Up Their Bet on U.S. Oil and Gas By Ion Jauregui – ActivTrades European energy giants continue to strengthen their footprint in the United States. BP (LON: BP) and TotalEnergies (EPA: TTEF) have announced new strategic moves that consolidate their positions in oil and gas within the world’s largest consumer market. BP recently approved a $5 billion megaproject in the Gulf of Mexico, featuring a floating platform with a production capacity of 80,000 barrels of oil equivalent per day (boed). The British major is targeting 1 million boed in the U.S. by 2030, a milestone that would decisively reinforce its production base in North America, one of the most competitive and energy-hungry markets worldwide. In parallel, TotalEnergies acquired a 49% stake in Continental Resources’ gas fields in Oklahoma, adding 26,000 boed to its portfolio. This deal strengthens the French company’s leadership in the liquefied natural gas (LNG) market, a key resource for the energy transition and global supply security, particularly in Europe and Asia. Technical Analysis – BP (Ticker AT: BP.UK) BP shares are trading around 430.20 pence today. After forming a triple top in April 2024 and undergoing a sharp correction, the stock is moving within a lateral range between 319.20 and 457.95 pence. Resistance: located at the upper bound of the range, at 457.95 pence. Support: the 400 pence area, and in extension, the 319.20 pence lows. The POC is positioned above the 100-day average and just below the 50-day, acting as secondary support at 422 pence. Indicators: RSI remains in neutral territory following the correction, while the MACD suggests a timid recovery to the upside. Should BP break above 458 pence, the next technical target would be 503.8 pence, a level aligned with the previous 2024 bearish crossover highs. Failure to surpass resistance could see the stock retrace towards 400 pence, or even retest the range lows. Momentum will largely depend on production and earnings expectations stemming from the new U.S. projects. Strategic Outlook The moves by BP and TotalEnergies highlight the strategy of Europe’s leading oil and gas players to combine offshore and onshore production in the U.S., diversifying their portfolios and capturing growth opportunities in hydrocarbons and LNG. In the short term, these investments could boost U.S. gas supply, applying downward pressure on local prices, while enhancing the competitiveness of LNG exports to high-demand markets such as Europe and Asia. ******************************************************************************************* The information provided does not constitute investment research. The material has not been prepared in accordance with the legal requirements designed to promote the independence of investment research and such should be considered a marketing communication. All information has been prepared by ActivTrades ("AT"). The information does not contain a record of AT's prices, or an offer of or solicitation for a transaction in any financial instrument. No representation or warranty is given as to the accuracy or completeness of this information. Any material provided does not have regard to the specific investment objective and financial situation of any person who may receive it. Past performance and forecasting are not a synonym of a reliable indicator of future performance. AT provides an execution-only service. Consequently, any person acting on the information provided does so at their own risk. Political risk is unpredictable. Central bank actions can vary. Platform tools do not guarantee success.
LSE:BP.Long
by ActivTrades
$BA. Certain types of Jaw-Jaw is good for War-War stocks.We spoke a few weeks ago about euro defence stocks being prevented from rolling over by the sudden appearance of Russian drones in Polish Airspace. This resulted in a big bounce across most euro defence stocks. Now we see British Aerospace pushing to new highs on the back of comments by the German politicians announcing that they will not allow a cease-fire for Ukraine. European politicians want a war, and not surprisingly that's good for euro defence stocks.
LSE:BA.Long
by FXTraderPaul
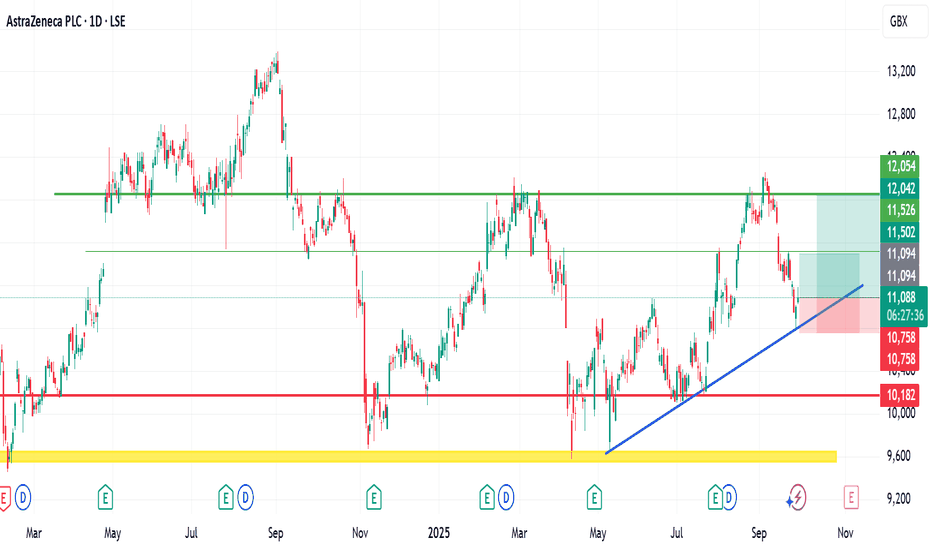
My view for AstraZeneca on LSEMy View on AstraZeneca (LSE) After analysing AstraZeneca on the monthly time frame, I observed the formation of a W-pattern, with the right leg currently developing. Although there has been a pullback on the right-hand side, I consider this a potential buying opportunity, particularly when supported by the company’s present fundamentals. On the daily chart, the ascending trendline is acting as a key support level, which further strengthens my bias toward the upside. Based on this analysis, I have marked my preferred entry zones on the chart for clarity. As always, please note this is not financial advice. Trade with caution.
LSE:AZNLong
by ForexClinik
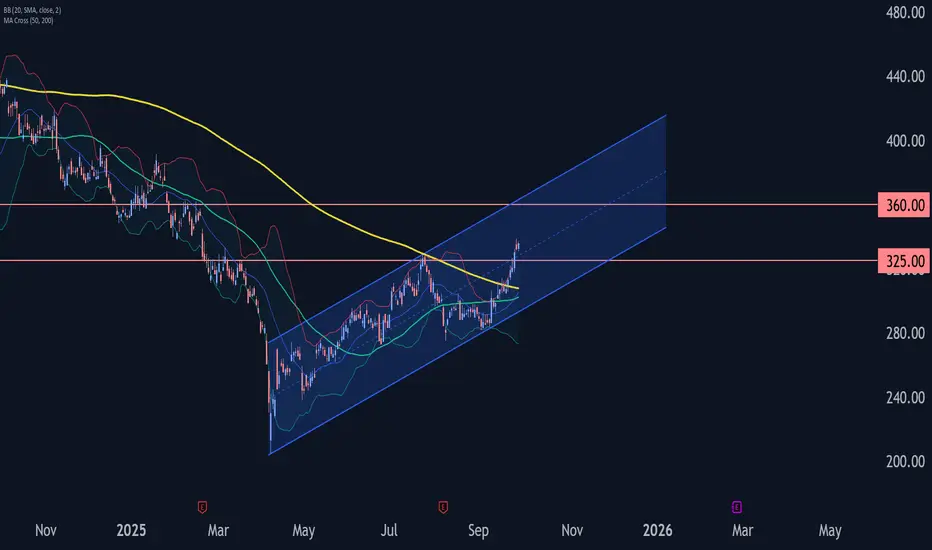
Glencore Wave Analysis – 26 September 2025Glencore Wave Analysis – 26 September 2025 Glencore: ⬆️ Buy - Glencore broke key resistance level 325.00 - Likely to rise to resistance level 360.00 Glencore recently broke above the key resistance level 325.00 (which stopped wave (A) at the end of July, as can be seen from the daily Glencore chart below). The breakout of the resistance level 325.00 accelerated the active short-term impulse wave 3 of the intermediate impulse wave (C) from the start of August. Given the multi-month uptrend, Glencore can be expected to rise further to the next resistance level 360.00 (target price for the completion of the active impulse wave (C)).
LSE:GLENLong
by FxPro
11
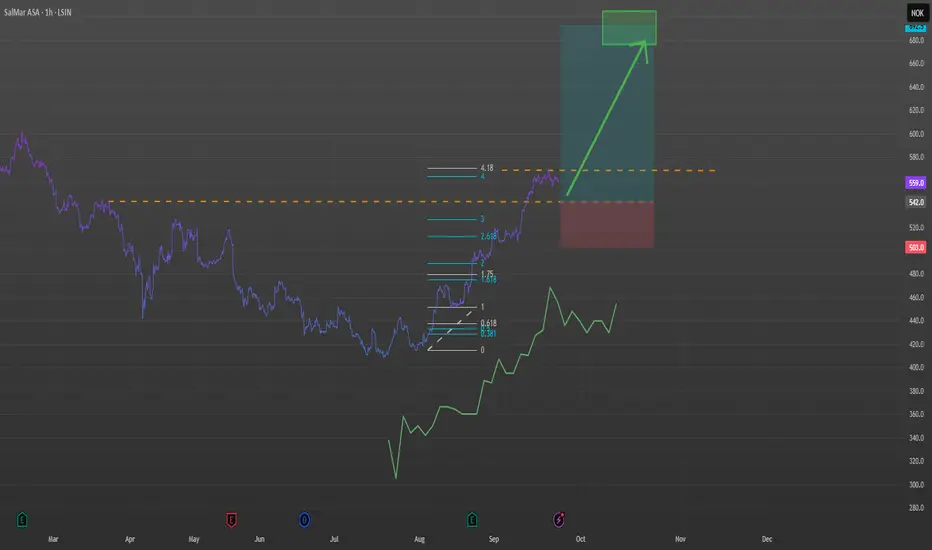
SALMAR / Fractal / SeasonalityI have a buy alert for price at the dotted lines. I ll buy the pullback or the breakout. This is not a trade call, nor financial advice... I m just a dude who loves fish from norway ;-)
LSIN:0FWYLong
by Amazing-Fractals
Updated
Daily Outlook On YCA Yellow Cake PLCThis is my Daily time frame outlook on LSE:YCA . In the weekly view I posted recently I was looking for a breakout of the consolidation in wave 3, so far this looks to be playing out. I'm again looking for a continuation higher. I did add to my position shortly after posting the weekly outlook, declared on X but forgot to mention here, entry is shown on the chart. Spot uranium looks to be moving higher, potentially in a wave 3, and again in line with my outlook. So as mentioned on the chart comments, the levels of the impulse could get stretched if spot really gets moving.
LSE:YCALong
by TheWaveCave
BIRD geometric upsideUsing angles and long dismissed tools we can find opportunity. BIRD at 2.25 is a steal. Targets are rectangles above.
LSE:BIRDLong
by frequencyshift
Stock Spotlight: Challenger Energy (AIM – London)🔦 Stock Spotlight: LSE:CEG I first wrote about this stock back in 2024. Since then, I’ve been holding it, with a target set for 2026 (if it surprises and reaches my goals earlier, I won’t stay in). What’s in this stock? Currently – nothing. So why did I invest in 2024? It’s essentially an option on two offshore basins in Uruguay, considered a geological mirror of Namibia and its the only public junior company that have positions on Uruguay offshore blocks. Challenger made a bold move: during Uruguay’s license round in 2020–2021, no one bid (oil markets were in chaos during COVID and before Namibia’s discoveries). They were the first and only to apply and secured 2 out of 8 blocks. The approval process took time, and meanwhile their core business underperformed – leading to a reorganization of assets. Since then, Namibia has become hot, and the southern Brazil/Uruguay margin is attracting majors. The picture in Uruguay today without challenger blocks: * Shell took 3 out of 8 blocks * APA (Apache) took 2 blocks (one jointly with Shell) * YPF (Argentina) took 1 block Challenger’s current position: Area 1 – Farm-in deal with Chevron: fully funded seismic, 50% of first well costs + USD 12M cash. Challenger now holds 40%. Area 3 – 100% owned, ex-BP acreage with existing 3D seismic, now being prepped for farm-out. A few months after the Chevron deal (2024), one of the most interesting family offices in the exploration space – Charlestown Energy (behind Sintana Energy’s turnaround) – entered a convertible loan agreement with Challenger (I bought a few weeks before them). By 2024: Namibia was already hot Shell & Chevron active in Namibia, Chevron moving into Uruguay. Charlestown, the group behind Sintana’s move into Namibia, made a small investment in Challenger. Proceeds from Charlestown were used to reprocess Area 3 at the edge of Brazil’s Pelotas Basin. And still – Why “nothing”? No discoveries in Uruguay yet. No known drilling program. When I bought, it was trading at cash with zero valuation for the licenses. Technically: The stock has woken up in recent days, but caution is needed – some may be offloading. In my view it’s one to watch. Right now, after a 24% move up in one day as I write, entry isn’t attractive. ⚠️ Disclaimer: This is not investment advice or a recommendation to buy or sell. This is a very high-risk microcap with no proven discoveries in Uruguay. Do your own research.⚠️
C
by Mc_investor
33
112233445566778899101011111212131314141515161617171818191920202121222223232424252526262727282829293030313132323333343435353636373738383939404041414242
…999999

Made by humans

Select market data provided by ICE Data Services. Select reference data provided by FactSet. Copyright © 2026 FactSet Research Systems Inc.Copyright © 2026, American Bankers Association. CUSIP Database provided by FactSet Research Systems Inc. All rights reserved. SEC filings and other documents provided by Quartr.© 2026 TradingView, Inc.

More than a product
  • Supercharts
Screeners
  • Stocks
  • ETFs
  • Bonds
  • Crypto coins
  • CEX pairs
  • DEX pairs
  • Pine
Heatmaps
  • Stocks
  • ETFs
  • Crypto coins
Calendars
  • Economic
  • Earnings
  • Dividends
  • IPOs
More products
  • Portfolios
  • Fundamental Graphs
  • Yield Curves
  • Options
  • Macro Maps
  • Pine Script®
  • MCP Server
Apps
  • Mobile
  • Desktop
Community
  • Social network
  • Wall of Love
  • Refer a friend
  • Creator program
  • House Rules
  • Moderators
Ideas
  • Trading
  • Education
  • Editors' picks
Pine Script
  • Indicators & strategies
  • Wizards
  • Freelancers
  • Marketplace
Tools & subscriptions
  • Features
  • Pricing
  • Market data
  • Gift plans
Trading
  • Overview
  • Brokers
  • Brokers comparison
  • The Leap
Special offers
  • CME Group futures
  • Eurex futures
  • US stocks bundle
About company
  • Who we are
  • Space mission
  • Blog
  • Help Center
  • Careers
  • Media kit
Merch
  • TradingView store
  • Tarot cards for traders
  • The C63 TradeTime
Policies & security
  • Terms of Use
  • Disclaimer
  • Privacy Policy
  • Cookies Policy
  • Accessibility Statement
  • Security tips
  • Bug Bounty program
  • Status page
Business solutions
  • Widgets
  • Charting libraries
  • Lightweight Charts™
  • Advanced Charts
  • Trading Platform
Growth opportunities
  • Advertising
  • Brokerage integration
  • Partner program
  • Education program
Community
  • Social network
  • Wall of Love
  • Refer a friend
  • Creator program
  • House Rules
  • Moderators
Ideas
  • Trading
  • Education
  • Editors' picks
Pine Script
  • Indicators & strategies
  • Wizards
  • Freelancers
  • Marketplace
Business solutions
  • Widgets
  • Charting libraries
  • Lightweight Charts™
  • Advanced Charts
  • Trading Platform
Growth opportunities
  • Advertising
  • Brokerage integration
  • Partner program
  • Education program
Look FirstLook First