• Products
  • Community
  • Markets
  • Brokers
  • More
Get started
  • Markets
  • /United Kingdom
  • /Stocks
  • /Ideas
Elliot Wave analysis of Transense Technologies (TRT)Daily Candles. LSE:TRT A clear 1,2,3,4,5 Impulse Wave advance (Wave 1) followed by the Corrective A,B,C Zig-Zag (Wave 2) - Support was finally found at 78.6 retracement level. Wave 3 now underway with a minimum £2 price target
LSE:TRTLong
by mattjoss
EasyJet to fly?EasyJet - 30D expiry - We look to Buy a break of 311.1 (stop at 288.8) We are trading at oversold extremes. The trend of lower highs is located at 370. The previous swing high is located at 375. We look for a temporary move higher. There was little net movement as we continue to consolidate within the 280 - 310 range. Although the bears are in control, the stalling negative momentum indicates a turnaround is possible. The bias is to break to the upside. Our profit targets will be 369.6
LSE:EZJLong
by Saxo
Updated
Value area trading shortfind the big value area on the 4hr or daily chart. find the small value areas within the big value area on the 1hr or 15min chart. when price moves to the outer edges of the big value area wait for a break of the small value area there. look for a rejection of that area for the entry. stop loss the small value control ling. target the big value control line.
LSE:PRUShort
by GA2017
Elliot Wave Analysis of AAZ - Weekly Candles. £3.50 target priceHave used the Weekly Candles here due to the timeframe involved. A clear 1,2,3,4,5 Impulse advance (that meets all the EW Rules) for Wave I Corrective Wave II consists of an a,b,c Zig-Zag decline, that was halted at (4) of the previous wave (also meets all the EW Rules) Wave III should now develop and, assuming 1.618*Wave I, that gives a target price of circa £3.50
LSE:AAZLong
by mattjoss
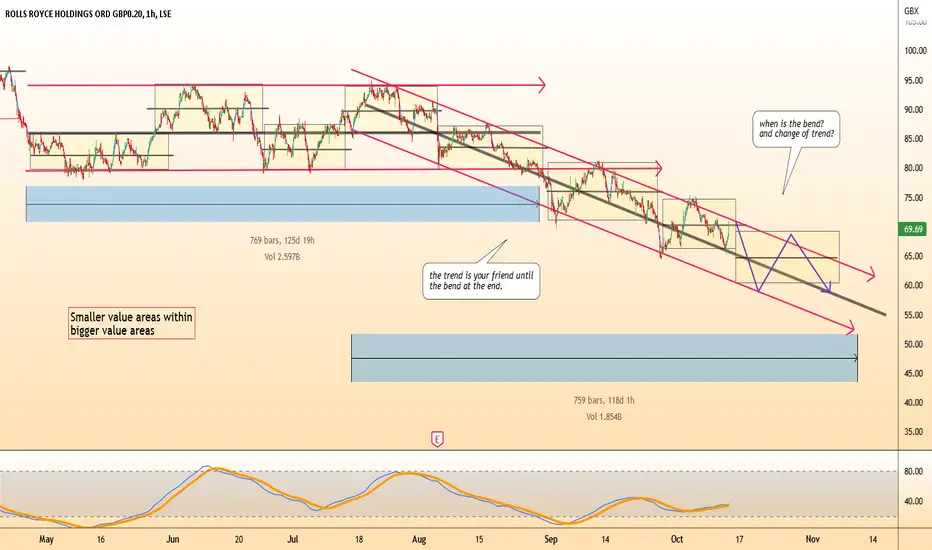
Shifting value areasA picture tells a thousand words. Let's learn to read the picture. Price is seeking value and creates a pattern. Small value areas form within a bigger value area. Trading opportunities arise at the outer edges of the bigger value areas target at the control line. The trend will change if the price starts making HH, HL, LL, LH. It will then start to form a new bigger value area and control line. The sooner we can see this new value area the sooner we can trade along with the money that moves t
LSE:RR.
by GA2017
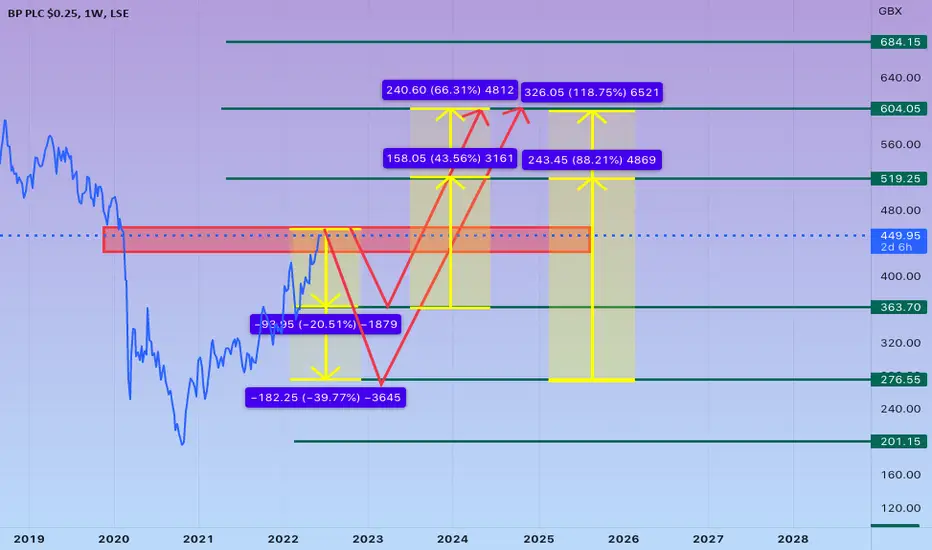
BP PRICE FORECASTBP Plc operates as an integrated oil and gas company. It operates through the following segments: Upstream, Downstream and Rosneft. The Upstream segment engages in the oil and natural gas exploration, field development and production, midstream transportation, storage and processing, and marketing and trade of natural gas, including liquefied natural gas and power, and natural gas liquids. The Downstream segment refines, manufactures, markets, transports, supplies, and trades crude oil, petroleu
LSE:BP.
by Rex_Imperator_Dubois
Updated
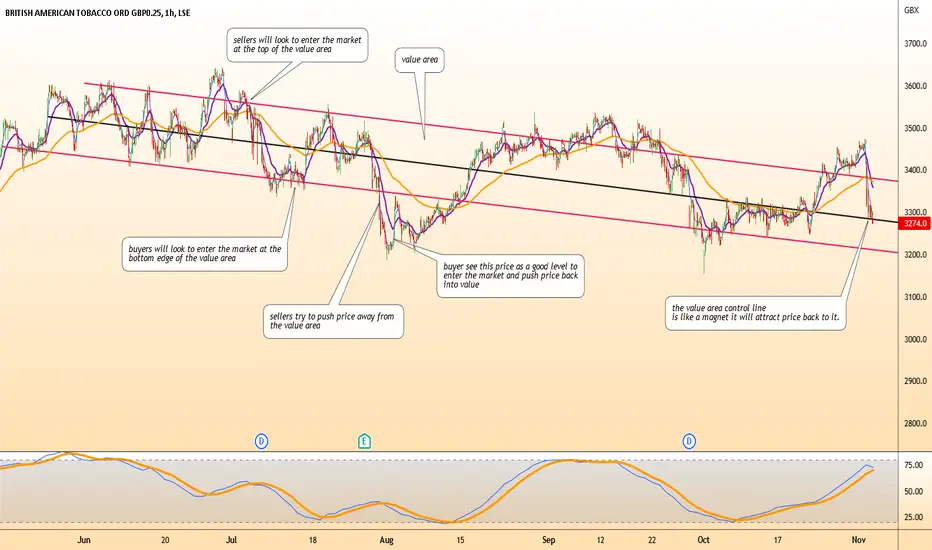
Long and short trades in a value areaPossible long and short trades that can be taken when trading from a value area. the 1hr 20ma or 100ma cross over can be used as a trigger. stop loss previous swing high or low. target at the control line
LSE:BATS
by GA2017
Value area tradingTrades can be taken from the top edge to the control line - short and from the bottom edge to the control line - long entry triggers can be higher highs, HL, LH, LH - double tops/ bottoms - head and shoulders - wicks, or small value areas.
LSE:BATS
by GA2017
Short trade A small value area within the top half of a big value area. A short trade back to the control line
LSE:SMINShort
by GA2017
Wave pattern A wave pattern in the value area. ride the wave with the big buyers and sellers. where do you think this is going next?
LSE:IQEShort
by GA2017
Value area tradinga small value area trade at the edge of a big value area.
LSE:AUTOLong
by GA2017
Value area long tradebuyer strength at the bottom of the value area. long trade back to the target at the control line. It does have the potential to hit the value high again, but you never know. a safer trade is to exit at the control line.
LSE:RIOLong
by GA2017
Value area tradingup trending value area long trade entry at the bottom edge of value area target control line
SLong
by GA2017
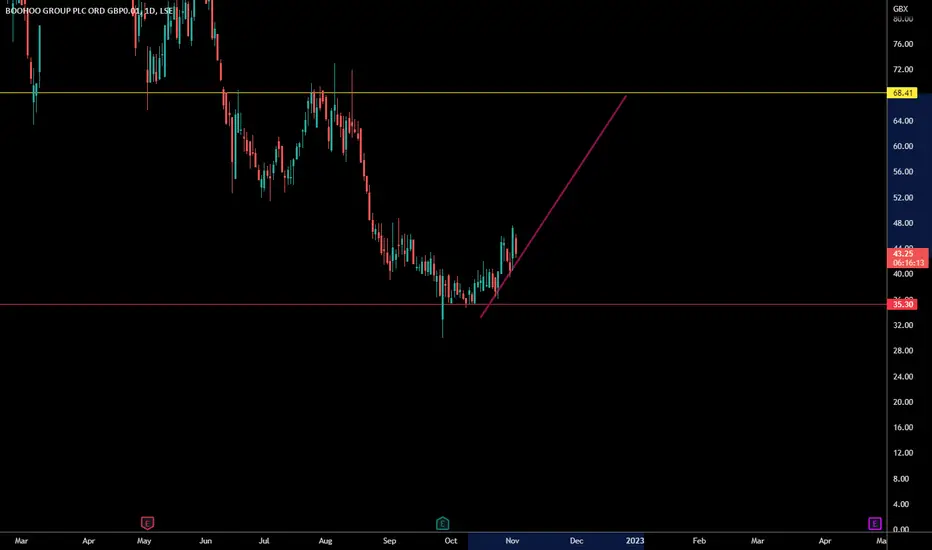
Boohoo BuyI mainly invest in ETF stocks and crypto for long term. Christmas is coming, this looks like a good buy for the medium and long term. I don't think it will hit go further than the long term support line, it could the trend line a bit, the uptrend looks good. What are your thoughts?
B
by tradewithhansley
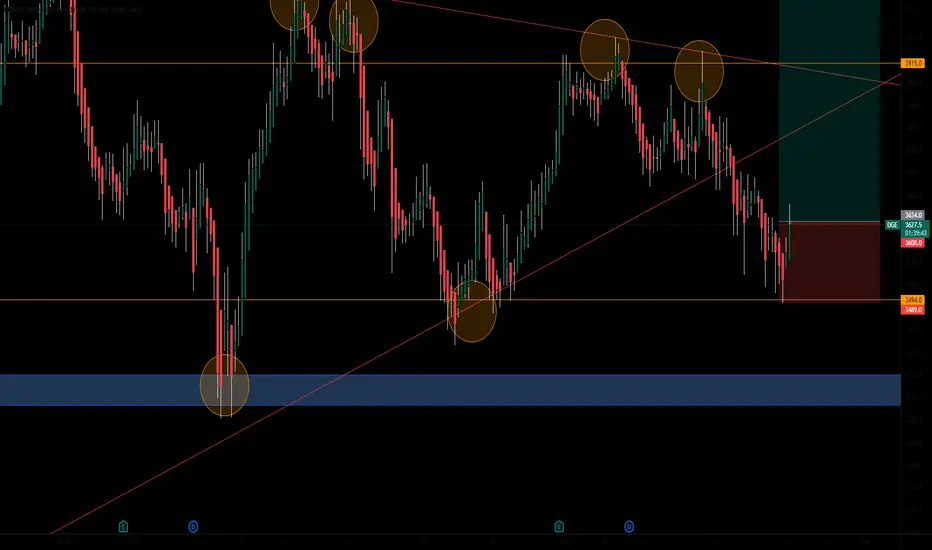
Long Diageo Diageo has said it is starting the final phase of its share buyback, where it will hoover up to £640mln worth of its stock, last month the FTSE 100-listed alcoholic drinks group said it intends to raise its stake in East African Breweries to 65% from 50.03% but did not intend to make a takeover offer. - Trading at 11.6 below fair value - Earnings are forecast to grow 10.43% - Pays a reliable dividend of 2.12%
LSE:DGELong
by Tallestablishment
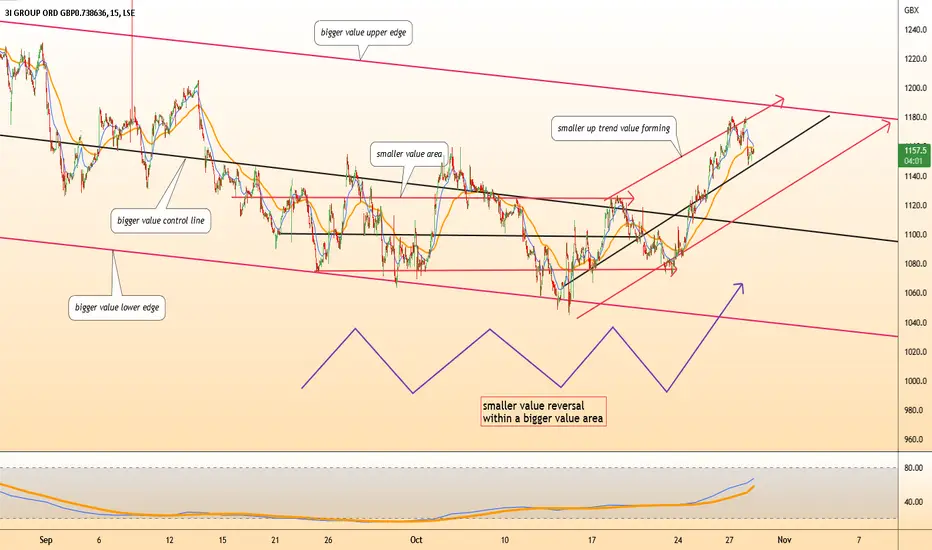
Value area trend changea smaller value area turning into an up trend value area all within a bigger value area
LSE:III
by GA2017
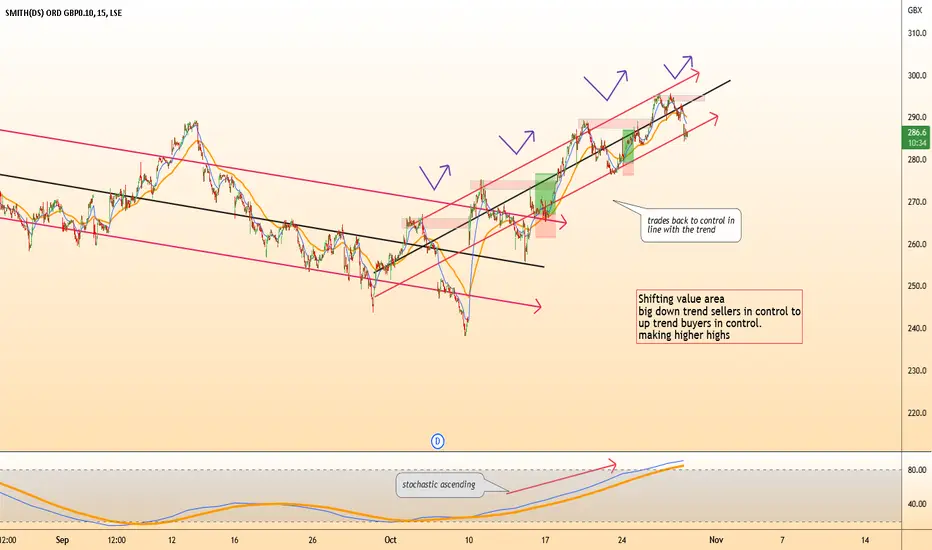
Shifting value areaValue shifting from a big downtrend where sellers are in control to a smaller up trend where buyers are in control
SLong
by GA2017
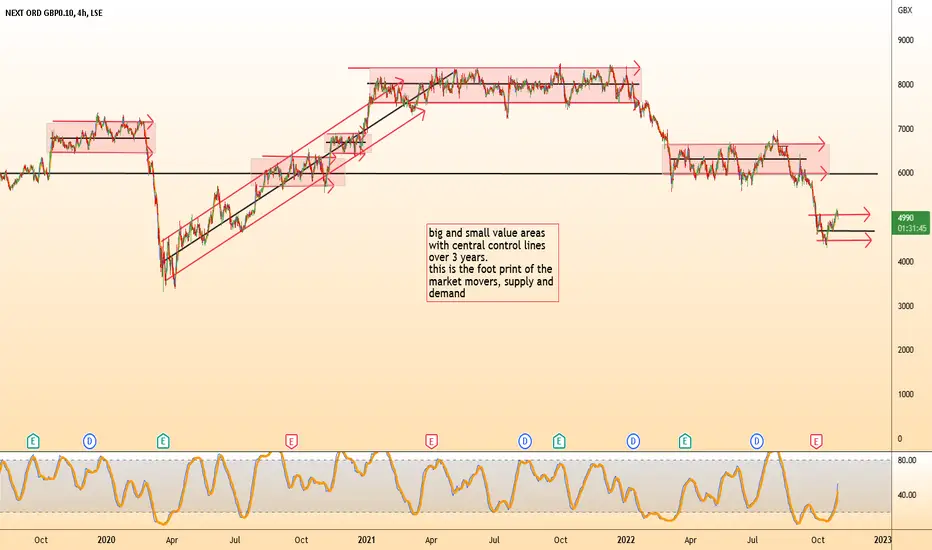
Value AreasThis is the footprint of the bigger money that move the market. Price is always seeking value between buyers and sellers. The central control line in the value area is where the most trading takes place, it's like a magnet to price. Price moves from one value area to another. Trade the edge of the value area back to the control line.
LSE:NXT
by GA2017
Uptrend?This graph shows that we can go a long position To the moon, fundamentals look great
LSE:TRBLong
by Alexas58
LLOYDS BANKING GROUPPossible bearish movement Take profit 41.500 Stop lose 49.425
LSE:LLOYShort
by A-Alsaedi
Updated
SVT: inverse head-and-shoulders patternA price actioin above 2300 supports a bullish trend direction. Crossing below this level will negate the bullish trend. Further trend support above 2400. Crossing above 2500 might target 2600. Remains a risky trade.
LSE:SVTLong
by Peet_Serfontein
FLTR: some cup-and-handle pattern?A price action above 10600 supports a bullish trend direction. Crossing below this level will negate the bullish bias. Further trend support above 10900. Crossing above 11200 might target 11700. Crossing below 10800 might be the first sign of pending weakness.
FLong
by Peet_Serfontein
Foxtons shares are going to be delistedThe UK housing market can be regarded as one of the largest real estate speculative fraudulent bubbles in the global economy, such as hong kong real estate, china estate market, Paris, new york, Florida, and California real estate markets. Hounding and Commercial real estate developers and real estate brokers are going to go bust, because they have leveraged their balance sheet of very cheap debt collateralized by inflated real estate prices. The housing market and commercial real estate market
LSE:FOXTShort
by UnknownUnicorn27566687
1
Unilever PLC - ULVR - LONGSince price seems to be moving up since Mar 22, could this be potential move to the upside to 4170?
LSE:ULVRLong
by troublefreetrading
123456789101112131415161718192021222324252627282930313233343536373839404142
…999

Made by humans

Select market data provided by ICE Data Services. Select reference data provided by FactSet. Copyright © 2026 FactSet Research Systems Inc.Copyright © 2026, American Bankers Association. CUSIP Database provided by FactSet Research Systems Inc. All rights reserved. SEC filings and other documents provided by Quartr.© 2026 TradingView, Inc.

SOC 2 CompliantGDPR Compliant
More than a product
  • Supercharts
Screeners
  • Stocks
  • ETFs
  • Bonds
  • Crypto coins
  • CEX pairs
  • DEX pairs
  • Pine
Heatmaps
  • Stocks
  • ETFs
  • Crypto coins
Calendars
  • Economic
  • Earnings
  • Dividends
  • IPOs
More products
  • News Flow
  • Portfolios
  • Fundamental Graphs
  • Yield Curves
  • Options
  • Macro Maps
  • Pine Script®
  • MCP Server
Apps
  • Mobile
  • Desktop
Community
  • Social network
  • Wall of Love
  • Refer a friend
  • Creator program
  • House Rules
  • Moderators
Ideas
  • Trading
  • Education
  • Editors' picks
Pine Script
  • Indicators & strategies
  • Wizards
  • Freelancers
  • Marketplace
Tools & subscriptions
  • Features
  • Pricing
  • Market data
  • Gift plans
Trading
  • Overview
  • Brokers
  • Brokers comparison
  • The Leap
Special offers
  • CME Group futures
  • Eurex futures
  • US stocks bundle
About company
  • Who we are
  • Space mission
  • Blog
  • Help Center
  • Careers
  • Media kit
Merch
  • Tarot cards for traders
  • The C63 TradeTime
Policies & security
  • Terms of Use
  • Disclaimer
  • Privacy Policy
  • Cookies Policy
  • Accessibility Statement
  • Trust Center
  • Security tips
  • Bug Bounty program
  • Status page
Business solutions
  • Widgets
  • Charting libraries
  • Lightweight Charts™
  • Advanced Charts
  • Trading Platform
Growth opportunities
  • Advertising
  • Brokerage integration
  • Partner program
  • Education program
Community
  • Social network
  • Wall of Love
  • Refer a friend
  • Creator program
  • House Rules
  • Moderators
Ideas
  • Trading
  • Education
  • Editors' picks
Pine Script
  • Indicators & strategies
  • Wizards
  • Freelancers
  • Marketplace
Business solutions
  • Widgets
  • Charting libraries
  • Lightweight Charts™
  • Advanced Charts
  • Trading Platform
Growth opportunities
  • Advertising
  • Brokerage integration
  • Partner program
  • Education program
Look FirstLook First