• Products
  • Community
  • Markets
  • Brokers
  • More
Get started
  • Markets
  • /Germany
  • /Stocks
  • /Ideas
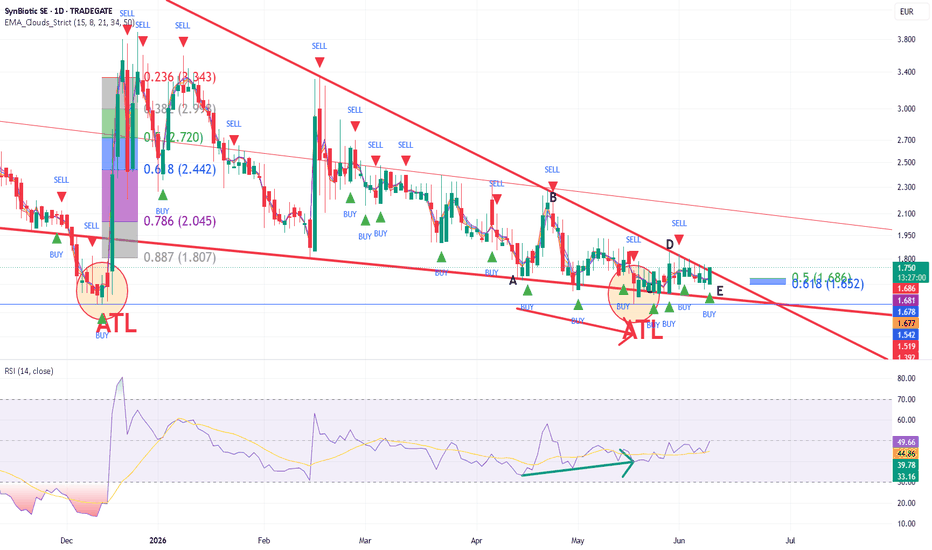
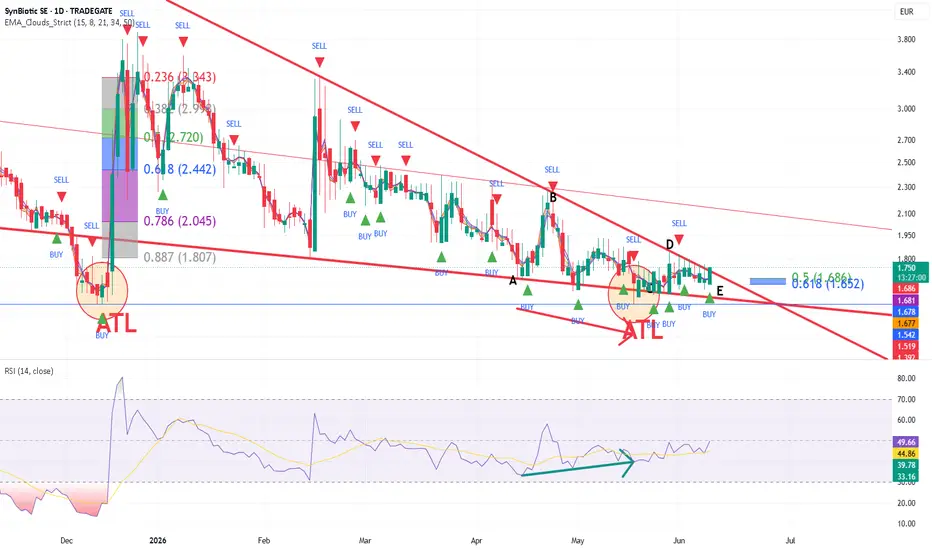
Triangle, triangle....Let's go again....and Fail again? Stock is completing a triangle ABCDE Formation with Wave E bouncing at the 61,8 % Fibonacci lvl of Wave D. Before that, the stock bounced of a second ATL, forming a bullish divergence on the RSI on it's way. Now it is crucial to look for stock price reaction at the breakout. Expect a breakout and retest at best. Risk & Reward can be set very tight, since triangle is nearing its end formation Fundamental: Stock is about to release 2025 numbers. Considering the fact, that medical cannabis is somewhat legal to be obtained online, I expect a bump in growth for 2025. Profitability should be reached in 2026 however according to the company, with 2025 just failing a net zero, after years of losses. Legally: Politically challenging times ahead, since online cannabis market, could be adressed by an ongoing reform.
TRADEGATE:SBXLong
by robschulz
Updated
$BMW , IdeaENTRY : CMP TP1 : ** TP2 : ** TP3 : ** TP4 : ** SL : If you wish ** FULL SETUP AVAILABLE** My SL is never a SELL, just an alarm to stop adding money and wait for better dca Follow, Boost, Thank You ! ⚠️ Financial Disclaimer: This post is not financial advice. I am not your financial advisor, your life coach, or your legally responsible adult. Always do your own research and never trade based solely on internet comedy
HAM:BMW
by evolutionqc
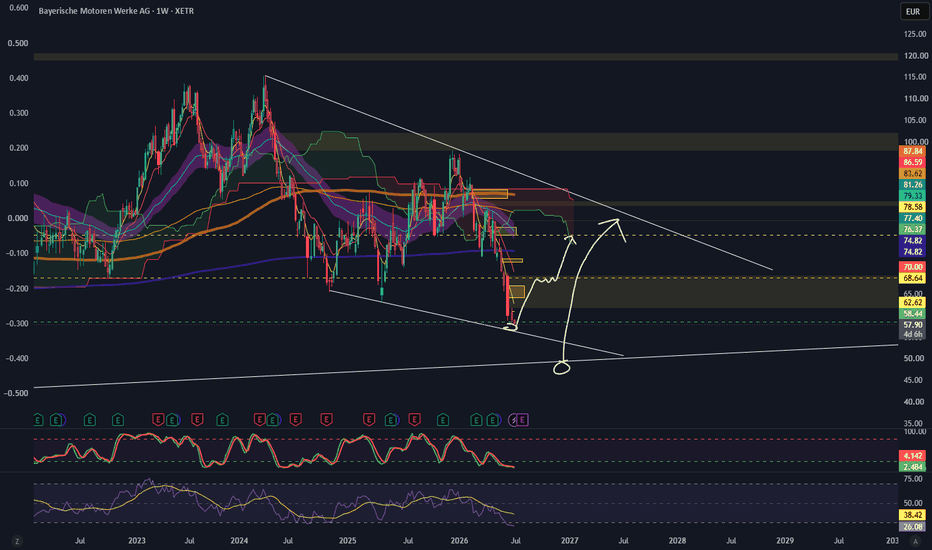
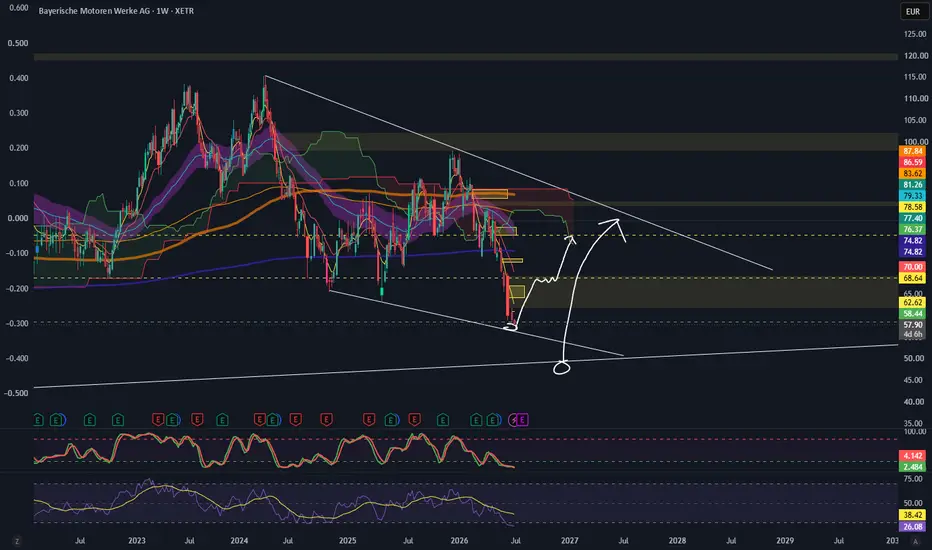
BMW | Weekly ChartBMW has experienced a significant sell-off and is now testing a major long-term support zone around €58-60. This area also coincides with the lower boundary of a broad descending channel that has been respected for over a year. Despite the bearish structure, momentum indicators suggest the stock is becoming heavily oversold. RSI has fallen close to the lower end of its historical range, while the stochastic oscillator is deeply oversold, increasing the probability of at least a relief rally. Bullish Scenario 📈 If buyers defend the current support zone, I expect a rebound toward the first resistance around €74-76, where previous support has now turned into resistance. A stronger recovery could extend toward the descending trendline near €80-85. A decisive weekly close above that trendline would be the first technical sign that the longer-term downtrend is losing strength. Bearish Scenario 📉 Failure to hold the current support would likely send BMW toward the lower support line around €50, where the broader long-term channel offers the next significant buying area. As long as price remains below the descending trendline, the primary trend remains bearish. Key Levels 🟢 Support: €58-60 €50 (major long-term support) 🔴 Resistance: €74-76 €80-85 Descending trendline Conclusion Although the overall trend is still bearish, BMW is approaching an area where the risk-to-reward for long positions becomes increasingly attractive. I will be watching closely for bullish price action or a confirmed reversal before becoming more optimistic. Patience is key here. The support zone may produce a strong bounce, but confirmation is still needed.
XETR:BMWLong
by Roxo66
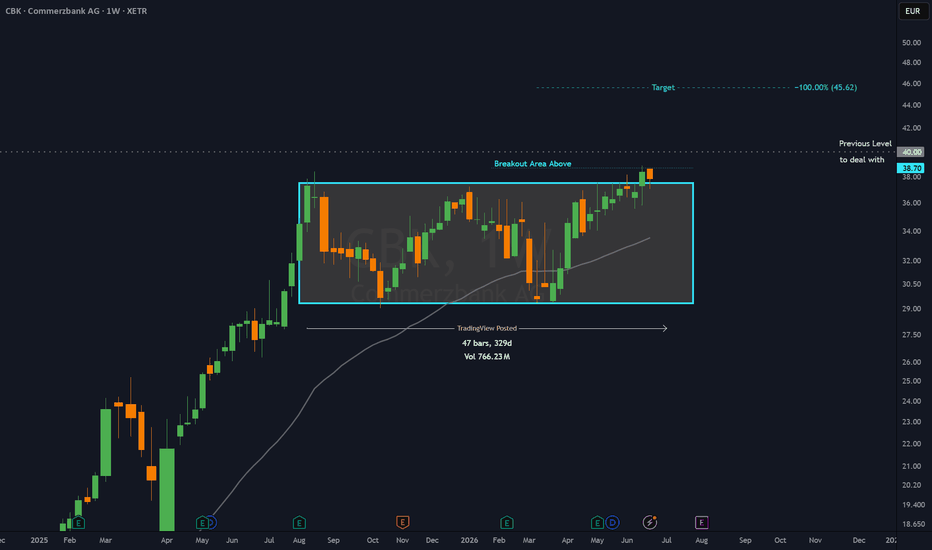
CBK - 11 months RECTANGLE══════════════════════════════ Since 2014, my markets approach is to spot trading opportunities based solely on the development of CLASSICAL CHART PATTERNS 🤝Let’s learn and grow together 🤝 ══════════════════════════════ Hello Traders ✌ After a careful consideration I came to the conclusion that: - it is crucial to be quick in alerting you with all the opportunities I spot and often I don't post a good pattern because I don't have the opportunity to write down a proper didactical comment; - since my parameters to identify a Classical Pattern and its scenario are very well defined, many of my comments were and would be redundant; - the information that I think is important is very simple and can easily be understood just by looking at charts; For these reasons and hoping to give you a better help, I decided to write comments only when something very specific or interesting shows up, otherwise all the information is shown on the chart. Thank you all for your support 🔎🔎🔎 ALWAYS REMEMBER "A pattern IS NOT a Pattern until the breakout is completed. Before that moment it is just a bunch of colorful candlesticks on a chart of your watchlist" ═════════════════════════════ ⚠ DISCLAIMER ⚠ The content is The Art Of Charting's personal opinion and it is posted purely for educational purpose and therefore it must not be taken as a direct or indirect investing recommendations or advices. Any action taken upon these information is at your own risk.
XETR:CBKLong
by TheArtOfCharting
Rheinmetall📊 ****Rheinmetall AG (RHM)**** ISIN: DE0007030009 ****What the Company Does**** 🛡️ Manufactures defense systems and military equipment 🚗 Produces automotive components and technologies ****Future Potential**** 📈 Rising defense spending across NATO countries 🚀 Growth in military vehicles, ammunition, and air defense ****Future Risks**** ⚔️ Competition from global defense contractors 🌍 Political decisions and changing defense budgets
XETR:RHM
by robo414
Mercedes-Benz Group — Channel Support Under PressureFrom a broader perspective, Mercedes-Benz Group remains in a bearish market structure, continuing to trade inside a descending channel that currently defines the overall directional bias. At the moment, price is sitting around an important technical area where the lower boundary of the bearish channel aligns with a strong support zone — creating a decisive region that may influence the next directional move. This area becomes especially interesting because support and channel structure are converging, increasing the probability of a market reaction. From here, two scenarios become relevant: → Bullish corrective scenario: If price respects the current support and shows signs of rejection, we may see a corrective move higher within the descending channel before the broader trend is reassessed. → Bearish continuation scenario: If support fails to hold and price breaks below the current area with confirmation, further downside may become more probable, with attention shifting toward the next major support zone. At this stage, the focus is not on predicting a reversal but on observing how price behaves around this decisive location. For now, the key question is: Will support trigger a corrective rebound, or will sellers push price toward the next support level? This is a scenario-based analysis — not a prediction. Disclaimer: This analysis is shared for educational purposes only. It reflects personal market observations and does not constitute financial advice or a trading recommendation. Rayan Nasser #MercedesBenz #Stocks #TechnicalAnalysis #PriceAction #Investing #StockMarket #MarketStructure #RiskManagement
XETR:MBG
by Rayannsr
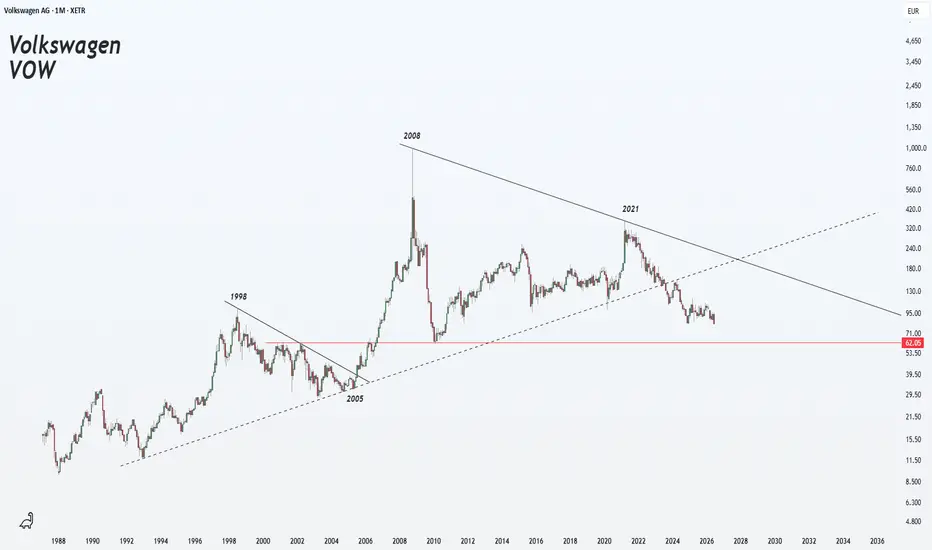
Volkswagen Long-Term Structural CompressionXETR:VOW Volkswagen is not a short-term trading chart here. This is a multidecade structural map. The chart shows three major reference points: 1998, 2008 and 2021. Each of these periods created an important reaction zone, but the most important message is the long-term compression between the falling macro resistance and the horizontal support area around €62. The 2008 spike remains the most extreme event on the chart. That move was not a normal trend continuation. It was a historical distortion, a vertical repricing event followed by a full structural reset. After that peak, Volkswagen never built a clean long-term continuation structure above that region. Instead, the market started forming lower macro highs. The 2021 peak is important because it confirms the same long-term resistance line. Price moved strongly into that area, but failed again. That rejection created another lower high relative to the 2008 event and kept Volkswagen inside the broader descending macro structure. The dashed rising line from the 1990s and 2000s acted as a long-term trend support for years. But after the 2021 rejection, Volkswagen lost that rising structure and moved back into a weaker range. This is a major change. It tells us the old long-term upward slope is no longer controlling price. Now the chart is moving between two important zones. The first zone is the current lower range around €75–€90. This is where price is trying to stabilize after the 2021 decline. However, stabilization alone is not enough. The chart still remains below the falling macro resistance, so the long-term structure is still compressed. The second and more important level is the red horizontal area around €62. This is the historical support zone. It connects old market memory from previous cycle structures and also sits near the projected meeting point of the falling resistance line in the future. If Volkswagen returns to that area, it would be a major long-term test. That level is not just a random support. It is the area where the market would decide whether Volkswagen is still building a multi-decade base, or whether the long-term industrial auto structure is losing another major support layer. The bullish case is simple but not confirmed yet. Volkswagen needs to hold above the long-term support region and eventually break the descending resistance that has controlled the structure since the 2008 extreme. Until that happens, every rally remains inside a larger compression pattern. The bearish case is also simple. If the current range fails and price returns to the €62 zone, the market will be testing the most important structural support on the chart. A clean loss of that level would weaken the long-term map significantly. So the current read is neutral to cautious. Volkswagen is not in a clean expansion structure. It is not showing a confirmed long-term breakout. It is still trading below macro resistance, after losing the older rising trend structure. But the chart is also not random. It is approaching the final phase of a long compression between descending resistance and historical support. The main question is this: Does Volkswagen defend the old structural base and prepare for a future breakout? Or does the long-term compression resolve lower? For now, the chart is not giving the final answer. It is showing the test.
XETR:VOW
by Cryptollica
11
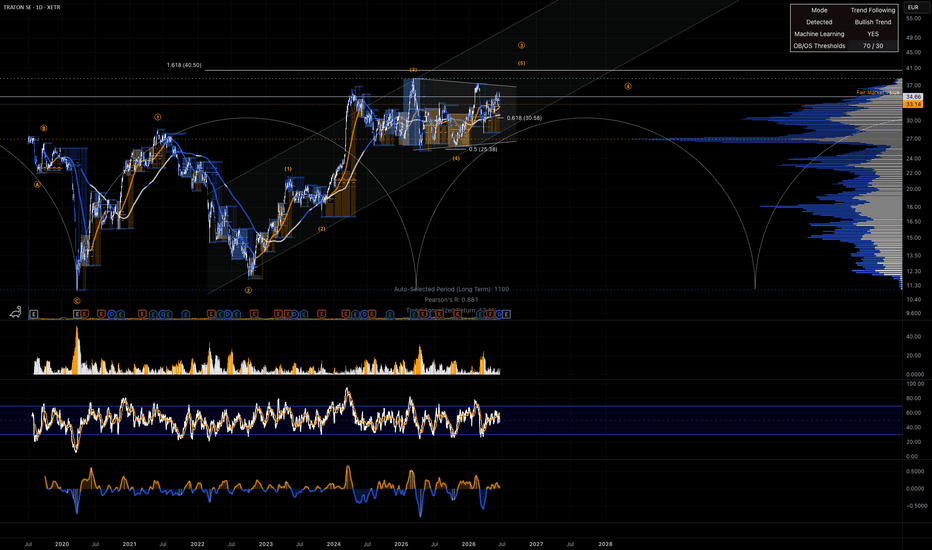
Anyone know the quality of the products provided by TRATON SE?Anyone know the quality of the products provided by TRATON SE ($8TRA)? Came up with a LongTerm target price of 82.80 EUR via TIKR. Looking at a 30.45 EUR entry.
XETR:8TRALong
by EndlessCode
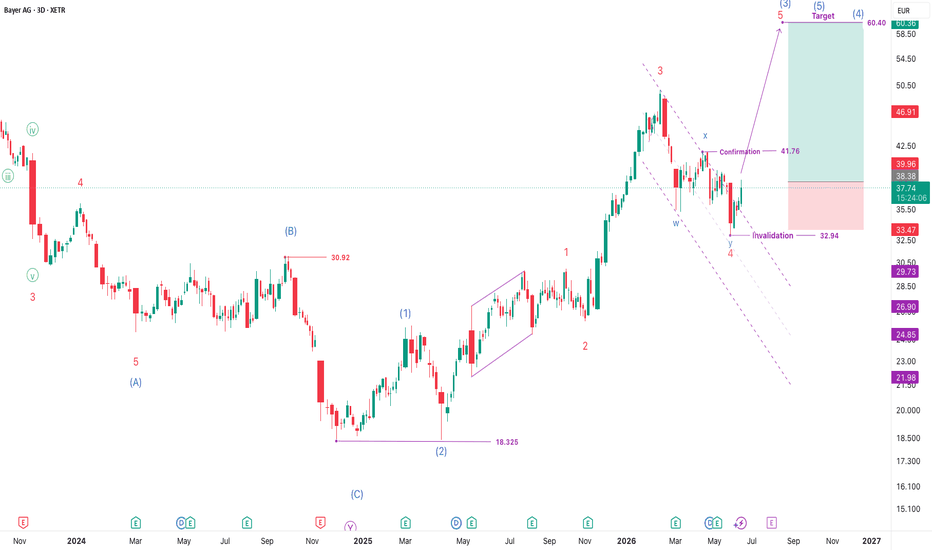
Bayer/USD long ideaBayer/USD 3D timeframe Looks like Bayer has completed a wave 4 red double zig zag WXY pattern and moving higher with wave 5 red, target around 60 and above. Confirmation: 41.76 Invalidation: 32.94
XETR:BAYNLong
by Sophia-ElliottWave
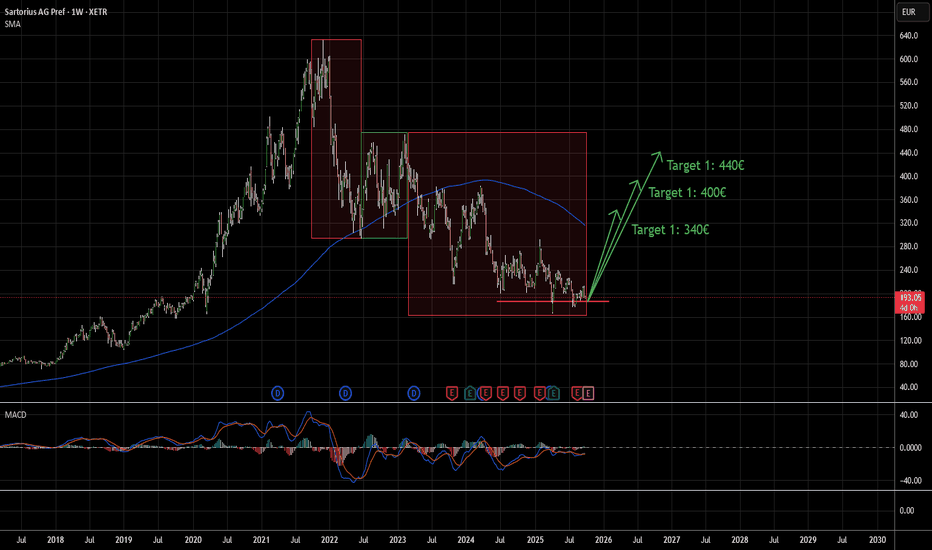
Sartorius AG Pref rocketing up Sartorius is bullish in short- and long term! After hitting target 1, 2 or 3, there will be a correction, before it will rocket up to all time high!
XETR:SRT3Long
by GGekko
Updated
11
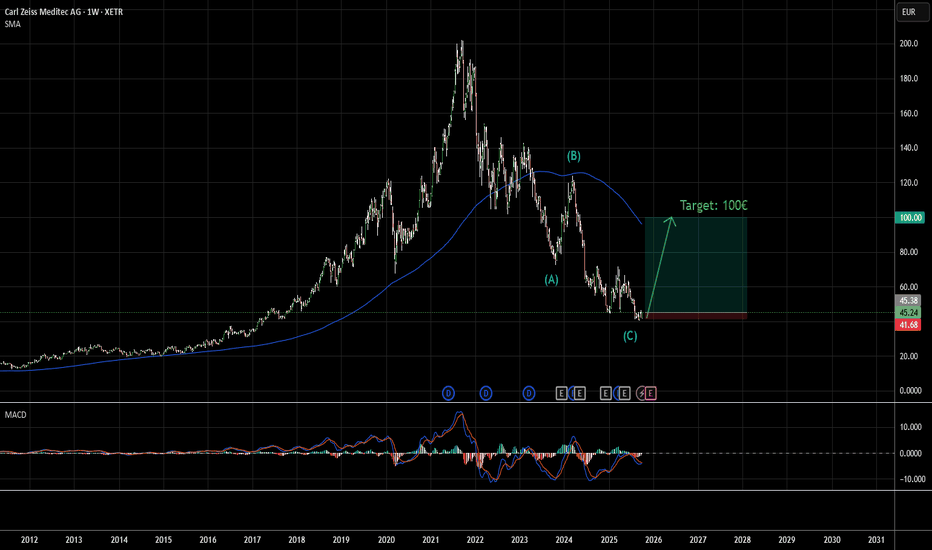
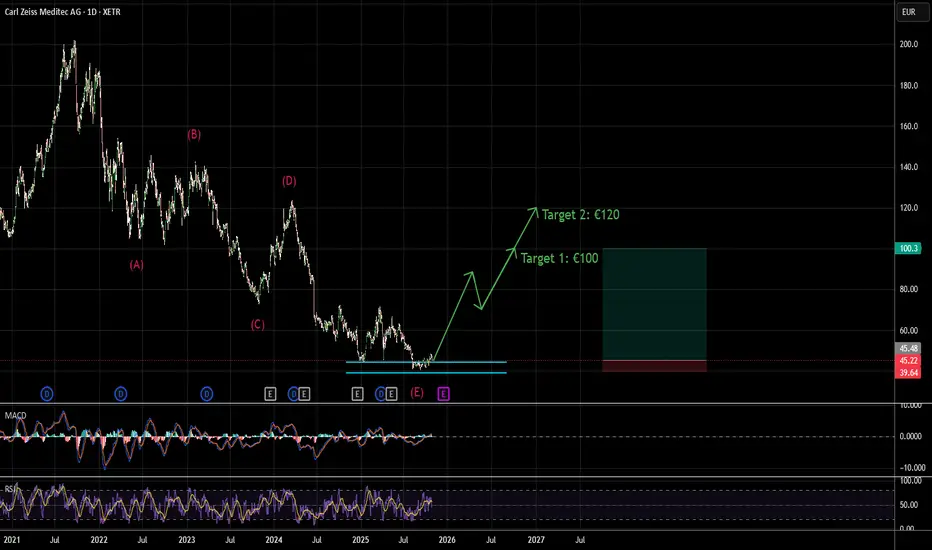
Correction Phase Completed, New Upside AheadCarl Zeiss Meditec has completed its correction phase. The next target is €100, implying a potential upside of 120% from the current price.
XETR:AFXLong
by GGekko
Updated
Carl Zeiss Meditec AG has reached rock bottomLow is reached in the blue zone. Mid term target is €100 +120% Long term target is €120 +160% I´m 100% bullish from here!
XETR:AFXLong
by GGekko
Updated
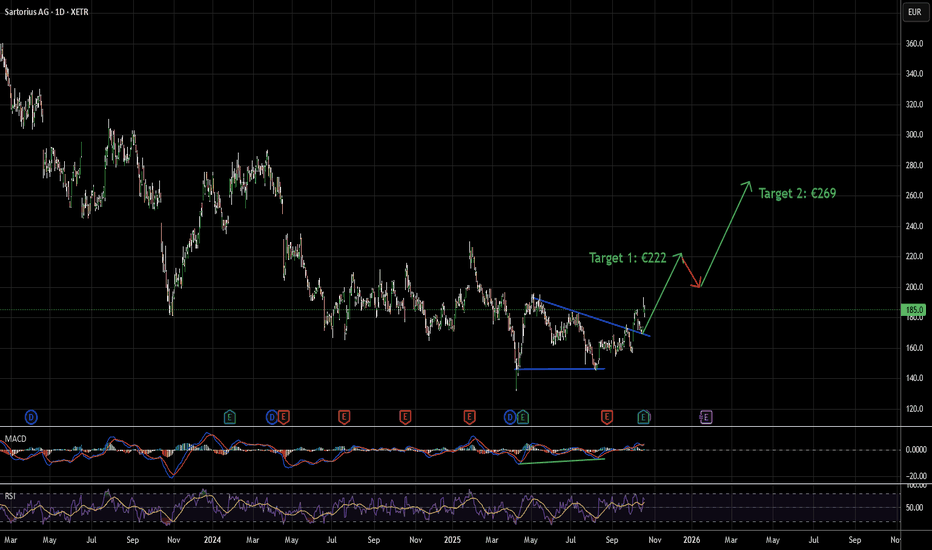
Sartorius is on the run - Bottom reached - Upside break approved -> We are 100% bullish
XETR:SRTLong
by GGekko
Updated
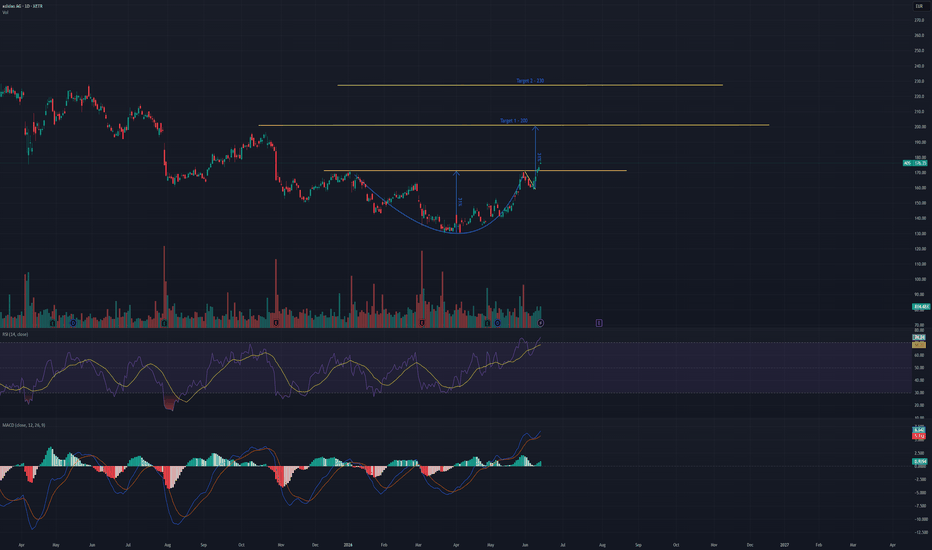
Will Adidas (ADS) Continue the Uptrend ? Adidas (ADS) appears to be breaking out of a classic cup-and-handle formation, with price reclaiming the €170 neckline after a healthy handle consolidation. Technical highlights: Cup-and-handle breakout in progress MACD remains bullish Strong relative momentum Measured move projects €200 initially, with €230 as an extended target Fundamental tailwinds: Official FIFA World Cup 2026 partner and match-ball supplier Strong Q1 results already boosted by World Cup demand July earnings could act as the next major catalyst Management continues to guide for strong sales and profit growth into 2026 Key level to watch: A sustained hold above €170-175 would strengthen the bullish breakout thesis and open the path toward the €200 target.
XETR:ADSLong
by shiranthas
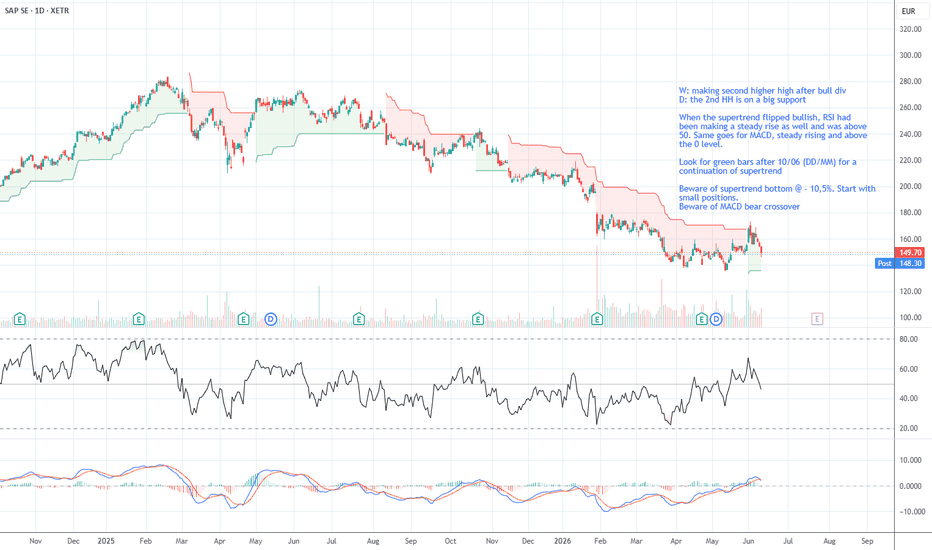
SAP: Trade Opportunity?This is not financial advice, this is my journal in which I will track my insights for the SAP stock and hopefully learn from my mistakes. Thoughts are in the chart. I haven't placed a position yet, I'm still considering wether a positive chart is worth investing in when the company might face a not so bright future due to AI Or maybe the stock is undervalued at the moment Only time will tell
XETR:SAPLong
by Arreat
Dher - 1wDher analysis for long and short ideas, the box is important s&r flip zone.
XETR:DHER
by joselinda
Hugo Boss (BOSS) – Liquidity Sweep & Institutional Long SetupLooking at the Daily chart for Hugo Boss AG, we can spot a highly probable institutional setup brewing. There is a lot of sell-side liquidity resting just below the recent swing lows (marked with green circles). These "poor lows" and unfinished auctions are likely to act as a magnet for the price before any real sustainable move upside can happen.
XETR:BOSSLong
by Viktor_Krabovsky
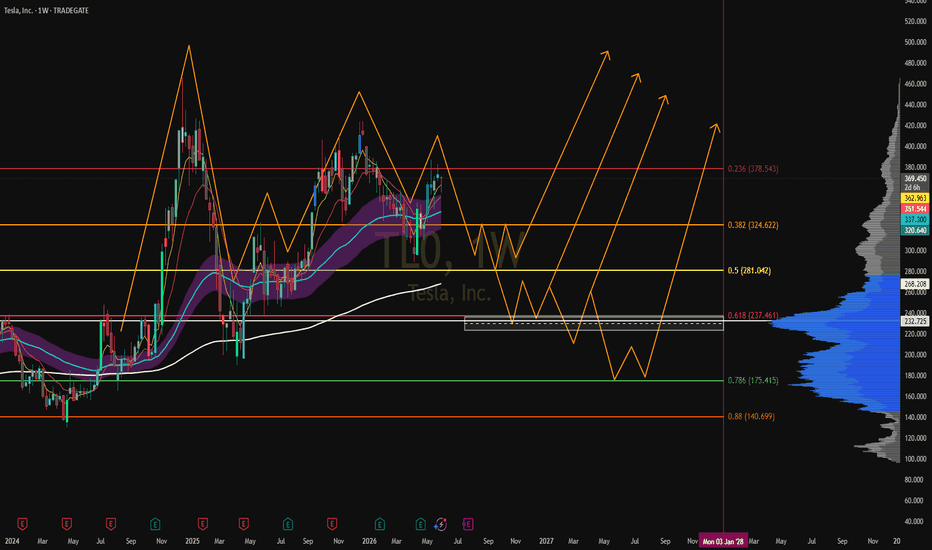
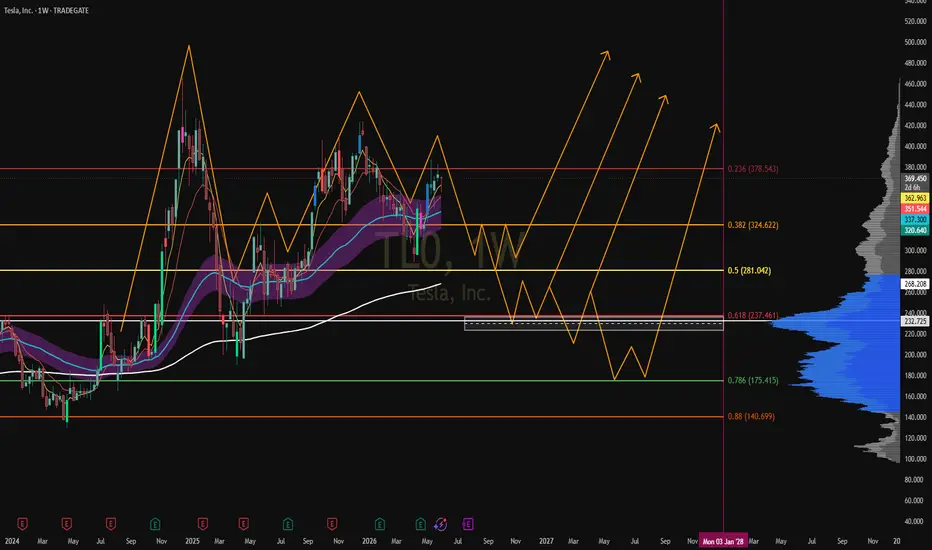
Tesla__📊 ****Tesla, Inc. (TSLA)****__ ISIN: US88160R1014 ****What the Company Does**** 🚗 Manufactures electric vehicles and batteries ⚡ Provides energy storage and solar solutions ****Future Potential**** 🤖 Advancing autonomous driving and robotics 📈 Growth in EV production and energy business ****Future Risks**** ⚔️ Competition from BYD, Volkswagen, and other EV makers 🌍 Regulatory challenges and supply-chain disruptions Only an idea, doesnt need to go down so much just idea for reversal
TRADEGATE:TL0Long
by robo414
PUMA: Multi-Year Downtrend Broken — WCL Retest Before €35–€38?XETR:PUM is sitting at a very interesting technical location. For years, price was controlled by a major descending trendline. Every recovery attempt was capped by that structure, keeping the bigger picture bearish. But now that trendline has finally been broken to the upside, and that changes the whole conversation. This is no longer just a stock stuck under a downtrend line. Now the question becomes: was the breakout real, or was it just a liquidity trap? From my view, the bullish structure is still active. The chart has a valid bullish ABC sequence, and as long as the B level remains intact, the C target remains a valid draw. That target sits around the €35–€38 zone , which makes it the main upside magnet if buyers continue defending the structure. What makes this chart even more interesting is the current location. Price is pulling back into the WCL zone , which I view as the buyer defense area. This is where buyers either reload and protect the sequence, or the structure starts losing strength. BC1 already did its job earlier. It gave the first reload before price expanded higher and broke through the long-term descending trendline. Now WCL becomes the next important test. If WCL holds, the bullish case stays strong: price defended structure, retested the breakout area, and still has an active C target above. If WCL fails, then I would watch BC2 as the deeper reload zone. That does not instantly kill the bullish idea, but it would mean buyers need to defend from lower prices before attempting the next leg. The invalidation remains simple: if B breaks, the bullish ABC sequence is no longer valid. So for me, the chart is not about blindly buying PUMA. It is about watching whether buyers can defend the WCL after a multi-year trendline breakout. If they can, the €35–€38 ABC target becomes very realistic. Not financial advice.
XETR:PUMLong
by SmellyTaz
Adidas Weekly: Bearish Until Proven OtherwiseXETR:ADS may be improving as a company, but the weekly chart is still carrying a bearish structural story. The key detail here is the invalidation line. Price already rejected from the larger WCL area, which is where sellers needed to defend if the broader bearish sequence was still active. After that rejection, price formed a new bearish ABC structure, and the lower C target remains valid as long as the sequence’s B is not breached. That is the whole point of this chart. I am not saying Adidas must collapse in a straight line. I am saying the bearish draw remains structurally alive until buyers break the invalidation level. Below that line, sellers still have the argument. Above that line, the bearish thesis is dead. Right now, price is trading around the mid-160s after already reacting lower from BC1. The next important area for me is BC2. If price retraces into BC2 and fails there, that could become the next bearish continuation point toward the macro C target. The strongest part of this setup is that it is not based on emotion or opinion. It is based on structure: Price rejected WCL. BC1 already reacted. BC2 is the next possible reload zone. The bearish C target remains valid. Invalidation is clearly marked above B. Until that invalidation line breaks, the downside map stays open. A clean bearish thesis does not need price to drop immediately. It only needs the structure to remain valid. Bias : Bearish while below invalidation Key zone : BC2 Invalidation : Break above B / invalidation line Main draw : Bearish ABC C target Not financial advice.
XETR:ADSShort
by SmellyTaz
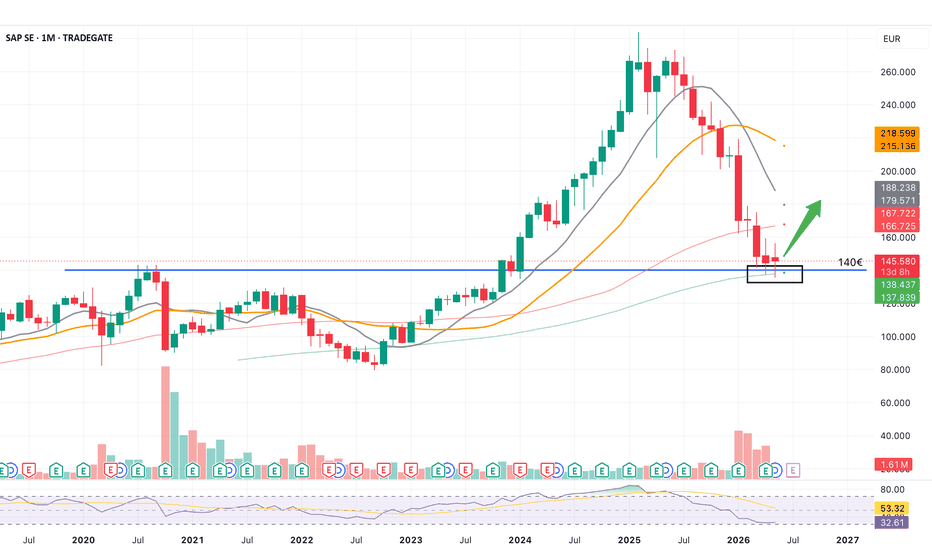
Artificial SAP-iencePreliminary Info SAP sells enterprise resource planning software, known as ERPs, which serve as the actual central nervous system to coordinate accounting, human resources, logistics, and sales for any large organization within a single digital environment. In recent years, the company has transformed its business model, shifting from selling single licenses to Cloud subscription contracts. It is precisely this transition that guarantees solid and predictable revenue growth for the coming years. Indeed, the mass migration of its massive legacy customer base to Cloud services generates recurring and stable cash flows that are recording consistent double-digit increases. This is supported by a backlog of future contracts already signed exceeding €21 billion, which secures long-term revenues. Added to this dynamic is the integration of "Business AI" into its operational software. This allows SAP to increase the average contract value through the upselling of advanced artificial intelligence features, thereby enabling global revenue to expand rapidly thanks to a unique combination of guaranteed renewals and new high-margin revenue streams. +++++ Analysis The price dropped by 50%, hitting the €140 support level following the wild sell-off that hit the entire software sector due to fears surrounding the impact of AI. In addition to the support level, the price also reached the Monthly SMA100 (green line), where it has been hovering for a couple of months. At the moment, a reversal pattern has not yet formed, but I believe a recovery is imminent. +++++ My Personal Take In my opinion, this hoax about AI causing software companies to go bankrupt is just manipulated news designed to push the sector's leading giants down to their lows. These companies hold hundreds of patents and confidential databases stored in proprietary formats… it is far more likely that these very companies will reap the greatest benefits from using AI in the coming years. This is the best time to take a position before takeoff. Updates to follow. If you appreciate my insights, please leave a like
TRADEGATE:SAPLong
by balinor
Updated
55
Gap Filled & Strong Rebound — Bullish Reversal PlayEUR chart analysis. Just my thoughts but the recent sharp drop out of the purple ascending channel wasn't a structural breakdown, it was a liquidity run. This flush completely filled the massive price gap left behind from late April/early May and we just had a strong rebound at 36.55 eur. What I see next: First Target: 38.675 Secondary Target: 41.670 Invalidation If: We get a daily close below 35.437 I stay however cautious for more upside (above 41eur+ in short/medium term due to lack of catalyst). keep in mind that their top drugs in phase 3 development might only reach the market by late 2029 (I expect results of phase 3 late 2027 beginning of 2028).
XETR:NOV
by Dalyana
44
My vision for hugo boss (BOSS)This is my ideal setup to buy hugo boss shares after withdrawing liquidity at a price of around 32.7-31.5 euros. If the price drops below 30 euros on the decline, I would be very cautious and wait for another washout.
XETR:BOSSLong
02:55
by Viktor_Krabovsky
11
112233445566778899101011111212131314141515161617171818191920202121222223232424252526262727282829293030313132323333343435353636373738383939404041414242
…999999

Made by humans

Select market data provided by ICE Data Services. Select reference data provided by FactSet. Copyright © 2026 FactSet Research Systems Inc.Copyright © 2026, American Bankers Association. CUSIP Database provided by FactSet Research Systems Inc. All rights reserved. SEC filings and other documents provided by Quartr.© 2026 TradingView, Inc.

More than a product
  • Supercharts
Screeners
  • Stocks
  • ETFs
  • Bonds
  • Crypto coins
  • CEX pairs
  • DEX pairs
  • Pine
Heatmaps
  • Stocks
  • ETFs
  • Crypto coins
Calendars
  • Economic
  • Earnings
  • Dividends
  • IPOs
More products
  • Portfolios
  • Fundamental Graphs
  • Yield Curves
  • Options
  • Macro Maps
  • Pine Script®
  • MCP Server
Apps
  • Mobile
  • Desktop
Community
  • Social network
  • Wall of Love
  • Refer a friend
  • Creator program
  • House Rules
  • Moderators
Ideas
  • Trading
  • Education
  • Editors' picks
Pine Script
  • Indicators & strategies
  • Wizards
  • Freelancers
  • Marketplace
Tools & subscriptions
  • Features
  • Pricing
  • Market data
  • Gift plans
Trading
  • Overview
  • Brokers
  • Brokers comparison
  • The Leap
Special offers
  • CME Group futures
  • Eurex futures
  • US stocks bundle
About company
  • Who we are
  • Space mission
  • Blog
  • Help Center
  • Careers
  • Media kit
Merch
  • TradingView store
  • Tarot cards for traders
  • The C63 TradeTime
Policies & security
  • Terms of Use
  • Disclaimer
  • Privacy Policy
  • Cookies Policy
  • Accessibility Statement
  • Security tips
  • Bug Bounty program
  • Status page
Business solutions
  • Widgets
  • Charting libraries
  • Lightweight Charts™
  • Advanced Charts
  • Trading Platform
Growth opportunities
  • Advertising
  • Brokerage integration
  • Partner program
  • Education program
Community
  • Social network
  • Wall of Love
  • Refer a friend
  • Creator program
  • House Rules
  • Moderators
Ideas
  • Trading
  • Education
  • Editors' picks
Pine Script
  • Indicators & strategies
  • Wizards
  • Freelancers
  • Marketplace
Business solutions
  • Widgets
  • Charting libraries
  • Lightweight Charts™
  • Advanced Charts
  • Trading Platform
Growth opportunities
  • Advertising
  • Brokerage integration
  • Partner program
  • Education program
Look FirstLook First