Long
Long
 Long
Long
 Long
Long
 Long
Long
 Long
Long
 Short
Short
 Long
Long
Deep Structure, Clean Risk, Big PotentialAVL is starting to look genuinely interesting here. Yes, it’s a small‑cap, highly speculative commodity play, but the structure developing on the chart is hard to ignore.
The current accumulation range shows multiple Phase B rallies, which deviates from the generic Wyckoff schematic most traders are familiar with. Those repeated bumps strongly suggest the Composite Operator was distributing into breakout enthusiasm, while retail money chased the early strength. Once that liquidity was absorbed, price unwound into a clean corrective leg.
That pullback from the May 23 high appears to have completed into the July 25 low, which is now acting as a potential Last Point of Support (LPS). LPS identification is rarely obvious in real time, but there are constructive signs here:
- the descending trendline has been broken
- demand is beginning to show up on the right side of the structure
- the reaction into the LPS held above the prior support shelf
From a technical perspective, this gives traders a valid long setup with risk defined beneath the LPS.
That said, there’s still a realistic scenario where price rejects this area and rotates lower toward the S1 yearly pivot, forming a deeper Spring. For that to unfold, we’d need to see a decisive move down followed by a monthly close back inside the range. If that happens, the following month’s open becomes the high‑probability entry and the risk‑to‑reward expands significantly.
This idea gains further weight when you look at the new yearly pivot structure. When price moves sideways between the yearly pivot and S1, it often tests the nearest pivot first. In this case, the yearly pivot, before driving into S1 and then launching back above the pivot zone. It’s a behaviour almost no one understands, yet AVL is following it cleanly, and it aligns perfectly with the potential Spring scenario.
There’s still plenty to play out, but whether the LPS holds or we get the deeper Spring, the chart is offering some attractive upside targets. These are large TPs, not guarantees — simply the major resistance zones that stand out on the chart.
In short:
LPS may already be in → early long with tight risk.
Spring still possible → deeper test into S1 before the real markup.
Pivot structure supports both paths, with the Spring offering the cleaner confirmation.
Either way, AVL is entering a part of the cycle where the chart finally matters again.
*Please note arrows are not time based just overall price path expected  Long
Long
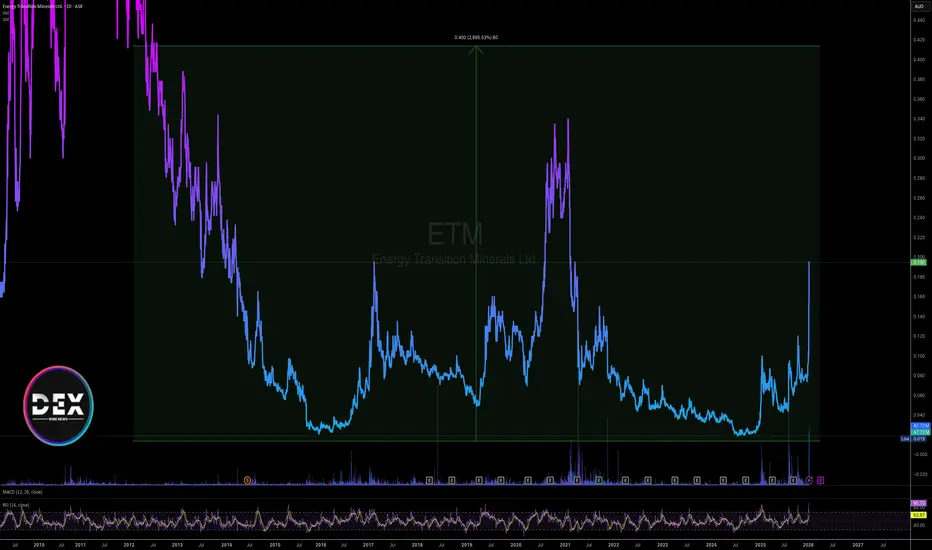
Energy Transition Minerals Ltd ASX: ETM) Hits New HighsFollowing our continued coverage of Energy Transition Minerals Ltd (OTC: GDLNF | ASX: ETM), the move has accelerated again — and decisively.
Since our initial alert near $0.091, ETM has now pushed to new highs around $0.20, delivering over 119% in gains. In yesterday’s session alone, the stock surged 22%, extending its run of higher highs and higher lows. Volume remains elevated, reinforcing that this is not a one-day spike, but sustained participation as price discovery continues.
ETM is now up +146.84% over the last 52 weeks, supported by consistently elevated volume and expanding market participation.
Recent developments, including the engagement of Cohen & Company Capital Markets to evaluate a Nasdaq listing and broader U.S. capital markets strategy, further reinforce the institutional trajectory of the story. With Kvanefjeld remaining one of the most strategically relevant rare earth and uranium assets globally, ETM is transitioning from speculative interest to sustained price discovery.
ETM has transitioned into active price discovery after advancing from $0.091 to new highs near $0.20, supported by sustained volume and renewed focus on strategic rare earth supply.  Long
Long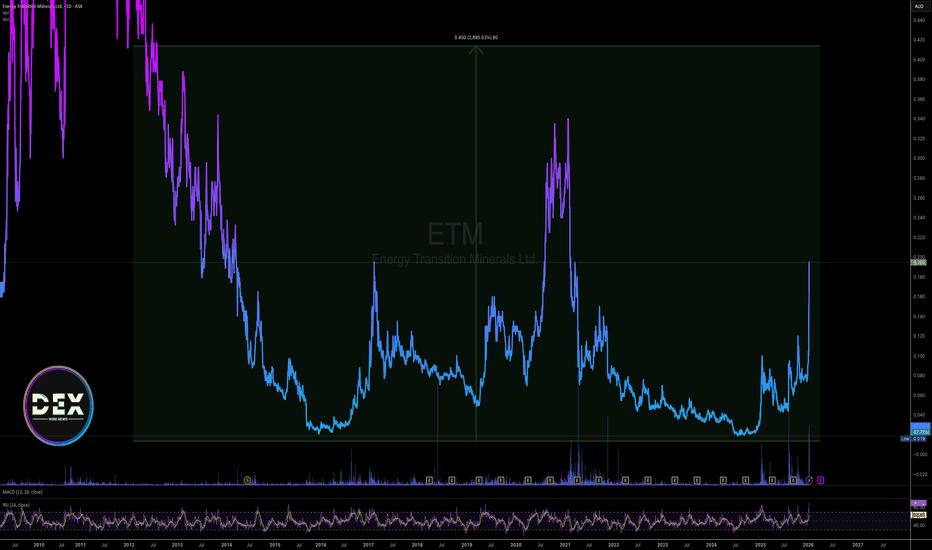
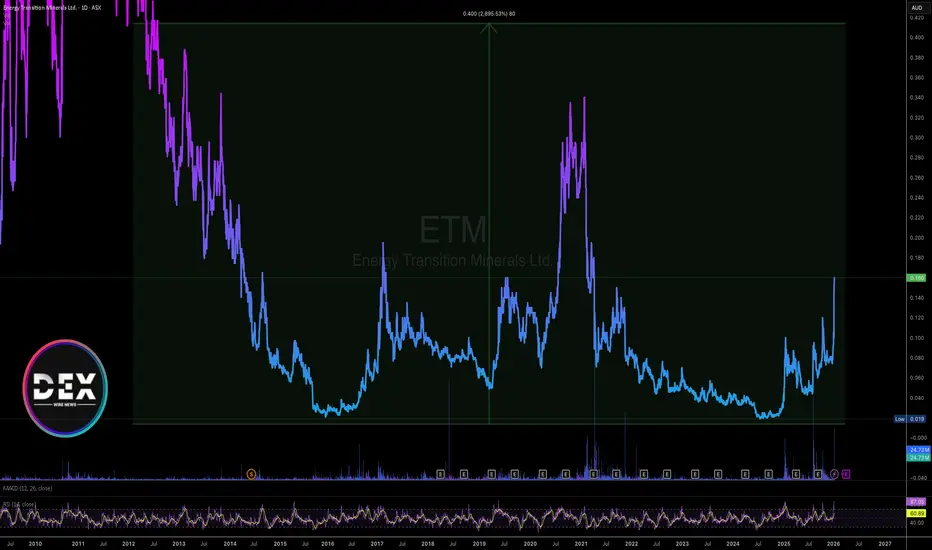
Energy Transition Minerals Ltd (OTC: GDLNF | ASX: ETM) Rips +80%Energy Transition Minerals Ltd (OTC: GDLNF | ASX: ETM), the move has accelerated meaningfully.
Since our initial alert, ETM has surged from approximately $0.091 to a high of $0.165, delivering over 81% in gains in a remarkably short window. Momentum has not just continued; it has expanded, printing a new 52-week high near $0.16 per share, supported by heavy volume of 24.73 million shares.
This follows prior sessions that saw volume exceed 40 million shares, reinforcing a clear trend: liquidity is building, not fading, and market participation continues to broaden.
Earlier, we highlighted insider alignment when NIA’s President increased his position to 1.2 million shares. Since then, price action has validated that signal, with buyers consistently stepping in at higher levels and absorbing supply.
At the core of the story is Kvanefjeld, ETM’s flagship rare earth and uranium project in southern Greenland — one of the largest and most strategically significant rare earth assets globally. The project sits squarely at the intersection of rare earth elements, lithium, and geopolitical supply security, themes that remain front-and-center for global policymakers and capital allocators.
Adding another layer to the setup, Energy Transition Minerals recently announced the appointment of U.S. advisors to assess an optimal path to access U.S. capital markets.
The company has engaged Cohen & Company Capital Markets as exclusive U.S. financial advisor to support Nasdaq listing strategy, M&A advisory, and capital markets engagement. Cohen is a leading SPAC underwriter, having led 28 SPAC IPOs in 2025 and advised on 24 announced or completed De-SPAC transactions during the same year. Long 
Relief Rally Incoming?It’s been a punishing stretch for TWE holders, but price action has now pulled back into a critical zone where a relief rally could emerge. The broader trend remains bearish, so any positioning here must respect that context.
Key Support Factors
1. 200% retracement from the 2018 double top.
2. Low Volume Node (LVN) zone, indicating limited price acceptance and potential for sharp moves.
3. Demand structure anchored by the August 2015 candle.
4. Historical tops acting as structural support.
5. November monthly candle showed notable demand — high volume on a narrow spread.
6. 11 consecutive weeks down in a single swing, aligning with Gann’s 7–10 bar exhaustion principle.
7. Proximity to the yearly S4 pivot, reinforcing the demand zone.
Trade Scenario 1 – Aggressive Entry
Setup: Despite no confirmed trend reversal, risk-tolerant traders could begin scaling in here, supported by the confluence of demand factors.
Stop Loss: 5.22 — just beneath the demand structure and S4 pivot.
Take Profit: Initial target at the midline (EQ) of the downward channel. If price breaks cleanly above, extend targets toward the upper bounds of the channel.
Trade Scenario 2 – Throw-Under Reversal
Setup: If the S4 pivot and demand structure fail, watch for a throw-under pattern whereby price dips below support but quickly reclaims the range.
Confirmation: A bullish hammer or doji on surging volume, ideally accompanied by negative sentiment, would strengthen the reversal case.
Take Profit: Similar roadmap to Scenario 1 — first target at the channel EQ, then potentially the upper boundary if momentum builds.
Summary
This is a high-risk, counter-trend play. The confluence of structural supports, exhaustion signals, and pivot proximity offers a tactical window for relief. However, discipline around stops and scaling is essential, as the long-term bear market backdrop remains intact.
* Note, price pathing is not time based, just the overall price movement
Indicators. How I use key Mom/Vol indicators with no ClutterI will keep this short.
It's hard to understand indicators cluttered & clustered over our charts.
How I "house" indicators is shown in diagram or look below at screen layout.
Most important:
In screen layout
Symbol, Interval, Cross hair, Time, turn on.
This is to ensure that indicators on right of split are processed on the same Timeframe as your enquiry TF.
For eg. 4Hr chart for price (left) is also consistent with 4Hr chart (right) indicators.
Ie. Left and right screens balance. Or result will be wrong and very skewed.
The momentum and timing of indicators is crucial.
Basically, TSI True Strength Index is a lot like MACD but perhaps more accurate.
Seer how this stock, one of my own, curls up just above zero line.
Stochastic's Momentum Index is important and perhaps best indicator for timing and strength. See the curling up or cross up above -40 , not in oversold or overbought 'land',. this snapback is exactly what BTCUSD did recently to show its hand when the DXY was rallying.
Be aware that Stochastics basic or the Momentum index is a powerful way to view momentum. Dont be caught up in the thinking that the indicators are generating the power. These indicatorsvare displaying a visual representation of mometum that is tied to the price action itserlf.
People who try to discredit indicators for various reasons including to promote their own setups, weill say indicators "Lag or indicators are rubbish". I can assure you that when i sometimes apply RSI to my breakout trading, even on 1 second charts there is no evidence of lagging, RSI is key at 50 and Stochatic's indicates maximum momentum at higher and lkower levels for buy & Sell mometum trades.
Besides i look at D, W, M charts where sligfht lag is probably not going to be problematic.
Bottom line: Insitutions use main indicators for momentum and its how they are applied thart makes the difference.
I use them as a way to confirm my setup. They are a lkayer of confluence and if used this way can determine when and when not to trade and even the cycles of a market using the indices like SnP500.
RSI is at or near 50 level . 50 is key and this level acts like a magnet drawing price higher or lower of 50 depending on what the trade is.... long or short.  Long
Long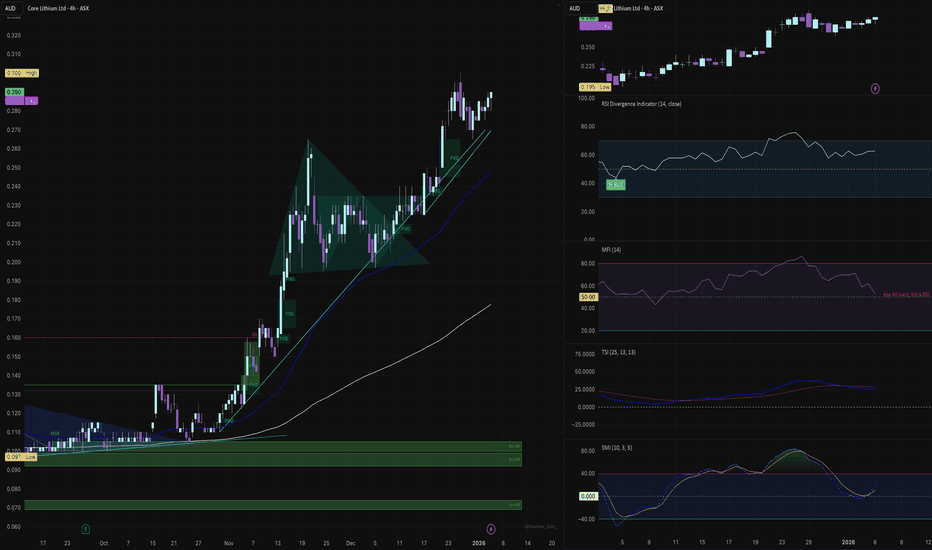
 Long
Long
 Short
Short
 Long
Long
 Long
Long
AUC Pulling Into Key AOI
AUC setup is shaping up well. After the initial breakout on expanding volume, price has pulled back ~30% and now retesting the top of the prior range. That’s a healthy retrace, and structurally, the chart still leans bullish.
Entry
You could begin scaling in here, but the more compelling support zone sits closer to ~$0.56. Notably, October closed with heavy volume and a bearish engulfing candle so ideally, we want to see this pullback continue on declining volume with overlapping candles. That would signal absorption rather than distribution.
Take Profit (TP)
• First TP sits around the EQ of the monthly supply structure (already marked).
• Beyond that, there’s minimal overhead resistance, so you can trail stops using higher swing lows as they form.
Stop Loss (SL)
• Since we haven’t seen a new swing low (LPS) yet, the $0.220 LPS remains the logical invalidation point.
• Once a monthly higher low confirms, you can tighten the stop accordingly.
• Until then, risk management is key especially for a small cap stock
 Long
Long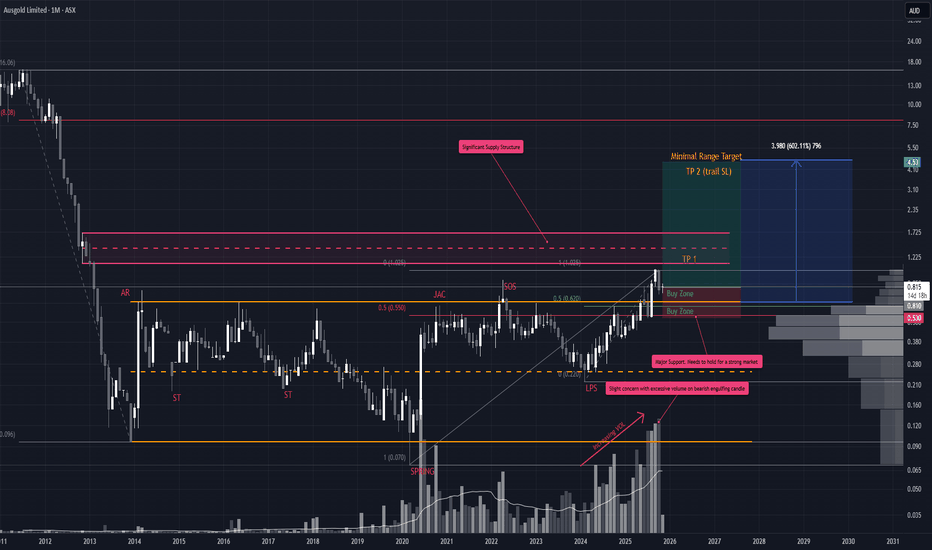
 Long
Long
 Long
Long
 Long
Long
 Long
Long