SBM Bullish to fill the gapTechnical Commentary – SBM (St Barbara Limited)
SBM has formed a textbook double bottom pattern, confirming a bullish reversal from prior downtrend conditions. The price action has since broken above neckline resistance and is now trending within a well-defined rising channel, supported by increasing volume and aligned moving averages.
The stock is currently targeting the next major supply zone around 44c, where a previous gap remains unfilled. The recent wave structure suggests a classic Elliott Wave impulse, with the current leg aiming for wave (5), coinciding with this resistance level.
Short-term momentum remains strong, with bullish alignment across the 20, 50, and 100-day moving averages. A break and close above 44c may signal a continuation toward higher resistance zones established in late 2023.
Key Levels:
Support: 33c–34c (previous resistance turned support)
Resistance: 44c (gap fill target)
Trend: Bullish above 30c
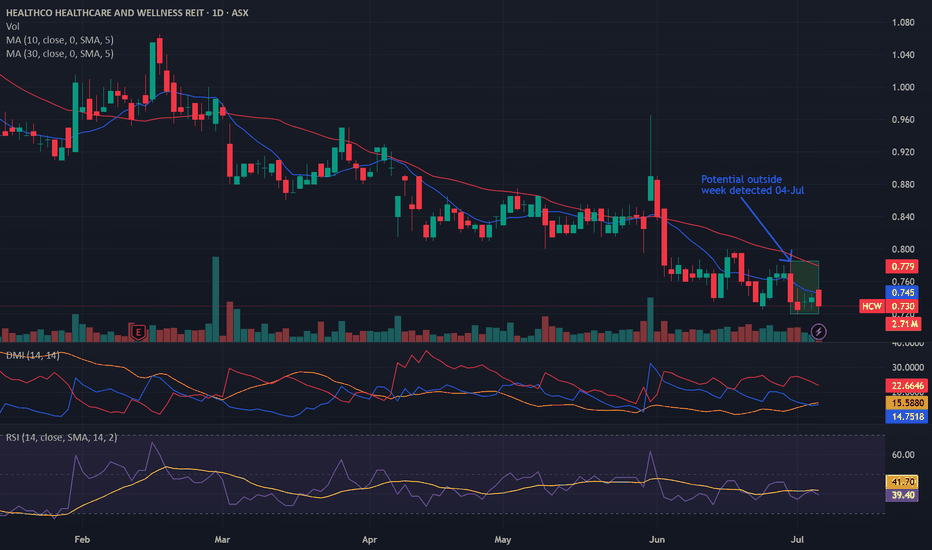
Potential outside week and bullish potential for NEMEntry conditions:
(i) higher share price for ASX:NEM above the level of the potential outside week noted on 13th June (i.e.: above the level of $88.35).
Stop loss for the trade would be:
(i) below the low of the outside week on 11th June (i.e.: below $80.70), should the trade activate.
Bellevue Gold - chart indicates recovery after 30% dropHi, thanks for viewing.
I'm going to look deeper into Bellevue and position myself for a significant purchase. But won't be buying just yet.
So, some people see Elliot Wave as reading tea-leaves or goat entrails. But, it does help with market timing sometimes. It isnt everything. But, I find it helpful, especially when combined with 'coincident targets' using Elliot Wave, support and resistance, and RSI divergence.
If the correction is an "A-B-C" three wave correction, the third wave, wave C is often the same length as wave A.
RSI divergence, I look for three lower lows on the price chart, paired with three higher lows on the RSI the first two in the over-sold area and the third higher low fails to push into the over-sold RSI region / below 30. For these conditions, it appears one more drop seems warranted.
But would have to look into the fundamentals, because the gold price just had its highest weekly close. It is hard to see it going lower in this environment without major cost-overruns / profitability challenges / technical mining bottle-necks.
The red box denotes an area where I believe the Elliot wave rules have been breached. Normally Wave C would have five sub-waves. Wave (v) may unfold, but it looks to be the shortest of the three sub-waves if it reaches my blue box target. One EW rule is that wave (iii) may not be the shortest of the three, but it can be shorter than wave (i). In this bullish gold price environment, the 30% drop may not occur. Will have to look into it. For now, watching from the sideline. Good luck everyone.
$NRW gap to Fill, bullish, Head and Shoulder breaks neckline🔍 Current Technical Setup
Price: $2.92 AUD
Trend: Recent bullish reversal from lows near $2.00
Volume: Increasing volume on the uptrend — a bullish sign of accumulation.
Moving Averages:
Short-Term EMA (10): $2.82 — price is above = bullish.
EMA (50): $2.61 — price is also above = uptrend intact.
SMA (200): $3.25 — price below = long-term resistance remains.
🧠 Key Chart Patterns & Levels
Structure: Cup & Handle / Inverted Head and Shoulders-like bottom formation from the April–June base.
Breakout Zone: Just broke through minor resistance around $2.90 with strong volume.
Gap Fill Zone: Between $3.10–$3.30 (highlighted grey box). This is a key target area where price previously sold off — likely to act as resistance.
Major Resistance: The 200-day SMA at $3.25 aligns with the upper edge of the gap zone = high confluence resistance.
📈 Bullish Scenario (High Probability ~60–70%)
Price continues to rally on strong volume to test the gap resistance zone.
Target: $3.10 to $3.30 in the short term (5–15% upside).
A daily close above $3.30 would confirm a structural breakout toward previous highs near $3.80–$4.00 (medium-term target).
📉 Bearish Scenario (~30–40% Probability)
Price rejects off $2.90–$3.00 and retests support at the 50 EMA (~$2.60).
If it loses the $2.50 level again, the structure weakens and re-tests lows near $2.10–$2.20 become possible.
🎯 Trading Strategy & Risk
Entry zone (momentum): $2.85–$2.95 (already underway).
Short-term Target: $3.10–$3.30
Medium-term Target: $3.80
Stop loss: Below $2.70 (just under the 50 EMA and recent swing low).
Risk:Reward: About 1:2 or better toward the gap fill.
🧠 Summary
NRW (NWH) is showing a strong bullish reversal from a major base with increasing volume. The short-term structure supports a gap fill to $3.10–$3.30, with a medium-term potential back to $3.80 if it breaks the 200 SMA cleanly. However, resistance is expected near that region and caution is warranted around $3.25.
Would you like a trade plan or probability table next?
Bearish potential detected for NHCEntry conditions:
(i) lower share price for ASX:NHC along with swing of DMI indicator towards bearishness and RSI downwards, and
(ii) observing market reaction around the share price of $3.57 (open of 11th April).
Stop loss for the trade would be:
(i) above the high of the recent swing high once the trade is activated (currently $3.75 from the high of 19th May).
Bullish potential detected for DRREntry conditions:
(i) higher share price for ASX:DRR along with swing up of indicators such as DMI/RSI.
Depending on risk tolerance, the stop loss for the trade would be:
(i) a close below the 50 day moving average (currently $3.63), or
(ii) below previous support of $3.49 from the open of 14th March, or
(iii) below previous support of $3.34 from the open of 5th September.
Bullish potential detected for ABGEntry conditions:
(i) higher share price for ASX:ABG along with swing up of indicators such as DMI/RSI.
Depending on risk tolerance, the stop loss for the trade would be:
(i) a close below the 50 day moving average (currently $1.148), or
(ii) below previous resistance (now support) of $1.14 from the open of 28th March, or
(iii) below previous support of $1.09 from the open of 9th April / 14th January.
another breakoutKCN has done well sinces the previous breakout
of a triangle formation.
The Weekly line chart closing at a new high shows bullish signals
for the price of KCN.
I expect it to slowly climb to the next target of 5.50
which is about 100% gain on this break.
Gold price will continue to rise as Wars need printed money.
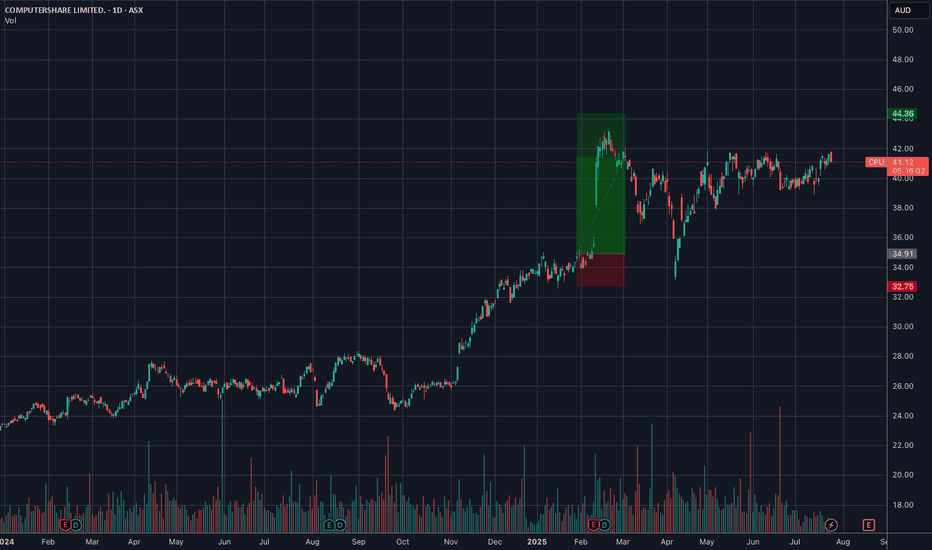
BUY IDEA: CPU.ASX – VCP Breakout in Motion
💰 Entry: $41 - 42
🛑 Stop: $39.50
🎯 Target: $44.80+ (1.5–2R potential)
⸻
🧠 Setup Thesis
CPU.ASX is breaking out of a textbook Volatility Contraction Pattern (VCP) with clean tightening just above the 21EMA and 50MA. After weeks of base-building with declining volume, today’s breakout comes with:
✅ Strong closing candle
✅ Volume expansion
✅ All key MAs supporting the move
This breakout follows a multi-month uptrend, and the current risk:reward is ideal with defined structure.
⸻
🔍 Trade Management
• Trim 1/3 at +1R (~$43.40)
• Trail remainder above breakeven
• Invalidation: Close below $39.50
⸻
🔎 Why This Matters
• Breakouts with strong volume post-VCP are among the highest probability setups
• CPU has strong institutional backing and is benefiting from a broader rally in quality tech & services on the ASX
• Low VIX and bullish sentiment post-CPI create a supportive macro backdrop
DISCLAIMER : The content and materials featured are for your information and education only and are not attended to address your particular personal requirements. The information does not constitute financial advice or recommendation and should not be considered as such. Risk Management is Your Shield! Always prioritise risk management. It’s your best defence against losses.
Finer Market Points: ASX Top 10 Momentum Stocks: 11 Jun 2025 TraCSE:DTR AMEX:EPM NYSE:ELS ASX:MTM LSE:TMG $4DS NYSE:EOS $G50 PSE:RLT GETTEX:SHN Momentum leading shares are the market's best performers today. They are the fastest-growing shares on the ASX over the last 90 days. These companies can't get to be leaders without first appearing on our Launch Pad list. The Launch Pad List is shared on Thursdays and the video interview published after market close on Fridays. Today's ASX's Top 10 Quarterly Momentum Stocks are: Dateline Resources Limited (DTR) Eclipse Metals Limited (EPM) Elsight Limited (ELS) MTM Critical Metals Limited (MTM) Trigg Minerals Limited (TMG) 4DS Memory Limited (4DS) Electro Optic Systems Holdings Limited (EOS) G50 Corp Limited (G50) Renergen Limited (RLT) Sunshine Metals Limited (SHN)
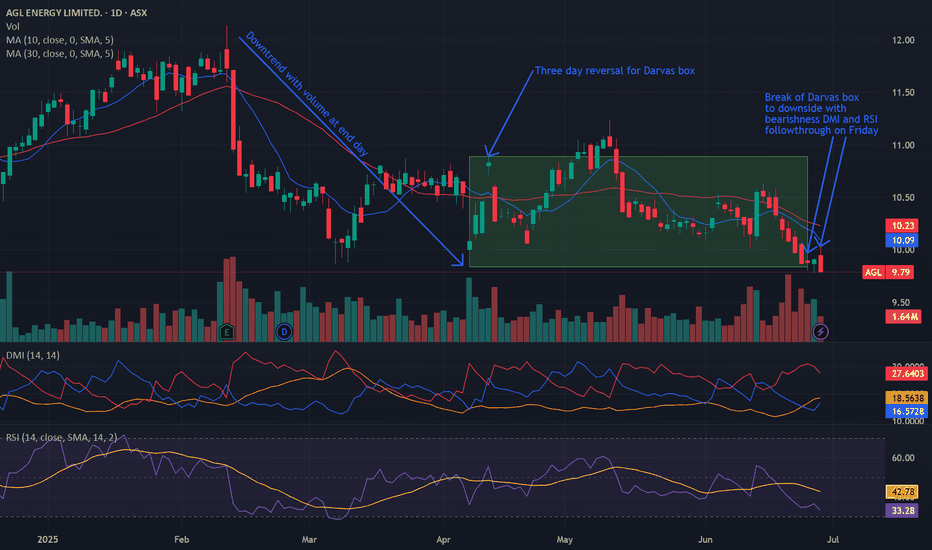
Bearish potential detected for AIAEntry conditions:
(i) lower share price for ASX:AIA along with swing of DMI indicator towards bearishness and RSI downwards, and
(ii) close below the 200 day moving average, and
(iii) observing market reaction around the share price of $7.08 (open of 8th April).
Stop loss for the trade would be:
(i) above the high of the recent swing high once the trade is activated (currently $7.41 from the high of 8th May).
Win:win:win You can make money while doing goodCheck this one out!
They just announced yesterday that they had a test that detected 100% of early-stage, min, and late-stage ovarian cancers in a study on 500 individuals. No missed cases. less than 23% false positives and 0% false negatives.
There is currently no screening technology for ovarian cancer. This makes it likely that large companies will be clamouring to bid on the tech. Which is a great thing. Early detection isn't common, but early detection can increase survival rates from 50% to 90%+ after 5 years. That is a very meaningful and tangible delta in terms of lives that will be saved once this is rolled-out world-wide.
I didn't have time to research them in-depth before buying in. But I will learn more about them if I have funds available to increase the position. Small-cap highly likely to attract buyers. Excellent work coming out of Australia! They have other tech in development, including a multi-cancer screening test. If the tech on that is as good as the tech announced yesterday, this could seriously improve the early-detection, treatment, and survival rates for a wide-swath of cancers.
Could you find a more positive story to invest in?
Bearish potential detected for PDNEntry conditions:
(i) lower share price for ASX:PDN along with swing of DMI indicator towards bearishness and RSI downwards, and
(ii) close below the 50 day moving average (currently $5.91), and
(iii) observing market reaction around the share price of $5.72 (open of 28th March).
Stop loss for the trade would be:
(i) above the high of the recent swing high once the trade is activated (currently $6.35 from the high of 2nd May).
Bullish potential detected for SSMEntry conditions:
(i) higher share price for ASX:SSM along with swing up of indicators such as DMI/RSI.
Stop loss for the trade would be:
(i) below the support level from the open of 13th March (i.e.: below $1.725), or
(ii) below the support level from the open of 26th February (i.e.: below $1.67), or
(ii) below the support level from the open of 7th April (i.e.: below $1.645), depending on risk tolerance.
Bullish potential detected for RIOEntry conditions:
(i) higher share price for ASX:RIO along with swing up of indicators such as DMI/RSI.
Depending on risk tolerance, the stop loss for the trade would be:
(i) below the recent swing low of 14th May (i.e. $118.63), or
(ii) a close below the 200 day moving average (currently $116.88), or
(iii) a close below the 50 day moving average (currently $115.66).
PLY - playside studios long term buy setupHey people,
looking at this is a complete running flat, with an impulse and pullback to start the upside. Labelled as a wxyxz for a complete c wave. Lots of divergence on the way down with indicators showing reversal setup for longs. Shown as an 87.8% undervalued stock via simply wall street. I believe this will break the previous top of 1.425 as a minimum. Long-term hold buy setup. Watch this space!
Trade safe
Buy Idea for MQG (Macquarie Group Ltd)📈 Buy Idea – MQG.ASX
🔹 Entry: $210.49
🔹 Stop: $201.80 (Risk ~4.1%)
🔹 Target 1: $227.50
🔹 Target 2: $238+
🔹 R:R: ~1:3
Setup:
– Tight sideways consolidation near 50MA
– Strong volume support near $205 zone
– Bullish engulfing candle into breakout zone
– Sector strength: Financials stabilizing post RBA cut
– Clean technical base + upside momentum potential
Why It Works:
🔸 High-quality name with macro tailwind (lower rates = banking boost)
🔸 Tight risk with upside if it breaks out above $215
🔸 Good institutional interest & dividend tailwind
🚨 Trigger Alert: Add above $215 for momentum confirmation
🔔 Monitor closely for follow-through above resistance
DISCLAIMER : The content and materials featured are for your information and education only and are not attended to address your particular personal requirements. The information does not constitute financial advice or recommendation and should not be considered as such. Risk Management is Your Shield! Always prioritise risk management. It’s your best defence against losses.
Finer Market Points: ASX Top 10 Momentum Stocks: 26 May 2025 CSE:DTR XETR:FRS ASX:PEK PSX:FML LSE:TMG TSX:NWC ASX:PUA TSX:XAM OSL:WWI GETTEX:YOJ Momentum leading shares are the market's best performers today. They are the fastest-growing shares on the ASX over the last 90 days. These companies can't get to be leaders without first appearing on our Launch Pad list. The Launch Pad List is shared on Thursdays and the video interview published after market close on Fridays. Today's ASX's Top 10 Quarterly Momentum Stocks are: Dateline Resources Limited (DTR) Forrestania Resources Limited (FRS) Peak Rare Earths Limited (PEK) Focus Minerals Limited (FML) Trigg Minerals Limited (TMG) New World Resources Limited (NWC) Peak Minerals Limited (PUA) Xanadu Mines Limited (XAM) West Wits Mining Limited (WWI) Yojee Limited (YOJ)
R
Looking for new ATH for PPC?Interesting chart with a few options. Overall, liking the current 4th time breakout (pending current monthly close), but must be careful as it's a small cap. The range has been developing well since 2009 with price now in a clear uptrend. We're now expecting a SOS to range highs/major 50% level followed by a pullback to continue into phase E. Once we get the pullback there isn't much resistance until the supply structure then near ATHs
*please note the lines are not time analysis just price pathing