Regis Possible 3x in the next 5 yearsG'day,
Thanks for viewing. I was engaging in some speculation today about where potential growth could come from for Regis. I was doing it to compare them against my investment in Westgold; similar on gold ounces produced, market cap, AISC, and cash balance. But Regis doesn't publish a 3 year production outlook and Westgold has. So Westgold puts their 2028 production at 480,000 oz up from a 2026 guidance range of 345 - 385,000 oz (Regis forecast 350 - 380,000 oz).
One major difference is that Westgold has more locations, mines, and processing plants, and has a longer 'inventory' of MRE ounces.
My impression is that Westgold is seeking growth through prioritising higher grades, and mill expansion. Not so much appetite for big deals detected. They, recently spun-out assets when they had the cash balance to run them in-house. More of an 'iterative' growth and focussing strategy. I bought into that one, but felt they were handing the capital gains of the new entity to new shareholders as opposed to retaining that for existing shareholders. Maybe their plate is a bit full currently with all the locations and upgrades planned. Another clue was them mining a new underground using a contract mining company, as opposed to using in-house miners.
So this is pure speculation about the sources of future growth (and I have no connection to insiders if this actually happens). One potential source is a 100% takeover of the Tropicana mine - currently 30% owned. The 70% owner Anglogold has announced in late 2025 that they are exploring a sale, but no details have been released on timeline, terms, or discussions. Anglo sees their future elsewhere (overseas) and views Tropicana (and Sunrise Dam) is a 'tier two' asset(s) for them.
I have seen Greatland Resources do amazing things with Telfer, an asset that was 'end of life' and 'tier two' that they breathed decades of life back into within 18 months (it was acquired with less than one years worth of reserves in Dec 2024 in what might be the deal of the decade.. Do not count these big mines out (Tropicana has produced over 4Moz and Sunrise Dam over 8Moz).
Since Regis is currently a minority partner, you must admit they are a likely, if not the most likely, candidate to take over Tropicana. Who knows the asset any better? Anglo. If we put a tentative purchase price at AUD2B, that could easily be financed by 25% cash (AUD500m - Regis have over 1.1B in the bank), 25% stock, and 50% debt. If the debt interest rate is too steep, or the debt load too large, they could also partially finance by selling a stream of future production. If this deal gets done that would add 300,000 ounces a year (70% annual mine production) in a single deal and give them full control of the 9.5Mtpa processing plant.
Where else might production increases come from? Well, this is a low chance one... they could get McPillamy's back on track (it would take a few years after any potential approval to get mining however). They are currently challenging the previous decision in the courts while looking at a tailings dam redesign / relocation. The open-pit actually isn't affected by the previous decision, just the tailings dam (from my understanding). Look, they are working on it and trying their best. If successful (say within the next 5 - 7 years) that would mean they could add 185,000 - 235,000 ounces per year. McPillamy's currently is valued at $0 so ANY upside would be welcome and not priced into the current market cap. Nobody is backing them to get it up and running, but there is a non-zero chance of them finding a way back to production.
100% Tropicana 450,000oz (speculative)
Duketon 220-240,000oz
McPillamy's 185,000oz (speculative - relatively low chance)
Could mean a 850,000 ounce per annum production rate.
I invested recently because it is relatively undervalued vs peers. All I really know is that they are investing around A70-80m in grade control, step-out, and extensional drilling and will want to grow reserves and production. How, and if, they will be able to do that remain to be seen.
Anyway, that is my up-side case and why I doubled my holding. If the increases are more modest, they are still well placed.  Long
Long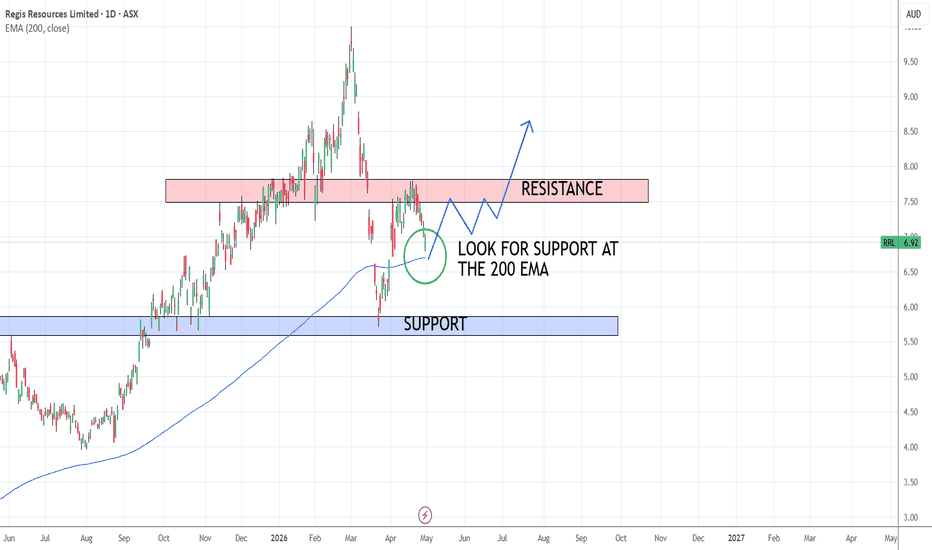
 Long
Long
 Long
Long
 Long
Long
 Long
Long
XRO trend reversal Hi traders,
The Setup: Monthly Support Base
The monthly chart shows that XRO has returned to a massive structural support zone (the red line at $72.11) that dates back to 2019–2020. This "full circle" correction has reset the technicals, allowing for a long-term swing trade toward the 61.8% retracement level.
The Logic: After a 65% drop from the all-time highs, the stock is carving out a monthly bottom. The RSI (14) on your chart is sitting at 33.49, which is near historical "floor" levels for this asset.
The Goal: We are riding the recovery wave from the current oversold levels up to the Golden Pocket ($130.77 – $145.91), where sellers are expected to return.
Execution Parameters
Entry Strategy
The current price of $82.98 is a valid entry point for a long-term position, as it sits just above the primary monthly support. If you are looking for a "perfect" entry, any retest of the $72.00 – $75.00 range provides an even better risk-adjusted opportunity.
Risk Management (Stop Loss)
The protective stop should be placed at $66.50. This is below the recent 52-week low and the structural red line. A monthly close below this level would signal that the macro uptrend has completely failed.
Take Profit Targets
Primary Target (The Golden Pocket): $130.77. This is the 0.5 Fibonacci level and the start of the "Golden Pocket" (between 0.5 and 0.618). Your "checkered flag" on the chart is placed exactly here.
Secondary Target: $145.91. The 0.618 Fibonacci level, which often acts as the final exhaustion point for a corrective rally.
Market Context (April 2026)
Earnings Catalyst: Xero is scheduled to report its FY26 Full Year Results on May 13, 2026. The market is currently pricing in a 22% growth in earnings. A positive surprise here could be the engine that starts the move toward your $130 target.
Valuation Reset: With the P/E ratio having compressed significantly during the 2026 tech sell-off, XRO is no longer just a "growth at any price" play; it’s becoming a "value-growth" hybrid, which attracts institutional buyers at these monthly support levels.
Risk/Reward Summary
Risk: ~$16.48 per share (from an $82.98 entry).
Reward: ~$47.79 per share (to the $130.77 target).
R/R Ratio: 1:2.9
On a monthly timeframe, this is a "patience play." You are looking for a multi-month recovery rather than a quick scalp.  Long
Long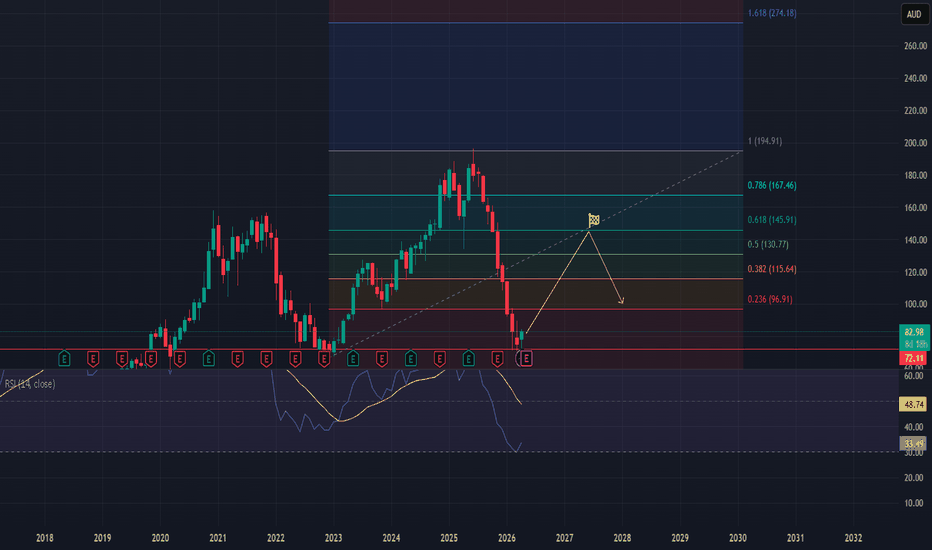
Technology One Limited (ASX:TNE)An Australian enterprise software (SaaS) company, similar to Oracle or SAP, but focused heavily on government, councils, and universities.
- It builds ERP-style software (finance, HR, payroll, asset management, student systems, etc.)
- Delivered via the cloud as Software-as-a-Service (SaaS)
- Customers include local governments, universities, and large institutions
- Founded in Australia, listed on the ASX, and now expanding globally (UK, NZ, etc.)
1. Sticky, recurring revenue
Most revenue is subscription-based (SaaS)
Customers sign multi-year contracts
Switching costs are high (changing ERP systems is painful)
This leads to:
- Predictable revenue
- High retention
- Compounding growth
2. Strong track record of growth
Revenue growing ~18% and profit ~16% recently
Long history of profitability (since 1990s)
Management targets doubling size every ~5 years
That consistency is rare on the ASX.
3. High-margin software business
SaaS scales extremely well
Once built, software is cheap to deliver
Result:
- Strong margins
- Increasing profitability as they grow
4. Niche moat (underappreciated “quiet moat” not flashy, but very durable)
They dominate spec.ific verticals:
- Local councils
- Universities
- Government agencies
These markets are:
- Highly regulated
- Hard to penetrate
- Slow-moving (good for incumbents)
5. Low AI disruption risk (relative)
Unlike generic software companies:
- Their systems are deeply embedded workflows
- Hard to replace with AI tools
Recent commentary suggests they’re actually benefiting from AI integration, not being disrupted
6. International expansion upside
- Strong push into the UK (especially councils)
- Early traction but still small
If successful:
Big upside from scaling outside Australia
Negatives:
1. Expensive valuation, PE ~65x
Market already pricing in strong future growth
Less margin for error
2. Slower “sex appeal” vs global tech
Not like AI chips or consumer apps
More like “boring but reliable” software
3. Growth vs expectations risk
Even strong results can disappoint if:
- SaaS growth slows slightly
- ARR misses expectations
Weekly chart showing a potential for 40% upside return.  Short
Short
 Long
Long
 Short
Short
Why Classic Trend-Following is Failing in the Current Market?The attached chart clearly illustrates the hallmark dynamics of 2026, where periods of low volatility are abruptly succeeded by sharp and often deceptive impulses that MNCTNglobal analysis classifies as a deficit of structural trends. In today's market reality, the classical concept of following a long-term directional move has become increasingly unreliable, as phases of sustained growth or decline have shortened significantly and are more frequently interrupted by sudden, deep corrections. A primary driver of this instability is the widening gap between market expectations and reality, where even robust economic reports can trigger sell-offs if they fail to exceed the highly inflated forecasts of analysts.
To operate effectively in such conditions, traders are forced to prioritize flexibility over rigid algorithms, as strategies that performed perfectly in stable environments instantly lose their edge when price action enters a phase of turbulence. Adapting to the 2026 market implies a substantial reduction in decision-making cycles and a shift toward lower timeframes, which allows for minimized risk while maintaining the ability to capture short-lived impulsive moves. Special attention in the MNCTNglobal analytics is given to execution quality and platform stability, as during moments of peak load and spread widening, technical reliability becomes a more critical survival factor than the trading strategy itself.
The perception of risk has also undergone an evolution, forcing market participants to focus on capital preservation through reduced leverage and the use of wider stop-losses capable of weathering market noise and frequent false breakouts. A modern trader's most valuable asset is information hygiene and the ability to filter out redundant data, focusing exclusively on key liquidity drivers and central bank signals. Ultimately, success in the current landscape is determined not by the ability to predict every turn of the chart, but by the skill to react with discipline to changes, maintaining clarity of thought and relying on a transparent infrastructure that remains stable even during periods of extreme uncertainty.  Long
Long
 Long
Long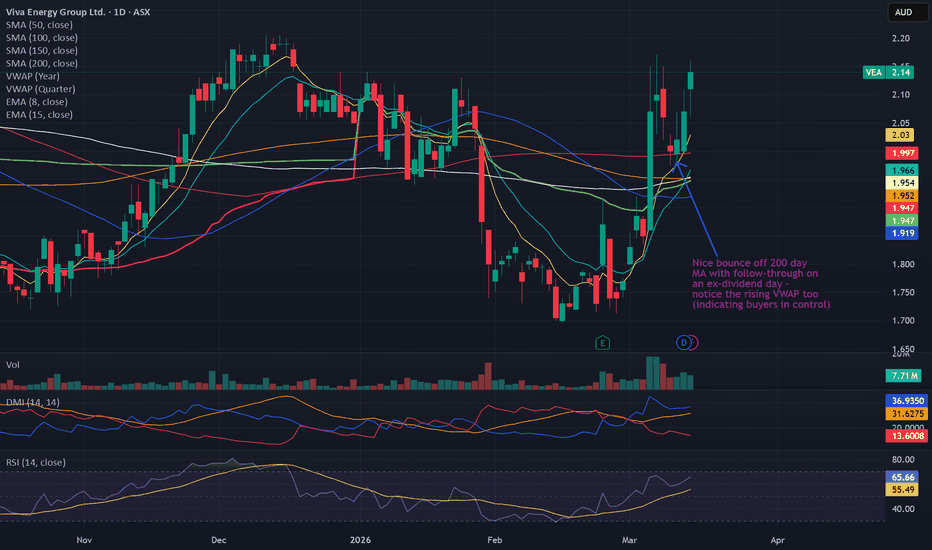
 Long
Long
HOW-TO: Scaling Stage Analysis with SW Stage Analysis ToolkitThe Challenge: The Paradox of Choice
In a trending market, there are hundreds of potential setups. The manual process of checking the 30-week WMA, volume trends, and Mansfield Relative Strength (MRS) for every ticker on the ASX or S&P 500 is inefficient.
The SW Final Dash is designed to solve this by providing a high-level "Status Map" of your watchlist, allowing you to identify Stage 2 breakouts before they appear on the retail radar.
1. Understanding the Dashboard Status
The dashboard condenses complex technical requirements into a visual status. When using the Dash, focus on these three primary data points:
Stage Status: The dash identifies if the ticker is currently in Stage 1 (Base), Stage 2 (Advance), Stage 3 (Top), or Stage 4 (Decline).
The Trend Pillar: It monitors the slope of the 30-week Weighted Moving Average. A "Green" status across multiple timeframes indicates a high-conviction trend.
Relative Strength (MRS) Intensity: Rather than just a line, the dash shows whether the asset is gaining or losing momentum relative to the broader index.
2. How to Use the "Confluence" Filter
The most powerful way to use the Dash is to look for Confluence. A "perfect" Weinstein setup appears on the dashboard when:
Stage Change: The status flips from Stage 1 to Stage 2.
Volume Confirmation: The dash highlights a volume "surge" (relative to the 30-day average).
Positive MRS: The Relative Strength component turns green, indicating the stock is leading the market.
3. The Workflow: From Dash to Entry
Step 1 (Scan): Open your watchlist and look for "Stage 1" symbols that have a "Improving" Relative Strength status. These are your candidates for a breakout.
Step 2 (Alert): Set alerts based on the Dash’s transition logic. You want to be notified the moment a ticker moves into a "Stage 2 Confirmed" status.
Step 3 (Verify): Once the Dash flags a ticker, click the symbol to view the price action. Ensure the breakout is "clean" (above clear horizontal resistance) with the Dash showing all green pillars.
4. Managing the "Weight of Evidence"
The dashboard isn't just for entries; it’s for defense. If you are holding a Stage 2 position and the Dash begins to show "Stage 3" or "WMA Flattening" warnings, it is an objective signal to tighten your trailing stops or begin scaling out.
Best Practices for the Dashboard
Watchlist Sizing: The Dash works best with curated watchlists (e.g., Sector ETFs, ASX 200, or specific thematic lists).
Timeframe Alignment: Always ensure the Dash is pulling data from the Weekly timeframe for true Stage Analysis, even if you are viewing the daily chart for your entry.
The dashboard is a tool to assist in the Weinstein methodology with a few modern upgrades.  Education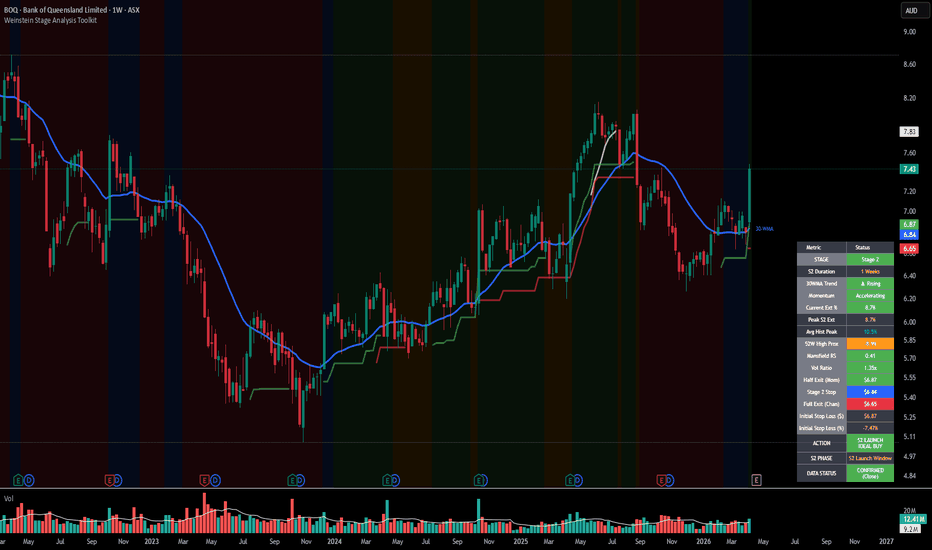
 Long
Long