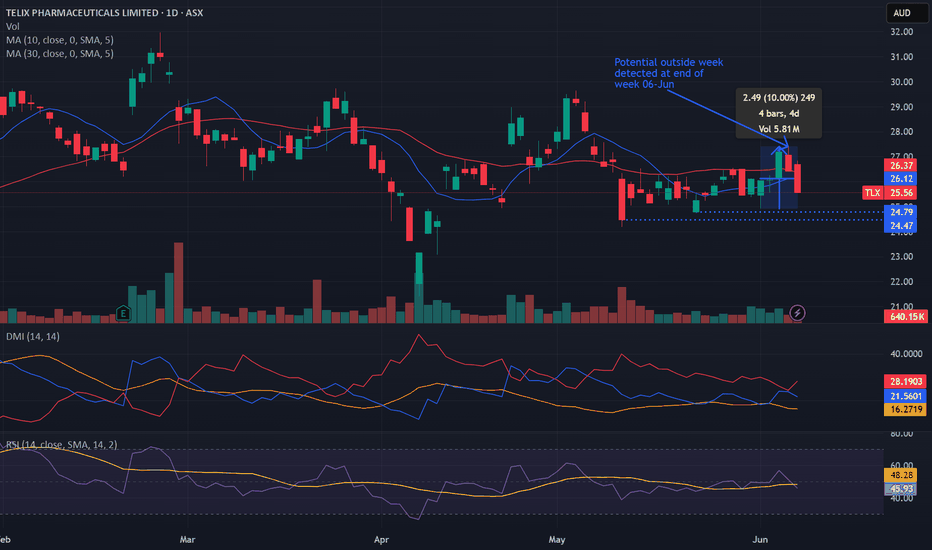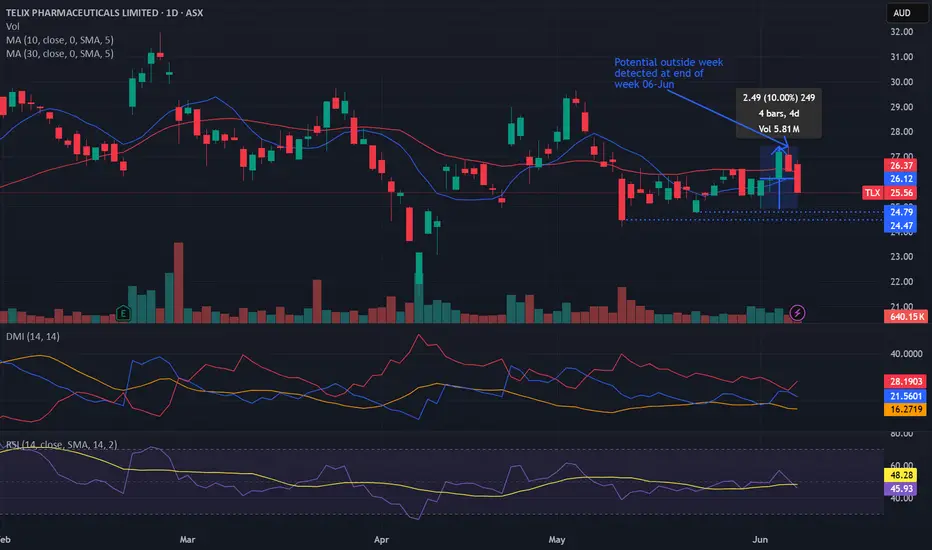
Potential outside week and bearish potential for TLXEntry conditions:
(i) lower share price for ASX:TLX below the level of the potential outside week noted on 2nd June (i.e.: below the level of $24.91).
Stop loss for the trade would be:
(i) above the high of the outside week on 5th June (i.e.: above $27.40), should the trade activate.
Important note for the trade:
- Observe market reaction at two key areas illustrated in the chart above, should the trade activate ($24.79 and $24.47), which could act as support against the short trade.
How to Use TradingView Alerts to Catch Momentum Shifts Here’s a quick video on setting alerts in TradingView.
I use alerts for stocks I’m interested in but want to give more time to set up. Instead of using a basic price alert, I prefer setting alerts on MACD crossovers to signal when momentum is shifting back in my favor. As a rule of thumb, the deeper the crossover, the better the value and potential momentum. Crossovers below the MACD zero line are particularly useful, especially for stocks that had strong momentum and were making new highs before pulling back.
This approach helps confirm that the stock has had time to build a solid base before I enter. TradingView will then send me an email alert or play a chime if I have it open, letting me track multiple stocks and setups without constantly checking charts. It’s also great for monitoring take-profit and stop-loss levels.
You can apply the same strategy with nearly any indicator on TradingView to time your entries and exits with more confidence.
Ramelius Resources (ASX: RMS) –A Tactical Re-Entry Zone?🟡 Gold-Linked Opportunity: Ramelius Resources (ASX: RMS) – A Tactical Re-Entry Zone?
Context: Ramelius Resources, a mid-tier Aussie gold producer, is showing signs of technical exhaustion after a strong rally from its 2024 lows. With gold prices consolidating and RMS pulling back to a key support zone, this could be a tactical opportunity for shareholders and swing traders alike.
📊 Technical Snapshot:
Current Price: $2.47
Trendline Support: The long-term ascending trendline remains intact, offering a potential re-entry zone for bulls.
Risk-Reward Setup: Defined green/red zones highlight a favorable R:R ratio for those targeting a rebound toward $2.80–$3.00.
🪙 Gold Correlation Insight:
The inset chart shows gold (XAU/USD) stabilizing after a volatile June. If gold resumes its uptrend, RMS could follow suit, given its strong correlation with bullion prices.
🧠 Psychological Angle:
After a 40%+ rally from the $1.78 low, some profit-taking is natural. But this pullback may shake out weak hands before a continuation move.
Watch for sentiment shifts around gold and broader risk appetite—these could be catalysts for RMS’s next leg.
#RMS #Gold #ASX #MJTrading #Forex #Trading #Investment
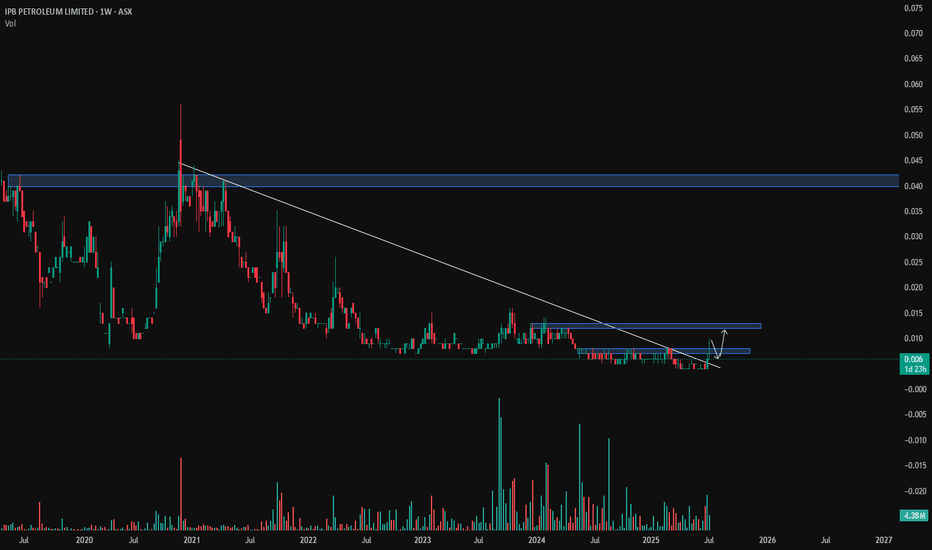
IPB - volume breakout LONGBroken out of 2 year trend on volume now looking to backtest area.
Awaiting news
I
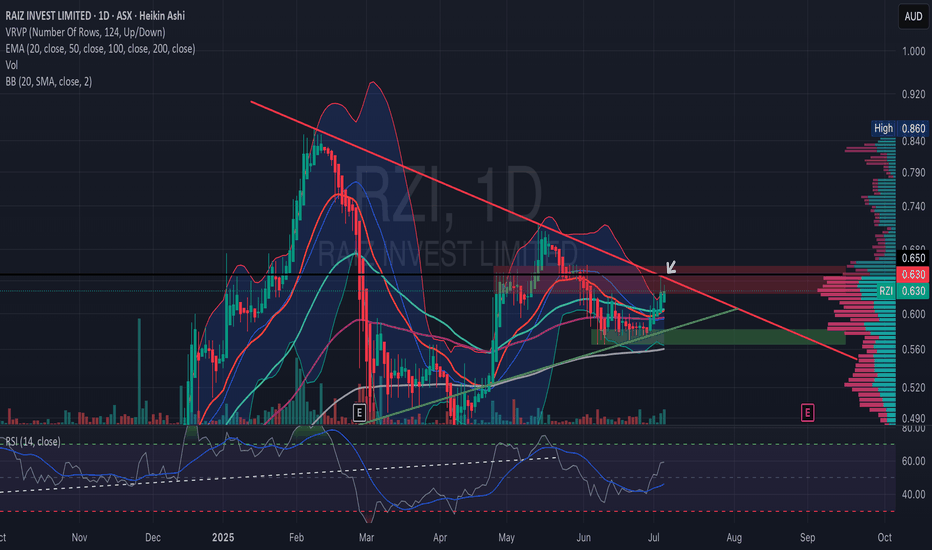
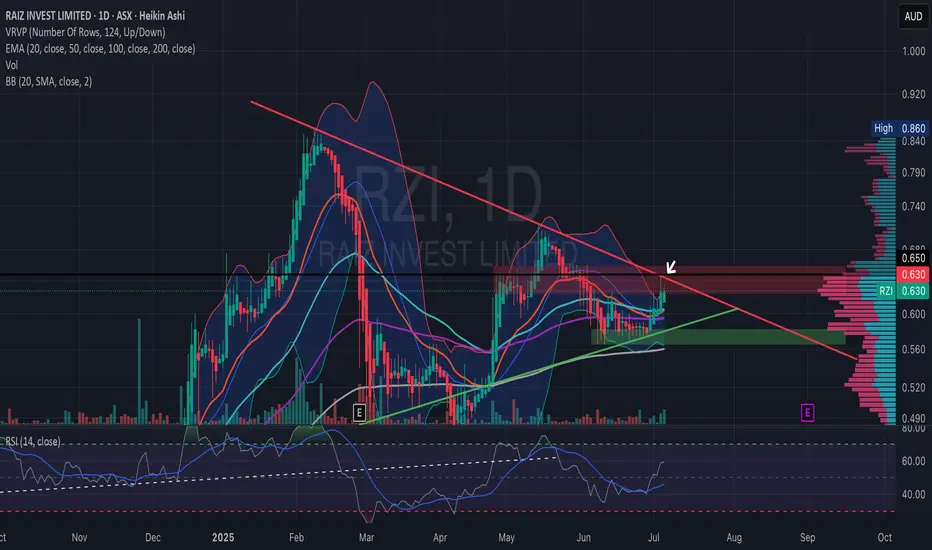
RZI Bullish BreakoutThe price is currently testing resistance around 0.63, after rising from 0.575. The volume profile indicates high activity around 0.58-0.62, showing strong interest.
The EMAs reflect a bullish shift, with the 20 EMA approaching a crossover above the 50 EMA.
After a period of squeeze inside the triangle, the bands are beginning to open.
The RSI is neutral to bullish, trending upward around 50. Overall, the chart suggests a potential breakout. No clear over-bought yet, there is room to run if bulls stay in control.
Key Scenarios
Bullish Breakout: A daily close above the red trendline + A$0.63–0.65 resistance zone would confirm.
First target: A$0.70–0.72 (next volume-profile “valley” and previous swing highs)
Secondary: A$0.80+ (upper Bollinger band confluence from the Feb top)
False Break / Rejection:
Look for a swift pullback into the green ascending line (~A$0.60) or the broader support box around A$0.57–0.58.
Watch EMAs for signs of rolling over (20 EMA crossing back below 50 EMA would turn neutral-to-bearish).
Potential outside week and bullish potential for PRNEntry conditions:
(i) higher share price for ASX:PRN above the level of the potential outside week noted on 2nd May (i.e.: above the level of $1.38).
Stop loss for the trade would be:
(i) below the low of the outside week on 28th April (i.e.: below $1.29), should the trade activate.
Trade Idea: WES.ASX – VCP Breakout Play (Buy Setup)🔹 Entry:
✅ Bought @ $85.45
📍 VCP-style setup with tight consolidation above 21EMA/50MA
📈 Early signs of breakout with volume confirmation
🔹 Stop Loss:
🚨 Initial Stop @ $81.56 (Below supertrend support)
⚖️ Risk defined at ~4.6% from entry
🔹 Target Zones:
🎯 T1: $89.30 (1R)
🎯 T2: $91.80–92.50 (2R zone & prior resistance extension)
🔹 Technical Notes:
• Strong uptrend intact
• Supertrend, 21EMA, and 50MA all stacked bullish
• Recent consolidation near highs = strength
• Clean structure with volume dry-up prior to breakout
• RSI holding above 50, MACD positive crossover
🔹 Trade Management Plan:
• Take partial profits at +1R (~$89.30)
• Move stop to breakeven after 1R achieved
• Trail remainder using short-term moving average or price structure
🧠 Context:
WES shows strong leadership within ASX discretionary retail. This breakout could signal the next leg higher if volume expands and price holds above $85.60–86.00.
🔔 Watching for breakout continuation above $86.50 with strength.
DISCLAIMER : The content and materials featured are for your information and education only and are not attended to address your particular personal requirements. The information does not constitute financial advice or recommendation and should not be considered as such. Risk Management is Your Shield! Always prioritise risk management. It’s your best defence against losses.
Vys longPotential long buying opportunity on Vys. Fourth push up looking to breakout of the wedge consolidation pattern, short term Ema all converging and volume starting to increase into what should hopefully be a strong 2h earnings report. There has been strong buying from its recent low of 0.34c qll the way up to 0.48c and holding at 0.45c. RSI sitting at around 50 has it sitting currently neutral if it starts to pick up hopefully that will confirm the breakout. Buying at 0.45c with a stop loss at 0.42c with a target of 0.52c offers a 3:1 risk reward.
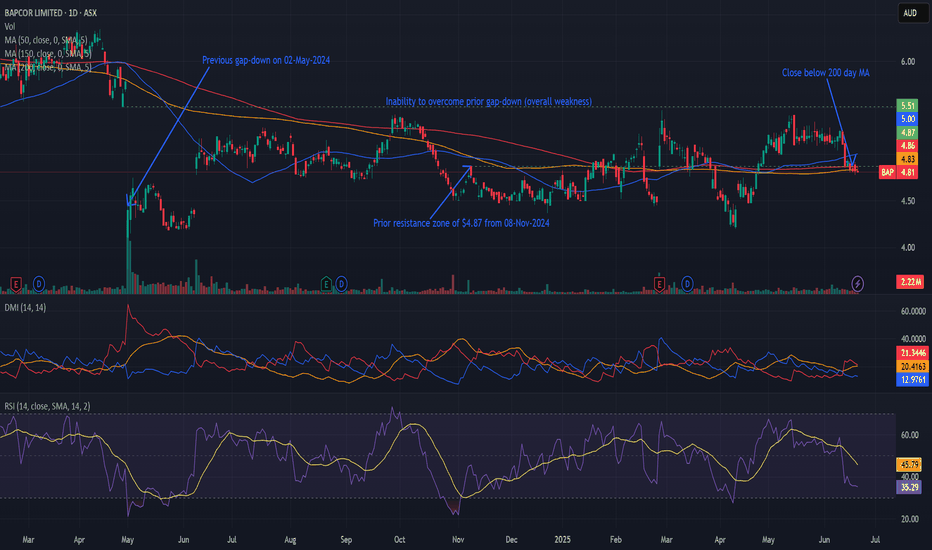
Bearish potential detected for BAPEntry conditions:
(i) lower share price for ASX:BAP along with swing of DMI indicator towards bearishness and RSI downwards, and
(ii) observing market reaction around the share price of $4.82 (close of 18th June).
Stop loss for the trade would be:
(i) above the high of the recent swing high once the trade is activated (currently $4.92 from the high of 19th June), or
(ii) above the prior resistance zone of $4.87 from 8th November 2024, depending on risk tolerance.
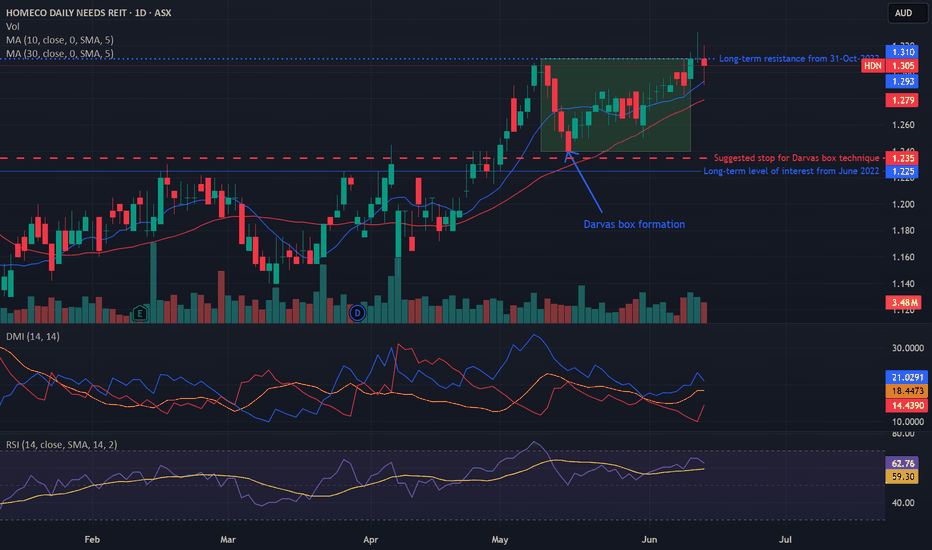
Bullish potential detected for HDNEntry conditions:
(i) breach of the upper confines of the Darvas box formation for ASX:HDN
- i.e.: above high of $1.31 of 9th May (most conservative entry), and
(ii) swing up of indicators such as DMI/RSI along with a test of prior level of resistance of $1.31 from 31st October 2022.
Stop loss for the trade (based upon the Darvas box formation) would be:
(i) below the support level from the low of 15th May (i.e.: below $1.24).
APX Rebound in Play?📈 “APX Rebound in Play? Eyeing the AUD 1.55 Resistance”
Appen (APX) has shown a significant uptick today, closing at AUD 1.040 (+5.58%) with a sharp volume spike (8.96M shares) that could suggest accumulation. After a long downtrend, price appears to be consolidating above key support near AUD 1.00, forming a potential base for reversal.
🔍 Chart Highlights:
Support Zone: AUD 1.000 – strong historical level holding.
Resistance Targets: → AUD 1.555 → AUD 1.655 → AUD 1.785
R/R Setup: Defined green zone shows potential upside if momentum continues; red zone clearly marks invalidation below support.
🧠 Thesis: If APX maintains momentum and holds above AUD 1.00, we may be witnessing a structural shift with upside potential toward AUD 1.78 in stages. Breakout traders might watch for confirmation via volume and price action at each resistance.
💬 “Could we be looking at an early-stage reversal or just a dead-cat bounce? Watching the 1.00 level closely.”
#ASX #APX #APPEN #MJTRADING #TRADING #SHARE #STOCKMARKET #BUY #CHART #MONEYMANAGEMENT
Conservative 630% upside for Horizon MineralsHello and thanks for viewing.
I tend to write a lot. My valuation is based on a few assumptions;
- There are no new material ore discoveries as extraction progresses,
- The gold price doesn't rise over time,
- The miner will have the 'average' profitability of gold miners of 11% (I use 10%),
- The miner will be fairly but not excessively valued vs its earnings. I used a PE ratio of 20, which is pretty normal.
Reserves are over 1.8 million ounces x AUD4539/oz = AUD8.17B / 25 year mine life = AUD326m a year. At 10% EBIT this is AUD 32.6m in earnings per year. If valued at a PE ratio of 20, this would give the mine a value of 653.6m. The current Market Cap is AUD103m (up 53% in the past month) so a 6.3x of the current price is $0.456.
I have already bought in and am up 46% in a week :) so WHEN we hit $0.45 that is a 9.5x gain for me. I might sell 50% then, not sure, depends on how much positive news accumulates up until that point.
Just sharing my method. I feel it is easy to apply, is sufficiently conservative, not too naive. Oh, I don't trade short-term. I have found that short-term trading only makes money for brokers and dramatically increases risk. I find a share that I am comfortable offers a large margin of safety, if the price goes down after I buy in, I am happy, especially if I can add to my position.
HLong