 LongLong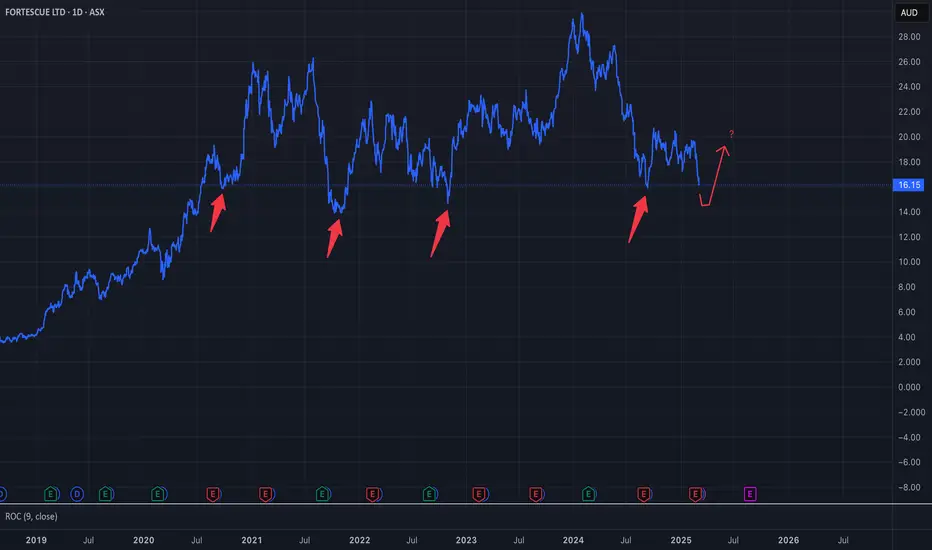
Is the ZIP DIP OVER? Is it a suitable time to Buy?Is the Base solid enough to drive the price to 3 OR will it require a manipulation below the base to test key support "2"?
THIS IS ONLY AN IDEA AND COULD BE RIGHT...
For the Fundamental lovers:
Also keep in mind:
Dow Jones Newswires:
"Zip Price Target Raised 5.9% to A$3.60/Share by Ord Minnett"
 Long
Long
Potential outside week and bullish potential for OCCEntry conditions:
(i) higher share price for ASX:OCC above the level of the potential outside week noted on 23rd January (i.e.: above the level of $1.635).
Stop loss for the trade would be:
(i) below the low of the outside week on 20th January (i.e.: below $1.27), should the trade activate.
 Long
Long
Bullish potential detected for QUBEntry conditions:
(i) breach of the upper confines of the Darvas box formation for ASX:QUB
- i.e.: above high of $4.04 of 28th November (most conservative entry), or
(ii) swing up of indicators such as DMI/RSI along with a test of prior level of $4.00 from 25th November.
Stop loss for the trade (based upon the Darvas box formation) would be:
(i) below the support level from the low of 13th December (i.e.: below $3.80).
QLong

Potential outside week and bullish potential for OPTEntry conditions:
(i) higher share price for ASX:OPT above the level of the potential outside week noted on 17th January (i.e.: above the level of $0.85).
Stop loss for the trade would be:
(i) below the low of the outside week on 13th/16th January (i.e.: below $0.725), should the trade activate.
CLong

Potential outside week and bullish potential for AMIEntry conditions:
(i) higher share price for ASX:AMI above the level of the potential outside week noted on 30th/31st January (i.e.: above the level of $0.20).
Stop loss for the trade would be:
(i) below the low of the outside week on 29th January (i.e.: below $0.17), should the trade activate.
 Long
Long
FFM Targeting 1.5??Hi dear trading lovers and FFM buyers...
PLEASE NOTE THAT THIS IS ONLY AN ANALYSIS AND COULD BE WRONG...
Chart and lines are explaining my idea...
SEEMS FFM is in a uptrend targeting 1.5 and finally 1.7...
Also note that:
"Macquarie has initiated coverage of FireFly Metals with an Outperform rating and set a price target of A$1.50"
 Long
Long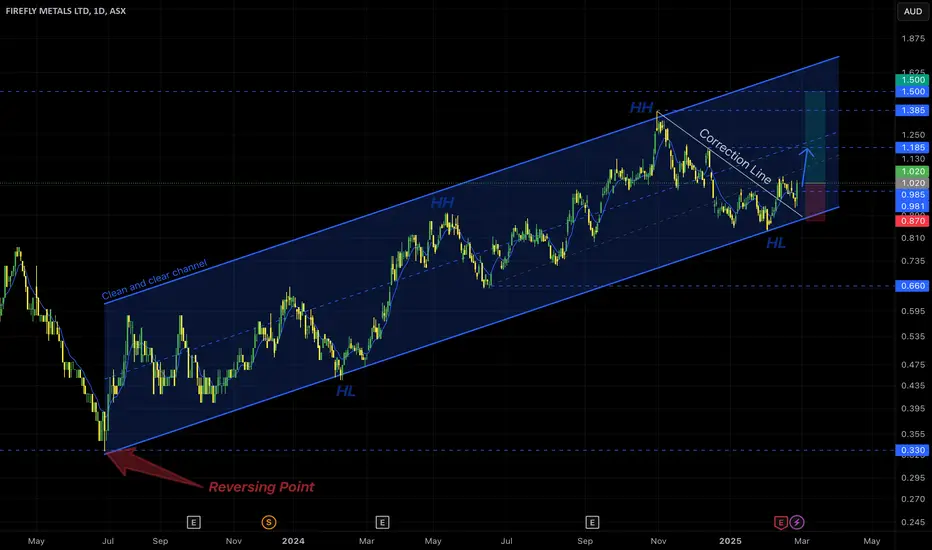
Do you think IGO has come to the end of its downtrend?BUYERS still looking for a possible TRADING RANGE or a REVERSE Point...
After a Spike and a clean Channel, getting close to 4 (Root of breakout of previous Major Move, and also 3rd hit to Monthly uptrend, makes this point a remarkable and hopeful point for all the buyers... In addition to these we can say that last days sharp fall can be an Exhaustion gap of downtrend and also a magnet to monthly uptrend....
#IGO #ASX #Analysis #Trend #Channel #Spike #Trading
 Long
Long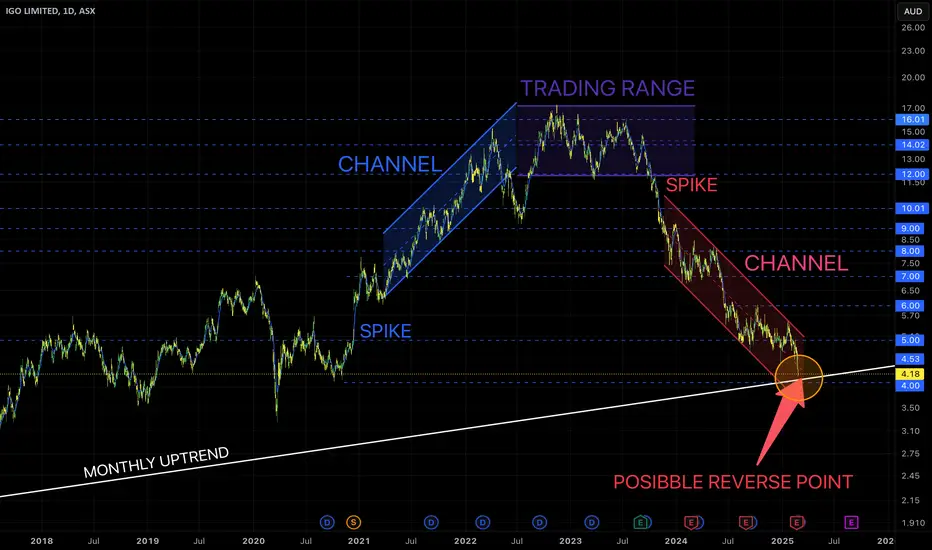
Finer Market Points: ASX Top 10 Momentum Stocks: 25 Feb 2025 EURONEXT:DHG MIL:CLE LSE:CLA NYSE:NAN LSE:MYX ASX:MP1 ASX:AQD MIL:ARN NYSE:ALC MIL:WLD Momentum leading shares are the market's best performers today. They are the fastest-growing shares on the ASX over the last 90 days. These companies can't get to be leaders without first appearing on our Launch Pad list. The Launch Pad List is shared on Thursdays and the video interview published after market close on Fridays. Today's ASX's Top 10 Quarterly Momentum Stocks are: Domain Holdings Australia Limited (DHG) Cyclone Metals Limited (CLE) Celsius Resources Limited (CLA) Nanosonics Limited (NAN) Mayne Pharma Group Limited (MYX) Megaport Limited (MP1) AusQuest Limited (AQD) Aldoro Resources Limited (ARN) Alcidion Group Limited (ALC) Wellard Limited (WLD)


QAN is now ShortQAN is now net-short on the regression break.
There are many options in the market this morning, and I am not sure this is the best.
 Short
Short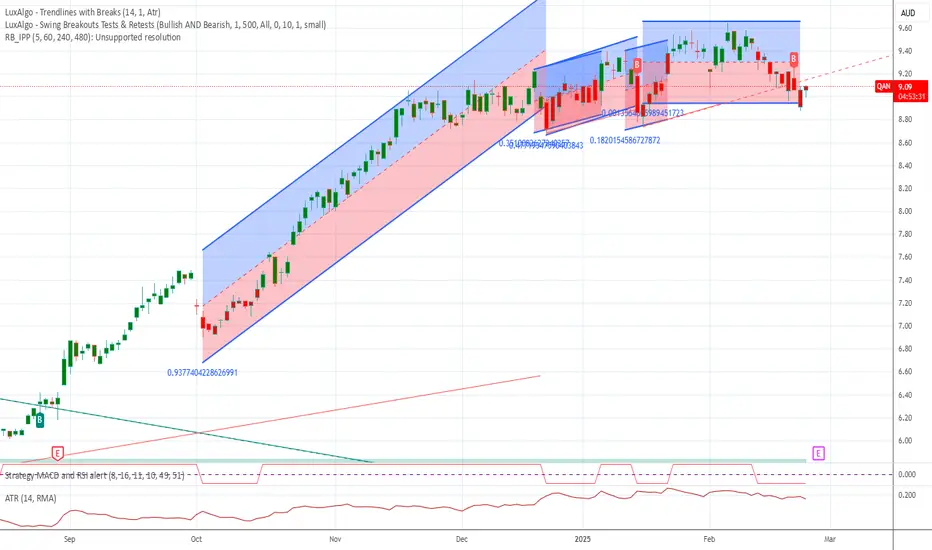
Is CHN ready for the second leg??After breakout from the important resistance (1.25) with a sharp movement with high volumes, and completing it's pullback now it's ready for second leg with an eye to 2 ...
 Long
Long
Short Commonwealth Bank of Australia at 156.25 Target 132Hello Followers
Id like to take another shot at shorting CBA here due to the interesting risk reward setup.
I had failed trying to short this once in the 130's and have been patient waiting for another setup.
Fundamental Reasons:
-Potential rolling over of the Australian housing market.
-Extremely high valuation
Technical reasons:
-False Breakout above the 162 level that got heavily sold
- So far the retracement bounce has hit the 1st Fib level at 156ish, bringing about a great risk reward setup.
Stop 160.2.
Target 132.00
Risk/Reward 6:1 !
Thanks!
Kavi
 Short
Short
 Short
Short
Decreasing volume is an indication of loss of upward momentum, eVolume is decreasing indicating a reversal down to support / demand zone at 4.92
Short
Bullish potential detected for AIZEntry conditions:
(i) higher share price for ASX:AIZ along with swing up of indicators such as DMI/RSI.
Stop loss for the trade would be:
(i) below the support level from the open of 29th November (i.e.: below $0.51), or
(ii) below the support level from the open of 7th November (i.e.: below $0.49), depending on risk tolerance.
 Long
Long
Potential outside week and bullish potential for HLIEntry conditions:
(i) higher share price for ASX:HLI above the level of the potential outside week noted on 17th January (i.e.: above the level of $4.65).
Stop loss for the trade would be:
(i) below the low of the outside week on 13th January (i.e.: below $4.44), should the trade activate.
 Long
Long
Breakout pullback buy Pullback to recent breakout point, results next week. Could potentially bounce here and continue the strong uptrend.
 Long
Long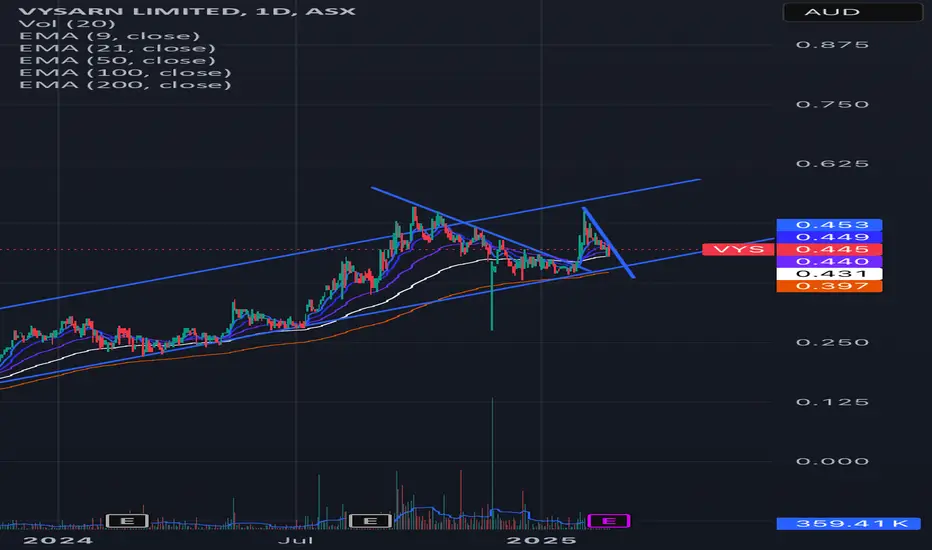
ALC Turn around playALC Potential turnaround play, Looks to have set a base and now to have broken out on a 10 year contract announcement. Second time it’s been above the 50day ema and now the 100 day ema, Lots of buying volume recently. Resistance at 0.130 and 0.170
Speculative buy at the market or wait for a pullback to the breakout point.
 Long
Long
PTM Platinum Asset Mgmt (ASX) Monthly 2Monthly chart has clear 5 wave move into longer term bullish fibonacci cluster level
This stock has taken a battering over the last few years and recently there is a monthly spinning top outside of the bollinger bands and a gap on the weekly at $1.05, so there is at least 25-30c to close this...
I'm looking at the longer term bullish bias, so wont be trading this as a short to medium term trade...
Full disclosure... I already have a position in this stock within the last month or so
PLong

PTM Platinum Asset Mgmt (ASX) Monthly Long term butterfly pattern on the Monthly
Hit long term fibonacci cluster,
I've already bought this as a long term position
PLong

COL - 4 months CUP & HANDLE══════════════════════════════
Since 2014, my markets approach is to spot
trading opportunities based solely on the
development of
CLASSICAL CHART PATTERNS
🤝Let’s learn and grow together 🤝
══════════════════════════════
Hello Traders ✌
After a careful consideration I came to the conclusion that:
- it is crucial to be quick in alerting you with all the opportunities I spot and often I don't post a good pattern because I don't have the opportunity to write down a proper didactical comment;
- since my parameters to identify a Classical Pattern and its scenario are very well defined, many of my comments were and would be redundant;
- the information that I think is important is very simple and can easily be understood just by looking at charts;
For these reasons and hoping to give you a better help, I decided to write comments only when something very specific or interesting shows up, otherwise all the information is shown on the chart.
Thank you all for your support
🔎🔎🔎 ALWAYS REMEMBER
"A pattern IS NOT a Pattern until the breakout is completed. Before that moment it is just a bunch of colorful candlesticks on a chart of your watchlist"
═════════════════════════════
⚠ DISCLAIMER ⚠
Breakout Area, Target, Levels, each line drawn on this chart and any other content represent just The Art Of Charting’s personal opinion and it is posted purely for educational purposes. Therefore it must not be taken as a direct or indirect investing recommendations or advices. Entry Point, Initial Stop Loss and Targets depend on your personal and unique Trading Plan Tactics and Money Management rules, Any action taken upon these information is at your own risk.
═════════════════════════════
 Long
Long
Pantoro - near-term swing trade exitSame valuation method as used on Horizon Minerals (previous post today). Shows Pantoro to be undervalued, with 80% up-side remaining at current prices and reserves.
Who, knows. We will see. My entry shown in blue dashed line and exit point in red.
 Long
Long
Bearish potential detected for IREEntry conditions:
(i) lower share price for ASX:IRE along with swing up of the DMI indicators and swing down of the RSI indicator, and
(ii) observation of market reaction at the support level at $9.03.
Stop loss for the trade would be:
(i) above the resistance level from the open of 9th September (i.e.: above $9.36), or
(ii) above the resistance level from the open of 21st August (i.e.: above $9.65), depending on risk tolerance.
 Short
Short