ASX:STO - 15 AUG, 2025 ELLIOTT WAVE ANALSYSISConclusion: Wave 3))purple continues to move higher.
Key Points: We are in an Extended Wave, specifically the 1)blue of wave 3))purple, which will basically continue to move higher, aiming for the nearest level at 11.32 or higher at 15.00.
In the short term, wave 1)blue may complete, and then wave 2)blue will pull back lower, giving us better trade setups.
So just watch this stock until wave 1)2)blue completes, and price pushes higher above the Confirmation Point (Wave B of wave 2)Blue) at which point the bullish trend could move much higher.
©By Hua Chi Cuong (Shane), CEWA-M
ASX:SGP - 15 AUG, 2025 ELLIOTT WAVE ANALSYSISConclusion: Wave iii))green continues to move higher.
Key Points: We are in an Extended Wave, specifically iii))green of 3-red of 3)blue. But fundamentally, it is likely to move to the nearest level at 6.06, or even higher.
While price must remain above 4.72 to keep this bullish view valid.
©By Hua Chi Cuong (Shane), CEWA-M
ASX:SEK - 15 AUG, 2025 ELLIOTT WAVE ANALSYSISConclusion: Wave B))purple is moving higher.
Key Points: Wave II-green may not be finished, but is moving up with wave B)), then down with C)). However, the important thing is that the price will probably move up around 26.77 - 28.63. I will then look further into the outlook.
On the other hand, if the price moves up to 28.63 quickly and strongly, it may indicate that wave III-green is probably moving up, and wave II-green may have ended earlier than expected.
But the overall result is a continued move up to 26.77 - 28.63.
©By Hua Chi Cuong (Shane), CEWA-M
ASX:MVF - 15 AUG, 2025 ELLIOTT WAVE ANALSYSISConclusion: Wave 3))purple is moving higher.
Key Points: Since 0.535 wave 3)) is moving higher, targeting the nearest target at 1.525. And wave 1-red may end then, and wave 2-red will unfold to move a little lower. Finally, wave 3-red may move higher, completing its role.
While price must remain above 0.535 to keep this Bullish view valid.
©By Hua Chi Cuong (Shane), CEWA-M
ASX:S32 - 15 AUG,2025 ELLIOTT WAVE ANALYSISConclusion: Wave count is reconstructed to maximize the forecast probability. Wave 3))-purple can move up, but needs to move higher to confirm.
Key Points: Wave 2))purple ended at 2.47, and then wave 3))purple is moving higher, if this is true, this stock could be headed to 8.00 - 10.00. But price action needs to move higher above 3.78 to confirm and maximize the weight and confidence for this view.
While price must remain above 2.47 to keep this Bullish view valid.
©By Hua Chi Cuong (Shane), CEWA-M
ASX LIMITED: 15 AUG, 2025 ELLIOTT WAVE ANALYSISConclusion: Bearish pressure is increasing, wave C)-blue is likely pushing lower.
Key Points: Wave C)-blue is moving lower, targeting 48.12. While price must remain below 73.88 to remain bearish.
On the other hand, when price action moves above 73.88, it is directly suggesting that wave 3)-purple is moving much higher at that point.
©By Hua Chi Cuong (Shane), CEWA-M (Certified Elliott Wave Analyst - Master Level).
Nanocap Precision: FOS Poised for Price Discovery?FOS Technical Outlook: Momentum Meets Structure
FOS is showing strong bullish structure, currently trading above previous all-time highs (ATHs). The April retest of the macro 50% level was textbook: a deep wick into support followed by a hammer close, signaling aggressive absorption and buyer intent.
Price is now attempting to form a higher 2-bar swing low, which—if confirmed by a clean break of the ATH—would reinforce the uptrend and validate continuation.
Long Setup: Two Tactical Entry Zones
Aggressive Entry: Stop-loss just below the Equilibrium Zone (EQ) of the April wick. This offers tighter risk but demands precision.
Conservative Entry: Stop-loss below the April swing low, allowing more breathing room and accounting for potential volatility.
Further confidence on trade will hinge on price breaking into ATH
Risk Advisory: Nanocap Terrain
FOS remains a nanocap, meaning liquidity is thin and volatility is amplified. Use extreme caution, size appropriately, and avoid overexposure. This is a precision strike, not a full-scale invasion.
Buy CBA at 160BA is approaching a long-term horizontal support level at $160, which has acted as a strong floor multiple times in the past.
Technical View:
Support Zone: $160–$161 (historical demand zone since mid-2023).
Trend Context: Price has been in a sideways range between $160 and $175, consolidating after a strong rally earlier this year.
Indicators:
RSI currently in the mid-40s, suggesting neutral momentum but leaning toward oversold on shorter timeframes.
Volume picking up slightly near support, hinting at accumulation.
Candle Patterns: Watch for bullish reversal candles (hammer, bullish engulfing) around $160 to confirm buyer strength.
Trade Idea:
Bullish Scenario: If price holds $160 with strong bullish candle confirmation, potential bounce back to $168–$172.
Bearish Scenario: A decisive close below $160 could open the door to $154–$150 in the short term.
Risk Management:
For a long position: Stop loss just below $158 to protect against a false breakout.
For a short position: Wait for a confirmed break and retest of $160 as resistance.
ASX:QBE - 13 AUG, 2025 - ELLIOTT WAVE ANALYSISConclusion: Wave 2))-purple is moving lower.
Key Points: Wave 1))-purple ended at the high of 24.20, wave 2))-purple is unfolding towards 17.38 - 17.50. So there is no convincing evidence of a developing Bullish trend, instead it shows a downward move of the market.
On the other hand, I would only reconsider the bullish market view if the market moves above 24.20 quickly enough, strongly enough.
©By Hua Chi Cuong (Shane), CEWA-M | Certififed Elliott Wave Analyst - Master Level
ASX:REA - 13 AUG, 2025 - ELLIOTT WAVE ANALYSISConclusion: Wave 4)-blue needs more time to complete, then wave 5)-blue can move higher.
Key points: Wave 4))-purple has finished at 62.05 and wave 5))-purple is moving higher. It is subdividing into wave 1)blue to wave 4)blue. Basically wave 4)blue is not completed, because there is not enough convincing evidence, it will probably last longer and develop as a Triangle. After we have more price action, we will know what it is trying to say, for now just wait.
Invalidation point: 180.67 (Wave 4 does not overlap wave 1).
©By Hua Chi Cuong (Shane), CEWA-M | Certififed Elliott Wave Analyst - Master Level
ASX:QAN - 13 AUG, 2025 - ELLIOTT WAVE ANALYSISConclusion: Wave 5)-blue could move higher.
Key Points: Wave 4))-purple ended at 7.55 and wave 5))-purple has been moving higher since then. It is subdividing into wave 1)-blue to wave 5)-blue. Now wave 5)-blue is extended and subdividing into wave 1-red to wave 3-red.
Basically its wave 3-red will move higher, targeting targets around 11.90 - 12.68.
While price must remain above 10.63 to keep this Bullish view valid.
ASX:PLS - 13 AUG, 2025 - ELLIOTT WAVE ANALYSISConclusion: Short-term, wave 2-red is moving lower.
Key points: Wave 2)-blue has ended at 1.070 and wave 3)-blue is moving much higher. It is subdividing into wave 1-red, which has just completed. Wave 2-red is now probably unfolding to push lower, targeting a low around 1.710.
So short-term, this stock is moving lower. Medium-term, it has a lot more to go.
©By Hua Chi Cuong (Shane), CEWA-M | Certififed Elliott Wave Analyst - Master Level
ASX:ILU - 13 AUG, 2025 - ELLIOTT WAVE ANALYSISConclusion: Wave III-green could be moving higher.
Key takeaways: Wave II-green ended as a Double Zigzag at 3.14. Wave III-green then moved higher, targeting the nearest target at 12.83. While price must remain above 3.14 to keep this bullish view valid.
©By Hua Chi Cuong (Shane), CEWA-M | Certififed Elliott Wave Analyst - Master Level
Break out?The chart shows James Hardie Industries (ASX: JHX) breaking out of a symmetrical triangle pattern after a period of consolidation.
Breakout confirmation: Price has moved above the upper trendline with increasing momentum, signalling potential bullish continuation.
Fibonacci targets: Initial resistance levels are at 46.19 (Fib 0.618), 47.38 (Fib 0.5), and 48.56 (Fib 0.382). The major resistance sits near 50.02 before the prior high at 52.39.
Upside potential: If the breakout holds, the measured move from the triangle suggests a climb towards the mid–high 40s in the short term, with a possible retest of the all-time high in the coming months.
Risk level: A drop back below ~42.95 would invalidate the breakout and risk a move towards the 36.16 Fib extension support.
EOS retesting all time high or retrace?Safe move would be to take profits on this one up 10x from its low.
That volume profile has definitely changed though indicating institutional investment and with the room to run on MACD holding to retest all time high has its merit.
Watch me bag hold this forever
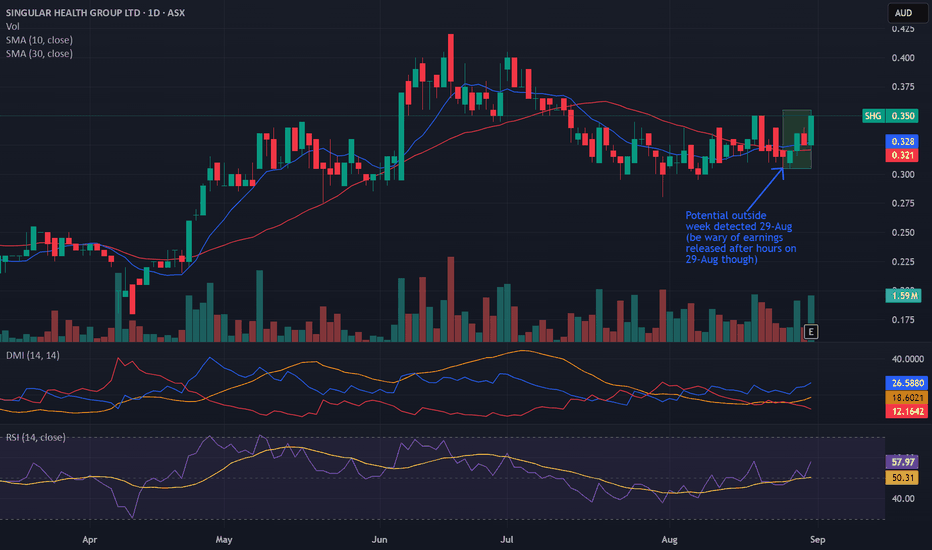
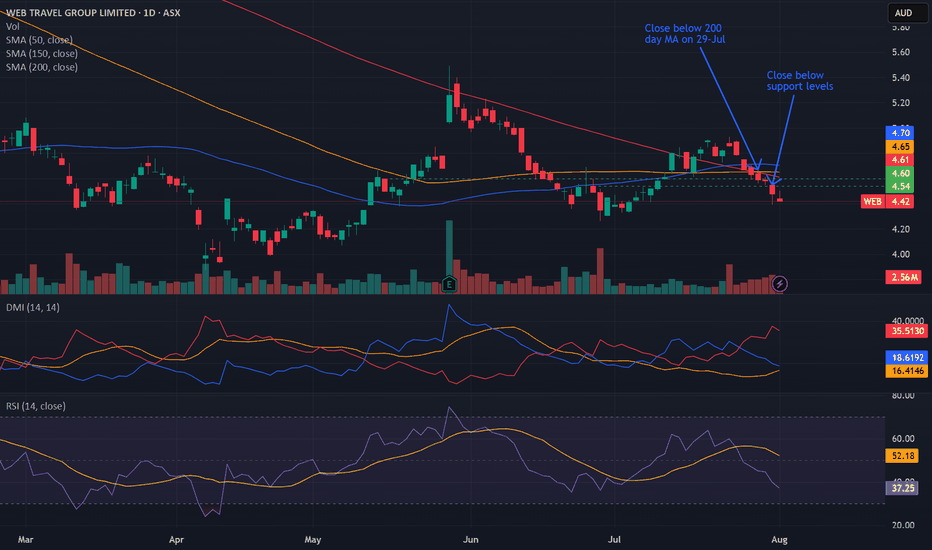
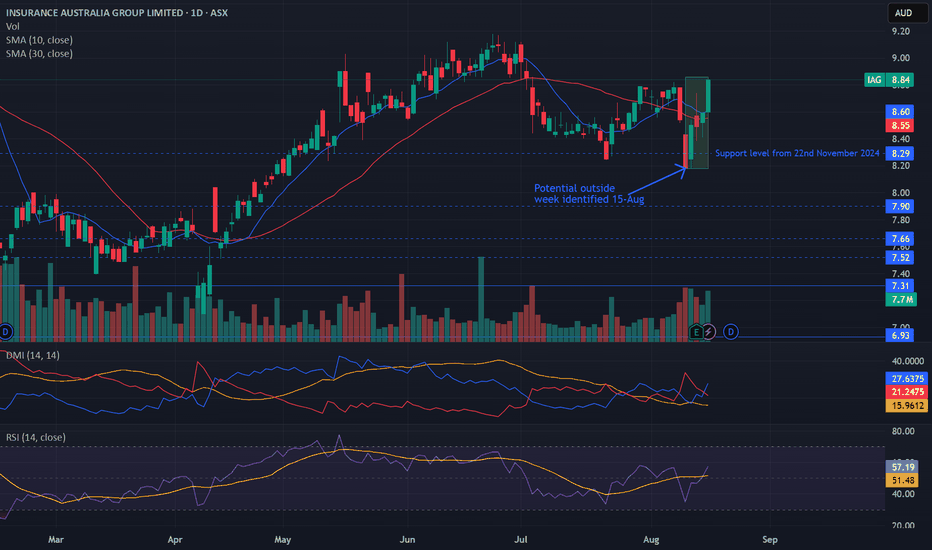
Bearish potential detected for SUNEntry conditions:
(i) lower share price for ASX:SUN along with swing of DMI indicator towards bearishness and RSI downwards, and
(ii) observing market reaction around the share price of $20.46 (open of 19th May).
Stop loss for the trade would be:
(i) above the potential prior resistance of $21.36 from the open of 5th June, or
(i) above the high of the recent swing high once the trade is activated (currently $22.14 from the high of 1st July), depending on risk tolerance.
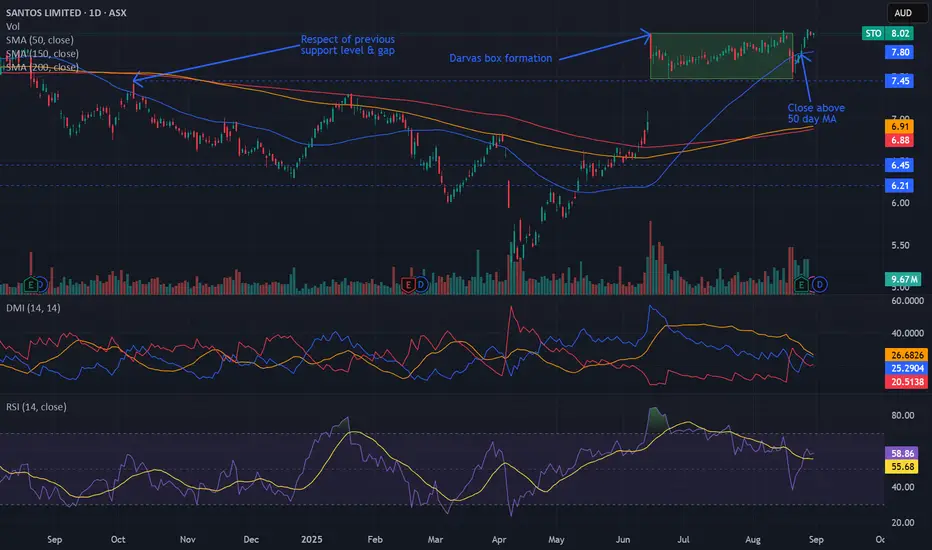
Bearish potential detected for AGLEntry conditions:
(i) breach of the lower confines of the Darvas box formation for ASX:AGL
- i.e.: below low of $9.84 of 7th April, and
(ii) swing increased bearishness of indicators such as DMI/RSI along with a test of prior level of support of $10.02 from 11th March.
Stop loss for the trade (based upon the Darvas box formation) would be:
(i) above the high of 10th April (i.e.: above $10.89), or
(ii) above the prior support level from the open of 10th January (i.e.: above $11.15), depending on risk tolerance.
Bullish potential detected for ORGEntry conditions:
(i) breach of the upper confines of the Darvas box formation for ASX:ORG
- i.e.: above high of $11.69 of 16th June (most conservative entry), and
(ii) swing up of indicators such as DMI/RSI.
Stop loss for the trade (based upon the Darvas box formation) would be:
(i) below the support level from the low of 26th June (i.e.: below $10.62).
DAILY TRADER’S PLANNER🌅 MORNING PREP
⏰ 6:00 a.m. – 6:45 a.m. | Ground the Mind
Light movement / stretching / walk
20–25 min mindfulness meditation
5 min breath journaling:
My emotional tone this morning
Any lingering bias, fear, or excitement from yesterday?
What does a calm, rule-following day look like?
🧠 Anchor Phrase:
“I will execute my edge with clarity, not with hope.”
🧠 MARKET PREP
🕕 6:45 a.m. – 7:30 a.m. | Systems First
Review open trades: still valid per system?
Check watchlist: any potential setups for today?
Pre-calculate entry, stop, and position size for each
If in drawdown: confirm size adjustment without changing rules
📚 PRE-MARKET NOURISHING TIME
🕖 7:30 a.m. – 8:30 a.m. | Detach Before the Storm
No charts, no news, no Twitter
Read non-market material (Zen, philosophy, biography)
Eat a light, mindful breakfast.
2-minute breath anchor before charts
📊 FINAL SCAN & ORDER PREP
🕣 8:30 a.m. – 9:15 a.m.
Check for overnight/pre-market price shifts.
Finalise trade orders: entries, stops, position sizes
Place limit/stop orders or set alerts
Mentally commit to no improvising.
🔔 NYSE OPEN – CONTROLLED EXECUTION
🕤 9:30 a.m. – 10:00 a.m. | First 30 Minutes
Monitor for order fills or open adjustments per rules
Avoid impulsive trades — wait for planned triggers
Log trades immediately if filled
⏳ MID-SESSION CHECKS
🕛 12:00 p.m. | Halfway Through
Scan for stops hit / targets reached
Adjust only per system rules
Breathing reset before clicking anything
📉 MARKET CLOSE REVIEW
🕓 4:00 p.m. – 4:15 p.m.
End-of-day close review for signals
Record trades and update journal (R-multiples, emotional state)
Note any pending setups for tomorrow
🛑 POST-MARKET DECOMPRESSION
After 4:15 p.m. – until next morning
All trading screens off by 6:00 p.m.
Movement or nature time
Dinner without market talk or news
Fiction reading or creative time
Gratitude journaling
🌀 WEEKLY REVIEW (Saturday Morning)
R-multiples gained/lost
Did I follow the system in all trades?
Any emotional overrides?
Any refinements needed for execution or prep?
ASM -Australian Strategic MaterialsPromising.
Now word to say yet but very promising.
This is the key and solution to get away from China and balance the supply of Lithium and Rare Earth Materials.
ASM have signed production with Korea.
Korea has a significant influence in production of Samsung phone and EV cars around the world.
all we need is first production and BOOM
BRN - brainchipBRN have been a problem child for many traders and investors after it surge on price its now down to ground. Don't get your hope disappear yet as things about to change and happen very rapidly.
Wit the development of AI. Akida is BRN flagship which may contribute to enhance security by using this on their defense in Drones.
This is also important in ensuring low cost energy as its using efficient energy.
Things will change just hang on there and everything will become bullish.