Long
Long
Washington SOL Pullingback into Key AOI Washington SOL shaping up nicely. After the initial breakout from the range, price is pulling back into a key Area of Interest. So far, the retrace is coming in on declining volume with tight, overlapping candles classic signs of demand stepping in. No confirmation yet on a local trend shift, and of course, a surge in supply could flip the script. But for now, we take it step by step.
Trade Scenario
Starting to layer in here makes sense. Price is sitting right on top of the prior range, which also aligns with a minor Low Volume Node acting as support.
The second zone (marked on the chart) is more significant: it lines up with the yearly pivot, the EQ of the monthly demand wick, and a key 50% level. If that zone gives way, we’re likely looking at a deeper reaccumulation phase.
Stop Loss
Clean invalidation is a break and close below 31.69.
If we print a higher weekly swing low, we can tighten stops to that level.
Take Profit
First target is just below the ATH, quick and clean.
Trail the rest using weekly higher swing lows to stay in sync with structure.  Long
Long
 Long
Long
 Long
Long
 Short
Short
WOR — Looks Like Price Finally Hit a Solid FloorWOR — Looks Like Price Finally Hit a Solid Floor
Worley Limited (ASX: WOR) is not some tiny speculative stock. It is one of Australia’s major global engineering and project-delivery companies, operating across energy, chemicals, resources and critical infrastructure.
The company works across the full life of major projects — from consulting and engineering through procurement, construction, operations and decommissioning — with more than 40,000 employees across over 40 countries and annual revenue above $12 billion.
Fundamentally, there is still a substantial business underneath this battered share price. FY2026 continued to deliver growth in revenue, EBITA and cash flow, while Worley reported a $13.8 billion revenue backlog, 93.6% normalized cash conversion and ongoing capital returns through share buybacks. Around 69% of aggregated revenue was classified as sustainability-related, giving the company exposure not only to traditional energy and resources, but also the enormous investment cycle occurring around energy transition, infrastructure resilience and resource security.
I spent yesterday cleaning a granite floor, so maybe I’ve got floors on the brain. 😂 But looking at Worley, price may finally be testing one that matters.
After a long structural decline, WOR has arrived at a major higher-timeframe support area around the current base. The damage above is still there, so I’m not calling an instant bull market — but this is the first area where the risk/reward for a meaningful recovery starts to get interesting.
Granite floor below. Plenty of ceiling repairs still required above. 😎
The big battleground to me is: $9.50–$10.00
The first job for price is simply to prove that this floor can hold. If it does, I’m watching for a recovery through the first resistance area around $10.80–$11.20 , followed by the more important battleground around $12.20–$12.70.
That second zone matters because it would represent more than just a bounce. A successful reclaim there would begin to damage the larger sequence of lower highs and open the road toward roughly $14–$15.
Beyond that, the higher-timeframe map begins to allow for a much larger recovery toward the $17–$18 region, but that is not the first trade and it is not the first assumption. Price has several ceilings to repair before that becomes the main road.
On the downside, the current base around $9.40–$9.70 is the area I do not want to see fail. If price loses that floor on the higher timeframes, the recovery thesis weakens substantially and the lower structure around the high-$8 region comes back into play.
So the current map is not simply:
“WOR is cheap, therefore it must go up.”
It is:
A large global engineering business has been heavily repriced, and price is now sitting at a major structural floor while the higher-timeframe route is beginning to show the possibility of a recovery campaign.
The floor is there.
Now WOR has to prove it can stand on it. 😎 - so put the whole thing in?? of what i just posted
---Cay7mon
About this map:
This forecast map isn’t trying to predict the exact dollar. I’m mapping the probable direction and route so there’s a game plan ahead of time. As price changes, the map adapts to the evidence.
Check the updates for any changes to the route.
 Long
Long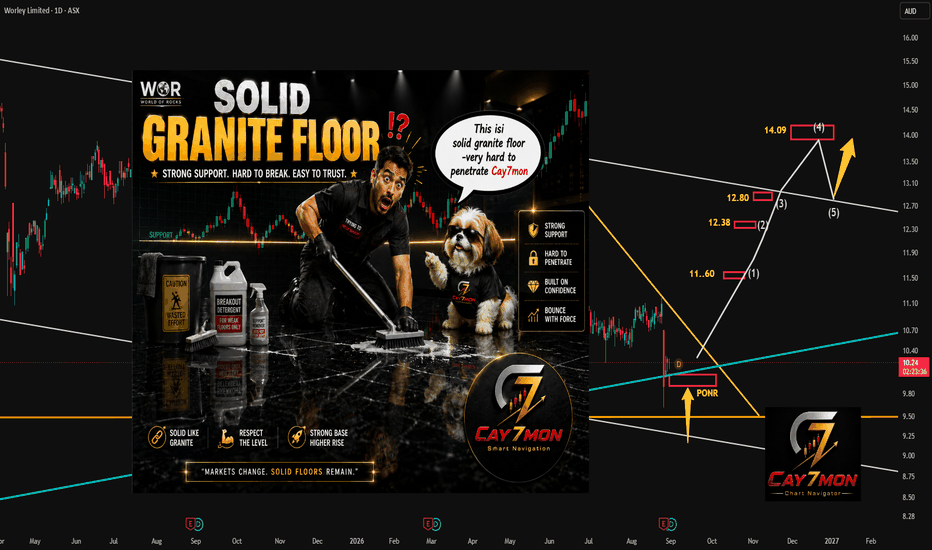
 Short
Short
 Long
Long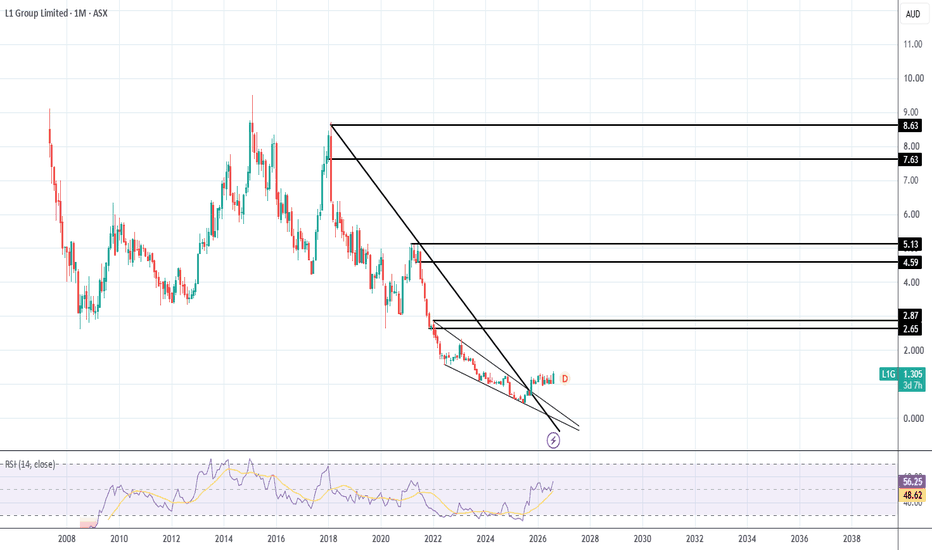
 Short
Short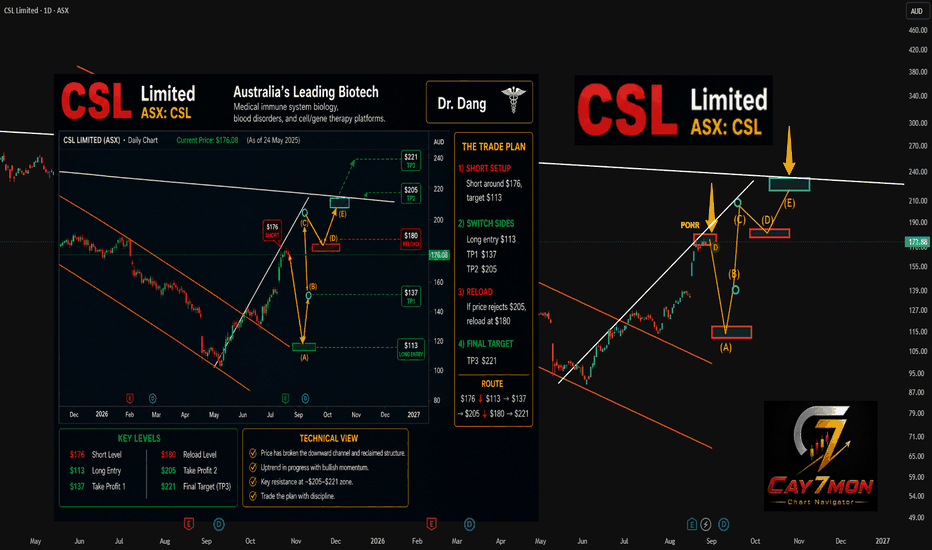
Low-power AI chip pureplay cycles up as hyperscalers teeterINTRODUCTION:
The hyperscaler approach to what passes for "AI" is unsustainable. They promised too much, they spent too much, and they keep borrowing too much. Now that the numbers are laughably astronomical, sooner or later, someone's gonna blink and the looking-for-a-way-out is gonna start, sector-wide. That's when the music stops.
The above being said, "AI" is here to stay, but in the opinion of the author of this idea, it will end up commodified, like the internet. Huge piles of hardware won't matter as far a revenues go, similarly to how giant spools of fiber optics didn't matter after the dot.com crash. Lets dispense with the bull of AGI. Tiny but still useful LLMs will be ran locally on purpose-built, ultra-low-power chips that can be installed into a smartphone or a fridge. The magic will be in what people with limited means can do with the tech, not those who have a billion dollars to burn on tokens from the hyperscaler-adjacent labs like OpenAI, Anthropic, xAI, and Meta.
This is where BraniChip comes in. Ultra-low-power neuromorphic chips that exclusively run small, purpose-built LLMs and their derivatives. They even have their own software environment, similar to how Nvidia has CUDA (if I'm not mistaken about how that works).
None of the above would matter, however, if it weren't for the chart.
THE TA:
Based on the above 2W which offers the most reliable signals and cleanest structures, I'm listing the following bullish observations:
1. The whole thing is cyclical. The chart begins with a structural high and a structural low, and then new structural higher highs and higher lows print at the end of multi-year uptrends and downtrends.
2. New multi-year uptrends begin once price action levels-out in or on horizontal regions of past support/resistance. This is happening right now.
3. Price action has retraced from the last structural higher high down to the 0.382 Fib level, where it is now consolidating (or is already done consolidating).
4. RSI and MFI are both out of resistance, with the latter already in uptrend, an uptrend which is also printing local higher highs as the price action printed local lower lows — a bullish divergence.
5. The Divergence Consensus tool from without_worries, now prints a pending (not yet confirmed) strong bullish divergence across 15+ separate indicators in the exact same place divergences of similar strength had printed before the previous two multi-year uptrends.
6. The full bull flag extension from the previous cycle takes price action to the $9AUD area, which is pretty much where one would expect the next structural higher high to print in the entire structural uptrend.
7. The 2M chart below has a fresh DOJI. There was a DOJI in pretty much the same area on the cusp of the previous cycle-up.
FINAL NOTES:
A perfect entry would be at $0.1-0.11, as indicated by the bottom of the horizontal legacy support/resistance channel in which price action is currently moving. There is no guarantee, however, that price action will still visit the bottom of that horizontal, despite the fact it had wicked down to the bottom of the previous one, before the previous cycle-up. Case in point — once a divergence signal printed from the Divergence Consensus tool, in both previous instances price action did not continue to the downside, only upside.
Exposure to this company is also available on the American OTC markets, though chart history is limited there.
***
The above was written by hand.
The above is not investment advice.
I'm not a professional analyst or trader.  Long
Long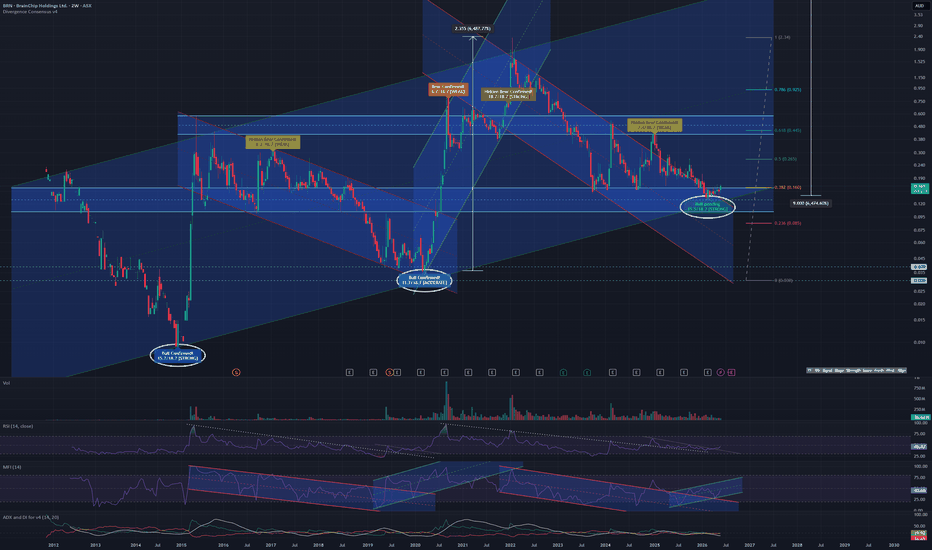
 Long
Long
 Long
Long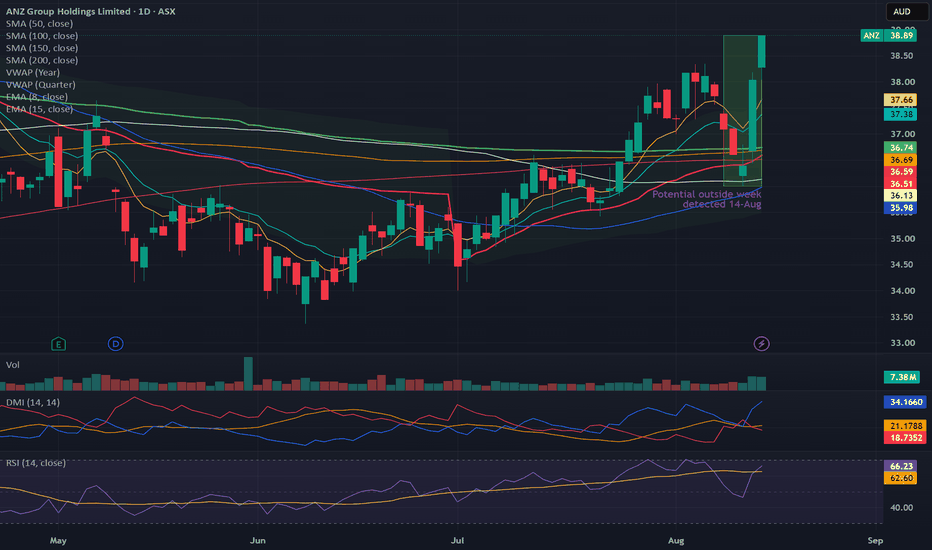
 Long
Long
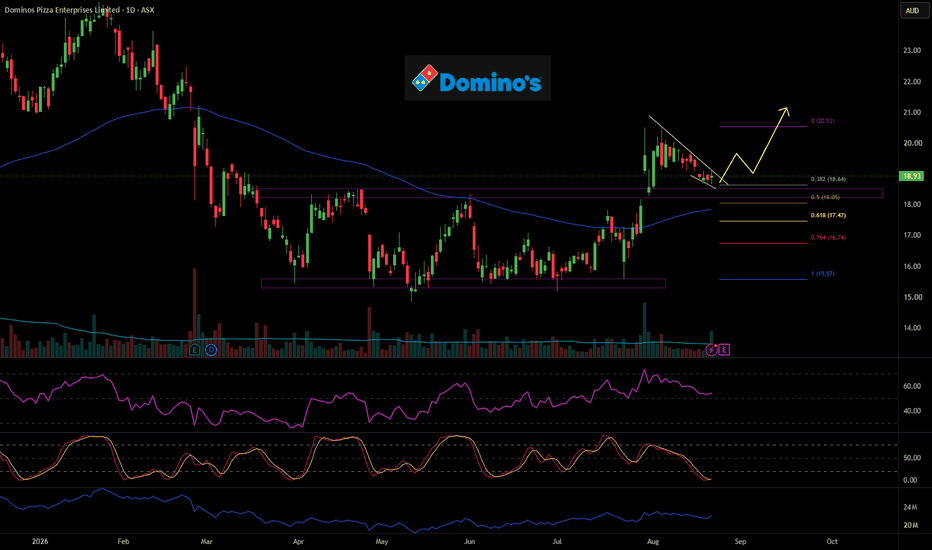
Anyone Like Pizza? DMP Setting Up for a Potential ReversalDMP is starting to look interesting across multiple timeframes. On the 1H chart, price has compressed into a descending wedge while forming a clear bullish RSI divergence, suggesting selling momentum is beginning to fade.
The daily chart adds some nice confluence. Price recently broke out of its broader range and is now pulling back toward the breakout area, creating the potential for old sellers to become buyers. The 0.382–0.50 Fibonacci retracement zone around $18.65–$18.07 is the area I’m watching for support and a possible higher low.
Momentum has also reset nicely, with the stochastic back near the lower end of its range, while OBV remains relatively strong, which is encouraging during the pullback.
For me, the key now is confirmation. If DMP can hold this support area, form a higher low and break the short-term descending structure, the setup becomes much more attractive. Initial upside would be a retest of the recent high around $20.50, with a successful break opening the door for a larger continuation move.
The main near-term risk is earnings on 26 August, which could obviously invalidate the technical setup very quickly.
Watching for: support → higher low → wedge break → continuation. 🍕📈
Goodluck and happy trading🍀  Long
Long