Theta Gold Mines: Nordic Bond at 14-15% with Strong CollateralTheta Gold Mines ASX:TGM is an Australian-listed gold exploration and development company with its primary assets located in South Africa’s historically prolific gold mining region. The company is preparing to issue a four-year Nordic senior secured bond with an expected size of approximately $90 million. Proceeds will be used to restart the brownfield Transvaal Gold Mining Estate (TGME) project near the historic mining town of Pilgrim’s Rest in Mpumalanga province. Commercial production is targeted for 2028, with projected all-in sustaining costs of around $1,200 per ounce - well below the industry average.
Project Economics and Financial Outlook
According to the company’s financial model , once in full production the project is expected to generate significant free cash flow. In 2029, Theta Gold anticipates free cash flow of approximately $150 million. The low-cost profile, combined with confirmed reserves and existing infrastructure, positions the project to remain viable even at substantially lower gold prices than current spot levels.
Bond Structure and Terms
The bonds will be issued at the holding company level as senior secured debt. The offering features a fixed quarterly coupon, expected in the region of 15%. The structure includes scheduled amortization of $7.5 million per quarter after the first two years, with the remaining principal due at maturity in 2030. Call options allow early redemption with make-whole protection in the first two years, followed by step-down premiums thereafter. A put option at 101% is available upon change of control or delisting. The documentation also includes an equity claw-back feature permitting the issuer to redeem up to 35% of the principal within six months of a successful IPO.
Security and Credit Protection
The bonds benefit from strong structural protections. Guarantees are provided by all material group companies, including the South African operating entity. Security consists of pledges over the shares of each guarantor and a first-ranking claim on all subordinated and intercompany debt. The loan-to-value ratio is extremely conservative at approximately 10%, indicating that the debt is significantly over-collateralized. Financial covenants include a minimum liquidity requirement of 10% of outstanding principal and, after the first 30 months, a net debt to EBITDA test capped at 2.0x.
Investment Considerations
The combination of low production costs, a clear path to substantial free cash flow, and robust security features makes the offering attractive at the indicated yield range of 14-15%. The market appears to be pricing in a highly conservative scenario, while the underlying project economics and collateral package suggest a materially stronger credit profile. For investors comfortable with the South African jurisdiction and gold price exposure, the bond provides a compelling risk-adjusted return in the Nordic high-yield segment.
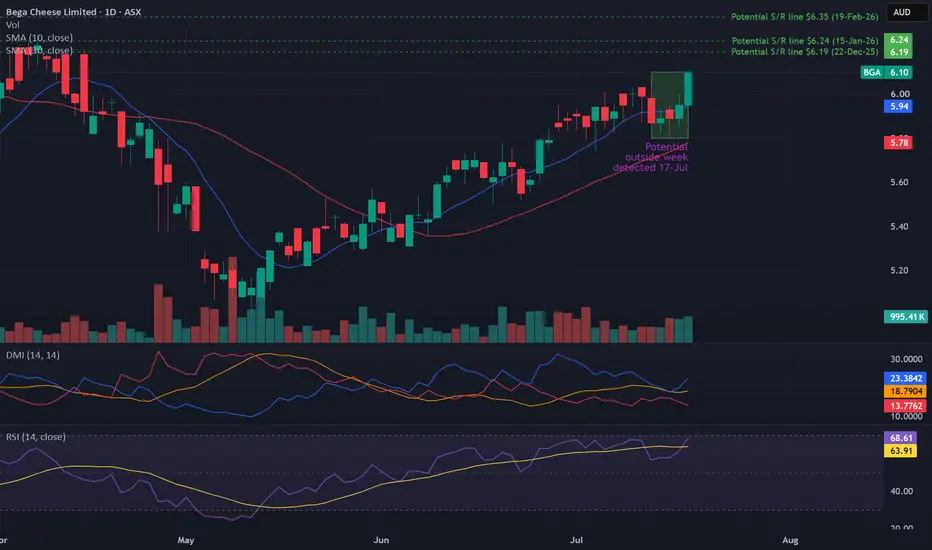
Potential outside week and bullish potential for MINEntry conditions:
(i) higher share price for ASX:MIN above the level of the potential outside week noted on 30th April (i.e.: above the level of $67.80).
Stop loss for the trade would be:
(i) below the low of the outside week on 27th April (i.e.: below $57.70), should the trade activate.
Phase E incomming?AFG is shaping up with a structure that demands attention. Since August 25, price has retraced a clean 25% into the first key area of interest, with subsequent support zones clearly defined on the chart.
The ideal scenario is for price to hold above the purple box. Should it pierce that zone, any entry would need to be backed by a compelling signal for example, a bullish doji or hammer candle accompanied by a spike in volume. For now, price remains well above that level, so the focus is on taking it step by step.
For those employing a DCA approach, risk management is paramount. The invalidation level is set at the LPS low, which serves as the hard stop. This choice reflects the nature of small caps: price can wick through key zones and trigger stops, so anchoring risk to the LPS provides a more robust safeguard.
Once a clear monthly higher swing low is established, the stop can be adjusted and trailed beneath each new monthly swing low. The initial target sits just below the local August high. If price achieves a clean breakout above those highs, stops can be trailed further to capture the bulk of the move.
WBT: Semiconductor IP Story Tightening Beneath Breakout ZoneWBT continues to look more like an emerging semiconductor IP platform than a speculative ASX tech stock.
The long-term structure remains constructive, but what stands out now is the tightening price action directly beneath the key $5 pivot zone:
higher lows forming
rising mini-channel intact
moving averages stabilising
buyers consistently defending the $4.20–4.30 support region
The market appears to be reassessing Weebit’s positioning as commercial milestones continue building around ReRAM memory technology, AI edge computing and semiconductor IP licensing.
Key levels now:
🟢 $4.20–4.30 = major support
🟡 $5.00 = pivot / momentum trigger
🟣 $5.50–6.00 = major supply zone
A clean hold above $5 with expanding volume could open the path toward a retest of the larger supply region where the real institutional battle begins.
Still speculative. Still early commercialisation.
But technically and thematically, the structure continues improving.
Watching closely.
Bearish potential detected for CIAEntry conditions:
(i) lower share price for ASX:CIA along with swing of DMI indicator towards bearishness and RSI downwards, and
(ii) observing market reaction around the potential support area of $4.92 from the open of 7th October 2025.
Depending on risk tolerance, the stop loss for the trade would be:
(i) above the quarterly VWAP (currently $5.17), which corresponds well with the potential resistance from the open of 19th February (i.e.: $5.18), or
(ii) above the yearly VWAP (currently $5.39), which corresponds well with the open following the gap down on 13th February (open of $5.44).
Potential outside week and bullish potential for KAREntry conditions:
(i) higher share price for ASX:KAR above the level of the potential outside week noted on 24th April (i.e.: above the level of $2.26).
Stop loss for the trade would be:
(i) below the low of the outside week on 21st April (i.e.: below $1.975), should the trade activate.
Spring Retest or Terminal Shakeout LoadingKKO is starting to look interesting again.
After trending down consistently since December 2020, the June 2025 low printed what appears to be a low‑volume Spring. Price rallied cleanly into the range highs before supply stepped in, and we’ve since pulled back toward the Spring.
Ideally, this pullback would’ve shown declining volume and a quick rejection from the lows. Instead, volume has lifted — but importantly, we’re not seeing wide candle spreads or aggressive selling, which you would expect if this were true distribution. That keeps the re‑accumulation scenario alive.
There’s also a realistic chance of a terminal shakeout. For that to confirm, we’d need a sharp push down followed by a fast reclaim back into the range. This aligns with the current structure: price has been moving sideways between the yearly Pivot and S1, and the first test of S1 (Feb 2026) produced a clean rejection.
With the current S1 sitting just below the range lows and inside the May 2020 COVID wick FVG, the setup is ideal for a quick liquidity flush before markup.
Trade Scenarios
Aggressive Entry
Enter now since price hasn’t broken the Spring.
Stop‑loss: just below the Spring low.
If the terminal shakeout plays out, you can always re‑enter with better R.
Targets: clearly marked on the chart.
If this is true re‑accumulation, the minimum range target is ~$0.28 — but price has a lot of work to do. One step at a time.
Conservative Entry
Wait for the terminal shakeout and a monthly close back inside the range.
Stop‑loss: below the wick of the shakeout.
Risk Note
This is a speculative setup with multiple moving parts. Manage risk carefully — nothing is guaranteed.
FLT – Testing Key SupportASX:FLT – Key Support Test
ASX:FLT is sitting on a key support around 10.00–10.20 after a strong downtrend.
This level has held before, so buyers may step in again.
Momentum is still weak, but selling pressure is slowing.
If support holds, a short-term bounce is possible.
If it breaks, the downtrend can continue.
Business is still growing, especially in corporate travel.
Recent disruptions are short term — people are still travelling, just changing plans, not cancelling.
Costs are under control, AI is improving efficiency, and the balance sheet remains strong.
Short-term noise. Demand still there.
Controlled Pullback + Spring Structure EmergingALX continues to hold up well. Price has been pulling back in a controlled, overlapping manner since June 2022, with declining volume throughout the entire correction. That behaviour typically reflects a lack of aggressive supply, not distribution.
April 2026 printed a clean sweep of the lows with a strong close and strong volume classic signs of buyers stepping in.
The only caution flag: the Spring of the local red range shows higher volume than the Selling Climax, which in Wyckoff terms suggests we should expect a Test to confirm demand before any sustained markup.
On the larger orange range, April’s candle also looks like a terminal shakeout, potentially clearing the final weak hands before a broader trend transition.
Trade Scenario
Aggressive entry: Enter now with a stop under the April low.
Conservative entry: Wait for a Test of the red range Spring to confirm demand before committing.
Both approaches are valid depending on risk tolerance.
Targets
Respect the range highs as the first major objective.
Trail stops using weekly swing lows if price transitions into markup, price can move quickly through the range.
ARU - same play different tickerARU - same play different ticker
rotating from your actual producers (lyc) to these smaller, mostly funded, and pretty much inevitable up and coming producers (there is only a handful of them in the world) might be the play here..
Gina bout to get a whole lot richer *ughhh
LYC UPDATELYC
locked in those 200% gains yet? you should have. and then now is the time to risk some of that again, with tight invalidation.
most prob blue momentum right now. lynas could be losing money (they are not) and the chart would still look like this for fundamental supply restraint reasons.
good bet yeh?
lets try again
Potential outside week and bullish potential for DNLEntry conditions:
(i) higher share price for ASX:DNL above the level of the potential outside week noted on 1st May (i.e.: above the level of $3.35).
Stop loss for the trade would be:
(i) below the low of the outside week on 29th April (i.e.: below $3.16), should the trade activate.
Bullish potential detected for ALLEntry conditions:
(i) higher share price for ASX:ALL along with swing up of indicators such as DMI/RSI.
Depending on risk tolerance, the stop loss for the trade would be:
(i) below the recent swing low of $46.45 (14th April), or
(ii) below previous potential support on the daily chart at $45.13 (from the open of 31st March).
Potential outside week and bullish potential for TPGEntry conditions:
(i) higher share price for ASX:TPG above the level of the potential outside week noted on 10th April (i.e.: above the level of $4.23).
Stop loss for the trade would be:
(i) below the low of the outside week on 8th April (i.e.: below $3.94), should the trade activate.
Regis Possible 3x in the next 5 yearsG'day,
Thanks for viewing. I was engaging in some speculation today about where potential growth could come from for Regis. I was doing it to compare them against my investment in Westgold; similar on gold ounces produced, market cap, AISC, and cash balance. But Regis doesn't publish a 3 year production outlook and Westgold has. So Westgold puts their 2028 production at 480,000 oz up from a 2026 guidance range of 345 - 385,000 oz (Regis forecast 350 - 380,000 oz).
One major difference is that Westgold has more locations, mines, and processing plants, and has a longer 'inventory' of MRE ounces.
My impression is that Westgold is seeking growth through prioritising higher grades, and mill expansion. Not so much appetite for big deals detected. They, recently spun-out assets when they had the cash balance to run them in-house. More of an 'iterative' growth and focussing strategy. I bought into that one, but felt they were handing the capital gains of the new entity to new shareholders as opposed to retaining that for existing shareholders. Maybe their plate is a bit full currently with all the locations and upgrades planned. Another clue was them mining a new underground using a contract mining company, as opposed to using in-house miners.
So this is pure speculation about the sources of future growth (and I have no connection to insiders if this actually happens). One potential source is a 100% takeover of the Tropicana mine - currently 30% owned. The 70% owner Anglogold has announced in late 2025 that they are exploring a sale, but no details have been released on timeline, terms, or discussions. Anglo sees their future elsewhere (overseas) and views Tropicana (and Sunrise Dam) is a 'tier two' asset(s) for them.
I have seen Greatland Resources do amazing things with Telfer, an asset that was 'end of life' and 'tier two' that they breathed decades of life back into within 18 months (it was acquired with less than one years worth of reserves in Dec 2024 in what might be the deal of the decade.. Do not count these big mines out (Tropicana has produced over 4Moz and Sunrise Dam over 8Moz).
Since Regis is currently a minority partner, you must admit they are a likely, if not the most likely, candidate to take over Tropicana. Who knows the asset any better? Anglo. If we put a tentative purchase price at AUD2B, that could easily be financed by 25% cash (AUD500m - Regis have over 1.1B in the bank), 25% stock, and 50% debt. If the debt interest rate is too steep, or the debt load too large, they could also partially finance by selling a stream of future production. If this deal gets done that would add 300,000 ounces a year (70% annual mine production) in a single deal and give them full control of the 9.5Mtpa processing plant.
Where else might production increases come from? Well, this is a low chance one... they could get McPillamy's back on track (it would take a few years after any potential approval to get mining however). They are currently challenging the previous decision in the courts while looking at a tailings dam redesign / relocation. The open-pit actually isn't affected by the previous decision, just the tailings dam (from my understanding). Look, they are working on it and trying their best. If successful (say within the next 5 - 7 years) that would mean they could add 185,000 - 235,000 ounces per year. McPillamy's currently is valued at $0 so ANY upside would be welcome and not priced into the current market cap. Nobody is backing them to get it up and running, but there is a non-zero chance of them finding a way back to production.
100% Tropicana 450,000oz (speculative)
Duketon 220-240,000oz
McPillamy's 185,000oz (speculative - relatively low chance)
Could mean a 850,000 ounce per annum production rate.
I invested recently because it is relatively undervalued vs peers. All I really know is that they are investing around A70-80m in grade control, step-out, and extensional drilling and will want to grow reserves and production. How, and if, they will be able to do that remain to be seen.
Anyway, that is my up-side case and why I doubled my holding. If the increases are more modest, they are still well placed.
This Copper play look priced for BuyersLast week, #AIS pulled back into a key level — former resistance from April 2024, now acting as support. This is a critical technical juncture and one that often marks the foundation for a shift in trend.
The weekly chart is starting to look constructive. While price may spend another week or so chopping around beneath the 200-day moving average, this kind of consolidation can help build the base for a stronger move.
If this level holds, the setup opens the door for a rally toward ~70c. Notably, that aligns cleanly with a doubling of last week’s low around 35c — a level that often acts as a psychological and technical magnet.
Of course, the risk remains if negative news emerges, but structurally this is a point where the company has an opportunity to stabilise operations and reset.
Watching for signs of strength from here.
Magmatic at key support. Let's get ready to rally!#MAG (Magmatic Resources)
MAG is once again sitting at long-term equal lows — now the fourth test of this level. Each revisit reinforces just how significant this support zone is.
What stands out this time is the momentum setup. The MACD is beginning to turn, suggesting a potential shift in trend just as price presses into this key base. When you combine repeated support with improving momentum, the probability of a move higher starts to build.
Short-term, a move toward ~0.044 looks achievable if buyers step in. Beyond that, a broader recovery could see price push toward ~0.064 — representing a potential ~115% upside from current levels.
As always, the level needs to hold. But with both structure and momentum aligning, this setup looks more compelling than previous tests.
One to watch closely.
Major Support Line reached for #SYRTaking a step back with a 3-week chart stretching all the way to 2012 — and the message is pretty clear.
Price has returned to the 2012 lows, marking the third major test of this level (previous touch was during the 2020 COVID sell-off). This is a significant long-term support zone, and repeated tests like this tend to matter.
What’s different this time is the backdrop.
SYR has just completed a substantial institutional and retail entitlement offer, putting fresh capital on the table. That gives the company breathing room to execute and stabilise operations — something that wasn’t as firmly in place during prior tests.
This is an ambitious setup, and it may take time to play out. The obvious risk remains: if this long-term support fails, price discovery likely moves lower.
That said, with the recent capital raise now in place, the probability of a sustained bounce or recovery looks higher than on previous visits to this level.
This is one to watch closely.
Get Bullish on Talga Group#TLG has been in a steady descent and today tapped into multiple historical lows — a zone that has previously provided support. This area is worth watching closely.
From here, the expectation is a recovery phase. The rally may not be immediate or as quick as the green zig-zag on the chart suggests, but the structure is building. An initial move into the 35–37c range looks reasonable, followed by a potential pullback toward ~31c before a stronger push higher.
If momentum builds, a final leg into ~47c comes into play. Notably, doubling today’s ~23.5c level lands right at 47c — aligning with prior highs from Jan 2026 and Dec 2025, reinforcing this level as a key target.
Patience may be required, but the setup is forming.
LTR – Breakout + Lithium Cycle Turning?ASX:LTR Liontown is moving.
Price has broken above the 2.20 area and is holding strong.
A higher low formed near support, showing the trend is improving.
Work has already started to expand Kathleen Valley.
The company is preparing for growth before the final decision.
Lithium prices are rising.
Demand from China is picking up.
Production is still ramping up.
This is not just recovery — it could be the start of a new cycle.
CSL Limited (ASX:CSL)One of the strongest “moat” businesses on the ASX because it operates in a niche of healthcare that is extremely difficult, expensive, and slow for competitors to replicate.
1. Plasma collection network (huge barrier to entry)
CSL is one of only a few global companies dominating plasma-derived therapies. Morningstar describes it as a highly consolidated oligopoly. A new competitor cannot easily “just enter” the market.
- Plasma medicines require human plasma donations
- CSL owns hundreds of plasma collection centres, especially in the US
Building this network takes:
- billions of dollars
- regulatory approvals
- years of donor relationships
- specialized manufacturing plants
Similar to:
- airports for airlines
- rail networks for trains
- payment rails for Visa/Mastercard
2. Regulatory and manufacturing complexity
CSL produces:
- immunoglobulins
- rare disease treatments
- vaccines
- plasma therapies
These products require:
- strict FDA/EMA approvals
- biologics manufacturing expertise
- quality control systems
- cold-chain logistics
Biotech manufacturing is much harder than normal pharmaceuticals.
Once hospitals trust a supplier, switching is risky.
3. Scale advantage
CSL’s massive scale gives:
- lower per-unit production costs
- better plasma sourcing
- stronger R&D funding
- global distribution
4. Recurring demand
Many CSL therapies are not optional:
- immune deficiencies
- bleeding disorders
- chronic illnesses
Patients often need ongoing treatment for life creating:
- sticky revenue
- defensive earnings
- resilience during recessions
-
5. Historically excellent capital allocation
For decades CSL was seen as:
- a consistent compounder
- high ROE business
- strong earnings grower
- world-class Australian company
Why the drop after 2020?
1). COVID disrupted plasma collection
CSL relies heavily on plasma donations, during COVID:
- fewer donors visited centres
- staffing shortages occurred
- logistics were disrupted
That reduced plasma supply and increased costs.
2). Costs surged post-COVID:
- labour costs rose
- donor compensation increased
- inflation hit operations
CSL’s margins declined materially after FY21.
3). Before 2020, CSL traded at premium valuations because investors viewed it as:
- ultra-defensive
- high growth
- recession-resistant
- at times it traded around 35–45x earnings
Metric 2020 Today
Share price ~A$340 peak ~A$140
P/E ~40–50x ~32x trailing
Sentiment “perfect compounder” skepticism/caution
Weekly chart showing a potential for 100% upside return.
XRO trend reversal Hi traders,
The Setup: Monthly Support Base
The monthly chart shows that XRO has returned to a massive structural support zone (the red line at $72.11) that dates back to 2019–2020. This "full circle" correction has reset the technicals, allowing for a long-term swing trade toward the 61.8% retracement level.
The Logic: After a 65% drop from the all-time highs, the stock is carving out a monthly bottom. The RSI (14) on your chart is sitting at 33.49, which is near historical "floor" levels for this asset.
The Goal: We are riding the recovery wave from the current oversold levels up to the Golden Pocket ($130.77 – $145.91), where sellers are expected to return.
Execution Parameters
Entry Strategy
The current price of $82.98 is a valid entry point for a long-term position, as it sits just above the primary monthly support. If you are looking for a "perfect" entry, any retest of the $72.00 – $75.00 range provides an even better risk-adjusted opportunity.
Risk Management (Stop Loss)
The protective stop should be placed at $66.50. This is below the recent 52-week low and the structural red line. A monthly close below this level would signal that the macro uptrend has completely failed.
Take Profit Targets
Primary Target (The Golden Pocket): $130.77. This is the 0.5 Fibonacci level and the start of the "Golden Pocket" (between 0.5 and 0.618). Your "checkered flag" on the chart is placed exactly here.
Secondary Target: $145.91. The 0.618 Fibonacci level, which often acts as the final exhaustion point for a corrective rally.
Market Context (April 2026)
Earnings Catalyst: Xero is scheduled to report its FY26 Full Year Results on May 13, 2026. The market is currently pricing in a 22% growth in earnings. A positive surprise here could be the engine that starts the move toward your $130 target.
Valuation Reset: With the P/E ratio having compressed significantly during the 2026 tech sell-off, XRO is no longer just a "growth at any price" play; it’s becoming a "value-growth" hybrid, which attracts institutional buyers at these monthly support levels.
Risk/Reward Summary
Risk: ~$16.48 per share (from an $82.98 entry).
Reward: ~$47.79 per share (to the $130.77 target).
R/R Ratio: 1:2.9
On a monthly timeframe, this is a "patience play." You are looking for a multi-month recovery rather than a quick scalp.