Long
Long
 Long
Long
 Long
Long
 Long
Long
 Long
Long
 Long
Long
 Long
Long
 Long
Long
Manuka Resources (ASX: MKR) – Australia’s only near-term silver Manuka Resources is positioning itself as the only near-term silver producer on the ASX. The company’s Wonawinta Mine in New South Wales is fully permitted and infrastructure-ready, with a confirmed 10-year mine life and planned output of 13.2 Moz silver.
At current silver prices above A$70/oz, and an AISC of around A$31/oz, the project has one of the highest operating margins in the sector. Metallurgical issues from previous operations have been resolved through a new log washer, clearing the way for restart.
Manuka recently restructured its debt, replacing a Hong Kong lender with a consortium of existing shareholders — significantly improving financial flexibility. A binding term sheet with non-bank lenders is now in place to fund the restart, targeting first production and cashflow in Q1 2026.
Additional leverage comes from the Mount Boppy gold project (feed-ready ore) and the large-scale Taranaki vanadium–titanium–iron sands project in New Zealand, which could become a future growth pillar.
With financing near completion and silver momentum building, Manuka stands as a high-leverage, near-term play on rising silver prices.
Please, do your own research!  Long
Long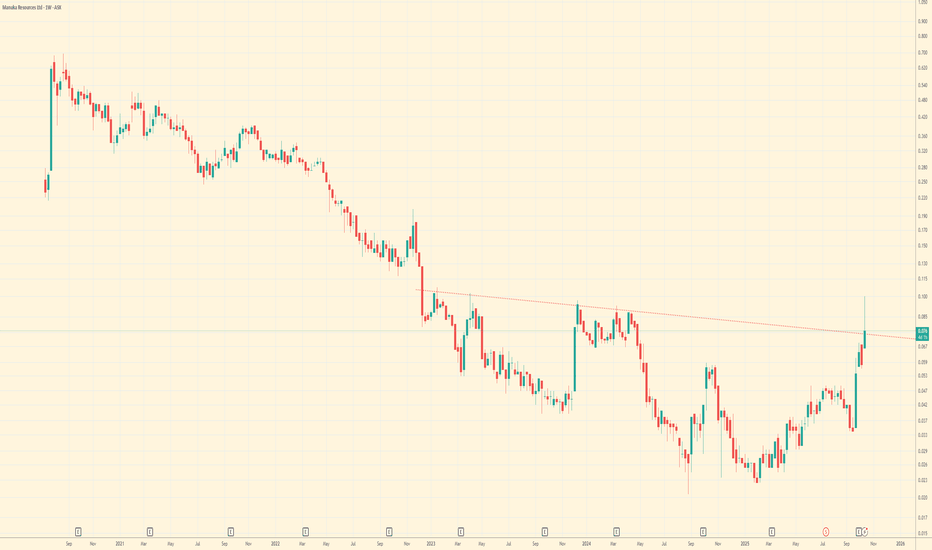
 Long
Long
 Long
Long
 Short
Short
 Long
Long
 Long
Long
 Long
Long
 Long
Long
 Long
Long
 Long
Long
APZ (Australia) - The Affordable Housing Trend SetterAspen Group has had a really solid run over the last year, putting on a gain of roughly 140% . Based in Australia, they operate in the affordable accommodation sector, managing residential communities, retirement villages, and holiday parks. It isn’t the flashiest business model, but the trend has been incredibly consistent. They have quite a few places that specialise in over 55 living with less than $90k annual salaries and with Australia's rapidly aging population and some of the highest real estate prices in the world, these guys are doing pretty well with lots of demand now and into the future.
Fundamentally, this momentum is being driven by the tight housing market down here. There is a genuine shortage of affordable options, and Aspen fills that gap nicely with lower-cost rentals and homes. Revenue and earnings have generally tracked well because the demand is so sticky.
Technically, the chart structure is very clean. You can see it trading inside a well-defined rising channel. The price has pulled back slightly but is holding up well above the trend support even with todays pullback - caused by the overall market dropping on Greenland tensions. The RSI has cooled down to around 55, which resets the momentum without signaling a reversal. The MACD is flat, which suggests the selling pressure is minimal.
Need to make sure it heads back up before any entry, but certainly might be worth a watch.
..................................................
PLEASE NOTE: Nothing I post is trading advice. All investing involves risk, and past performance doesn’t predict future results. Trends can and do end. For 2026 , my goal is to try and post one new asset each day. Something outside the usual gold, silver, BTC, or big tech names. I like to find stocks worldwide showing steady trends with some good gains, a recent pullback, and signs of renewed strength. I don’t necessarily hold positions in these. They are simply companies I find interesting at the time of posting. I’ll often revisit them within a week to see how they went and share any updates. If you enjoy these posts, please BOOST and FOLLOW ME to discover more under-the-radar stocks and businesses from around the world.
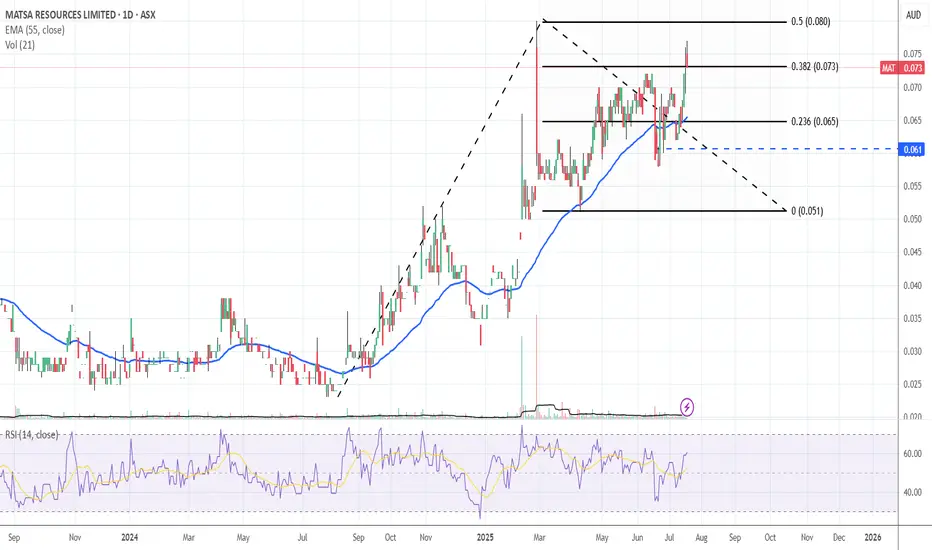
.................................................. My Target for MATSA is 10x within 2 yearsHi, thanks for viewing. I just added another 12% to my MATSA position today. I'm not ruling out adding more at this stage, but for now I'm quite happy.
My valuation of Matsa is simply very different to the market presently, maybe I can get some comments and discussion going.
A few months they released a forecast for free cashflow from their Devon open-pit mining operations that is using a third-party mining Company and toll milling. This was in their RIU presentation in May 2025. They are expecting 50,000 ounces of gold at 4.6g/t over 18 months. At AUD5000/oz they project free cashflow at AUD95.5 million. Gold today sits at AUD5165/oz / USD3365 and appears to have strong underlying support. Goldman Sachs is projecting USD4000/oz by mid-year 2026, so in this environment of tail-winds for gold it is difficult to see the Devon open-pit returning less than AUD100mil, in all likelihood it will be substantially more.
At 95m over 18 months is AUD5,277,777 per month or AUD63.33mil in 12 months. If the Company was valued at 7.5 times *free cashflow* (a relatively normal valuation in mining - low-side I use a multiple of 5 and high side I use 10) this would potentially put the Market Cap of Matsa at $475mil. Roughly, 475m/ current market cap of 56.2m = 8.45 times upside.
This is before considering the sale of the vast majority of their Lake Carey project to Anglo Gold. That deal has had Anglo pay 5m in deposits, has already gone unconditional. There are two more deposit payments of 1.5m coming, but the final decision has not been made on the deal i.e. the exercise price hasn't been 'locked in.' At (1.875 times the gold price) x 936,000 ounces = an additional payment of AUD90,645,750 using todays gold price (plus an additional 'up to' AUD20mil for additional ounces discovered on the tenement (no time limit).
Potentially, another 93m will come in from the Anglo deal. How do I adjust my valuation to account for this influx in free cash? Serious question. Absolute worst case scenario is that zero multiple applies (as it isn't actually earnings from operations), so my projected market cap of $475m would just add an additional 93m = 568m / 56.2m = 10.1 upside for Matsa over the next 18 to 24 months.
I feel that Anglo is more likely than not to finalise the sale, and do so well within the 18 month window (better to exercise at USD3300 gold than at USD4000 gold - better for Anglo).
The only thing that concerns me is that doesn't leave Matsa with much in the pipeline after Devon is depleted. Fortitude North (retained by Matsa) is yet to be defined as an underground resource - despite some rather interesting intercepts. There do appear to be a number of high-grade intercepts adjacent to the Devon pit, with dirt up to 60g/ton just to the north-west and 5g/ton dirt north-east and east of the pit shell. Definite potential for Devon to be expanded. Will it be expanded and by how much is unknown at this stage. However, they appear to be a small resourceful Company that is very good at identifying and developing drilling targets. They will be able to do a lot more when cashed up vs now. So, I am investing for the near-term, with potential for it to become a long-term hold.
Thanks for taking the time to read all that. Maybe you get a sense of my disbelief of how cheap Matsa is. Everyone is apparently waiting until the last minute to buy when the big announcement is released. I'm just buying while it is crazy cheap. Best of luck everyone.  Long
Long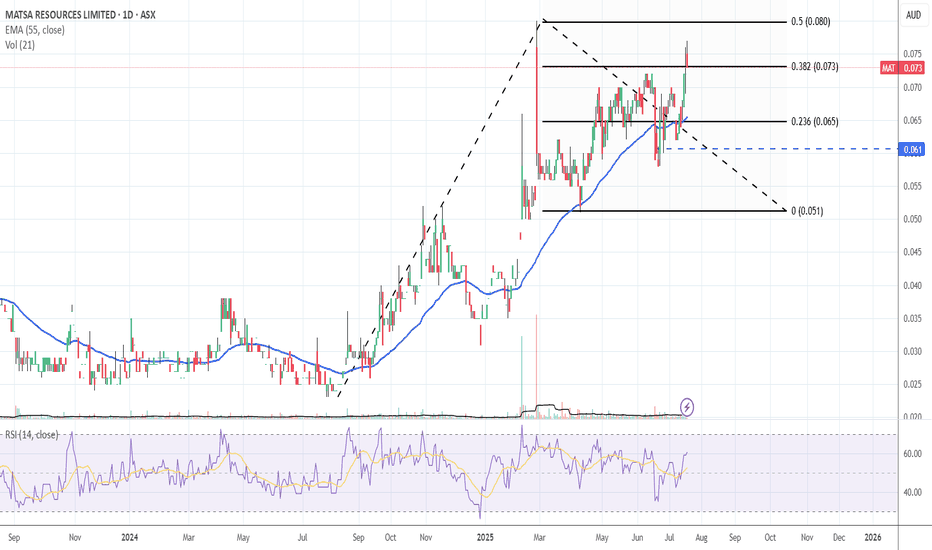
 Long
Long
 Long
Long