Long
Long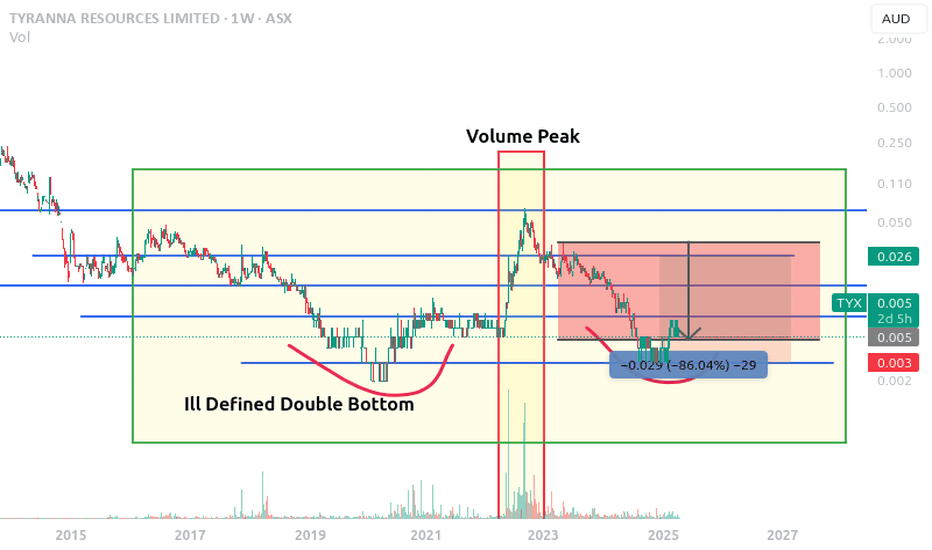
XAM.ASX - Double Bottom, now a Triangle/Flag. This looks like a very promising setup. I should note, it is worth zooming out on this chart to see the full view of it because the down sloping trend line has a lot to play in this setup.
The double bottom has passed which is a reversal pattern, and the Triangle has now come up which is a continuation pattern. It is important to note that both of the chart patterns are of similar size which helps to validate the move. With the Triangle we are now waiting to see if it crosses the down sloping trendline. If we get this happening, it is likely we will get a pop to 0.083, and a retest of the trendline and the current resistance level. If the retest only goes as far as the trendline that will be very bullish, however we will keep our expectations tempered.
You could start accumulating here, but I'd rather wait to derisk and see if it can break and hold 0.065 and start buying there, or of course, buy some now and buy some more later. Up to you. The stop level is 0.047, and the initial target is 0.165. That makes a 25% risk for a 150% gain.  Long
Long
 Long
Long
 Long
Long
 Short
Short
 Long
Long
 Long
Long
Coronado Global Resources: Rise and Fall of a Coal PlayerASX:CRN AMEX:COAL PSE:COAL BSE:COAL1!
Coronado Global Resources (ASX:CRN) is an Australian company specializing in metallurgical coal for the steel industry. With assets in Australia and the USA, it holds a notable position in the market. But is it worth investing in now? Let’s find out.
Financial Performance for the First Half of 2024
• Revenue: $1.3 billion
• Net Profit: $16 million
• EBITDA: $135 million
• Net Debt: Only $5 million
Low debt levels and stable cash flow ($63 million for the half-year) are strengths of the company in a challenging industry.
Stocks: From Triumph to Fall
Since its IPO in 2018, when Coronado raised $500 million, the stock price has dropped from $1.50–2.50 to 26 cents. Main reasons:
• Decline in coal prices in 2024
• Collapse of the deal with Seven (Sweden)
• Global disruptions such as COVID-19
Some believe the drop is excessive and expect a recovery to $1.50–2.50.
Challenges on the Horizon
• Coal Prices: Fitch forecasts $120/ton in 2025
• Technical Issues: Failures at Curragh increase costs
• Taxes: Rising levies in Queensland squeeze margins
Growth Prospects
Coronado is not giving up:
• New Mammoth mine (launch in December 2024)
• Expansion of Buchanan in the USA
• 300 million tons of reserves in the Bowen Basin - enough for more than 20 years
Plus diversified markets (China, USA, Japan).
Outlook for Coal Demand and Growth
Despite tightening environmental regulations and the global shift to renewable energy sources, which are pressuring thermal coal, the prospects for metallurgical coal remain more resilient. This type of coal, Coronado’s specialty, is indispensable in steel production, and demand for it is likely to persist over the next 5–10 years, especially in Asia (e.g., China and Japan), where metallurgy remains a key industry. Infrastructure growth in developing economies supports this trend, and the lack of large-scale alternatives to coking coal strengthens its position. With high-quality reserves and plans to open new mines like Mammoth, Coronado is well-positioned to meet this demand. However, coal price volatility and potential technological breakthroughs in steelmaking could pose risks, requiring careful monitoring.
Is It Worth Investing?
Pros:
• Low debt and strong balance sheet
• Steady demand for metallurgical coal in the steel industry
• Price at 26 cents promises 5–10x growth potential
Cons:
• Technical analysis shows a downtrend
• Coal price volatility
Conclusion
Coronado is a risky but potentially profitable bet. Financial stability and new projects inspire optimism, but the coal market is fickle. For experienced investors, this could be an entry point.  Long
Long
 Long
Long
 Long
Long
 Long
Long
3DP possible multibagger opportunityThis Chart uses EMA and an untraditional indicator the Darvas Box (100). I've personally found that Darvas Box(100) is a good entry filter. Enter when the price is within the box, preferably the lowest quarter of the box. Do not enter if the price is below the box. All the of the biggest runs start with SP being above the Darvas Box - However SP isn't guaranteed to run every time it is above the box.
Over the past 6 - 9 months 3DP has broken it's four year retracement and SP appears to be breaking out towards the upside.
The 50day EMA has just passed through the Darvas Box (100day) top. As highlighted - the last occurrence was mid 2020 which saw a 10x growth over the course of a year.
Current SP as posting on 30th March 2024 is a 0.084 SP has a potential to retrace to the 200day EMA 0.06 or further to the bottom darvas box (100) line which is at 0.04
A high level summary of who Pointerra are - 'Pointerra Limited is an Australia-based geospatial technology company. The Company is focused on the global commercialization of its 3D technology solution to support digital asset management activities across a range of sectors, including civil infrastructure, mining, oil and gas, architecture, engineering and construction, and others. Its cloud-based platform, Pointerra3D, is an end-to-end solution that stores, processes, manages, analyzes, extracts, visualizes, and shares the insights from 3D data. Its products include Pointerra3D CORE, Pointerra3D ANALYTICS and Pointerra3D ANSWERS. Pointerra3D CORE provides a common data environment where organizations can visualize different data types in a unified way and then store, manage and share them in a flexible way. Pointerra3D ANALYTICS creates a digital twin to enable intelligent analysis of physical assets. Pointerra3D ANSWERS delivers predictive insights that enable definitive answers to physical asset management questions.'
With Cash Receipts of $4.243M, Net Cash from Operating Activities of $1.447M, and a Cash balance of $4.6M, the company’s performance is clearly on track.
The total outgoing cash for the latest 3DP Quarterly report was $2.796M, which is just below the $2.855M average for FY 23/24.
This suggests that the cash outflow has returned closer to the average, especially after the higher outflows in the July to September 2024 quarter.
The substantial net cash inflows highlight the strong profitability of the business, particularly when higher cash receipts and revenue levels are achieved.
Ian Olsen and the management team have consistently emphasized that they are "not unhappy" with Finola Burke's (RAAS) projections. For FY 24/25, the forecast figures are as follows:
Revenue: $13.8M
GP: $12.7M
EBITDA: $2.19M
NPAT: $2.15M
EPS: $0.27
PER: 18
With a strong first half in FY 24/25 (cash receipts of $7.32M for the first 6 months), several already secured contracts, and numerous opportunities across Pointerra's six target sectors, these projections now seem well within reach.
I warrant that the information created and published by myself on TradingView is not prohibited, doesn't constitute investment advice, and isn't created solely for qualified investors.
 Long
Long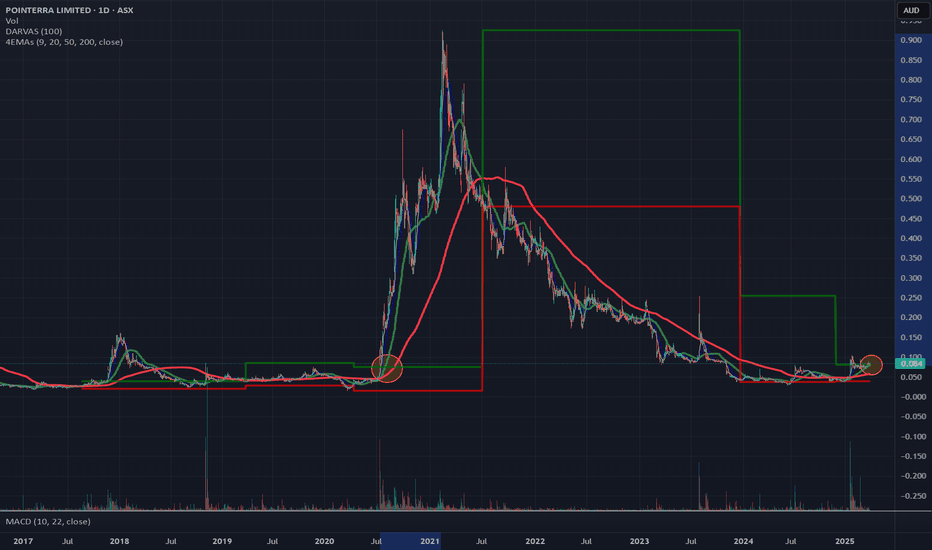
 Long
Long
Kaiser Reef Ltd - I'm Hyper bullish on thisShowed this to a friend and he said, "oh a small cap?"
Yes, somehow this is still a small-cap. Luckily for me. I have taken my position. If the price stays depressed over the coming weeks and months I will definitely be adding. No technical analysis, all fundamental and all of the fundamentals sound great to me (I am not in the Company and am definitely not a shill - not a paid one anyway :).
Firstly, the market cap is only AUD41.7m today. Crazy. Why crazy?
- They have AUD23 million on hand. So, take that off their market cap and their total operation is only valued at AUD18.7 mil.
- So what do you get for that? You get two gold processing plants (one in Vic and one in Tasmania). Together they have over 1500 tons per day processing capacity. I just read about a mine in Peru that got an estimate of USD89 mil for a 1500 tons per day gold processing capacity. Obviously, that is more remote. But even if the cost was only 33% of that (USD30 mil), it would still be more than the current Market Cap of Kaiser. Also, permitting, environmental approvals? Could take several years to install a plant elsewhere. Kaiser's are permitted and producing gold dore bars now.
- You get three highly prospective mines plus a few exploration projects (one that I want to see more about in the future; it is a gravity low, that is next to a magnetic high, on top of the gravity low at the very center is an historic gold mine. There is likely more gold there, how much? Will have to wait a few years to find out more about that one).
- All three mines (Henty, A1, and Maldon) are very high grade - A1 averaged 25 grams of gold per ton historically and they are commencing mining of high-grade ore this year after years of processing secondary grade ore.
- -Maldon reserves will be established over time. Maldon's historic production was 1.7Moz at an average of 28g / ton (including 300,000 ounces at 187g/ton AVERAGE from Nuggety Mine!). They are already compiling some really attractive drilling samples to establish reserves and extend the strikes. I am very interested to hear what they find underneath the historic workings of Nuggety Mine. There is underground infrastructure in place, but some work is needed to get it into production. ETA... not sure. Comes with a 120,000 ton/ pa producing production mill.
- Henty (newly acquired in March 2025) historic production of 1.9Moz averaging 8.9g / ton. Henty produced just under 25,000 ounces of gold in 2024 (avg grade 4g/ton). Additional exploration and expansion planned. Comes with its own 330,000 ton / pa producing production mill.
- If they even get both mills up to 50% capacity, with low-grade ore, this stock is going way way up. Back of the envelope using very conservative numbers: (capacity 550,000 t/pa / 2 = 275,000ton/pa x 4g per ton = 1,100,000 grams / 31.103 (grams per troy ounce) = 35,366 ounces pa). 35,366 ounces at $4800 an ounce is 169.75m gross revenue. Maybe a 15% net profit percentage (pretty conservative in this environment where Goldman Sachs just upgraded their target for gold in 2025 to USD3300/oz) = 25.464m pa net. If they have a PE ratio of 20 the market cap would be AUD509.275m which is 12.2 times higher than the current Market Cap. That is without any acquisitions, any gold price rises, adding any additional gold reserves (which they will add soon). If they only net 10% net profit the Market Cap should (at a minimum expand to AUD339.5m or 8.1 times the current Market Cap. 36,000 ounces is unachievable? That is the target the exec team set for the Company in 2025... not 2027... but soon. That is even without Maldon in production.
Can nobody do math? Is nobody willing to take a risk on a very prospective looking operation? Some people will.
I also like the exec team. They seem to;
- Have a nose for a good deal,
- Are not about buying over-valued assets (like a lot of the gold mind mergers you hear about these days. Big players buying fully-priced mega-mines with huge debt leverage. They will never survive any price drops and will end up being sold off at fire-sale prices by creditors),
- They have a real sense of urgency in getting things moving. Buying working assets at fire-sale prices, with a near-term plan (that is tracking) to steadily improve production, cash-flow, mine grades, mine life etc.
Anyway, I am going on. Do your own research. I shouldn't be writing this. It may mean I cant add much more to my position at low prices. I'm having some luck with gold miners - check out New talisman Gold on NZX (I still think it will go up 5 x from todays price when they start steady production).
 Long
Long
 Long
Long
Long 
Long 
 Long
Long
 Long
Long