• Products
  • Community
  • Markets
  • Brokers
  • More
Get started
  • Markets
  • /Australia
  • /Stocks
  • /Ideas
$CBA in a Strong Uptrend: Long at $162!Commonwealth Bank of Australia ( ASX:CBA ) is showing a “Strong Uptrend” on a 1-week chart. 📈 We bought at $126.49 and sold at $159.24 previously. Now at $162.98, we’re in a long position at $162. With a Trend Score of 8/8 and 100% signal alignment, the projected price is $166.2 ( +1.1% ), supported by bullish RSI but bearish MACD. How to Trade This Setup: • Hold the Trend: The uptrend is strong with high volume—hold the long position from $10629 for now. • Set Targets: Aim for Resistanc
ASX:CBALong
by StockMarketInsights77
1
AGL - Bull pending?Are there bulls lurking here ahead of potential rate cuts? Our Bullfinder-official Team has identified a potential opportunity within ASX:AGL If price can hold above the $10.00 mark, there may be potential for a re-rating of momentum to 'bullish'. We would like to note however that below ~$10.00 significant bearish continuation risk comes into play. We're inspired to bring you the latest developments across worldwide markets, helping you look in the right place, at the right time. Thank
ASX:AGLLong
by The-Contrarians-Compass
AMP - Set for a comeback?After a troublesome decade, is AMP Limited set for a recovery? Our Bullfinder-official Team has identified a potential opportunity within ASX:AMP If price can hold above the $1.220 mark, there may be potential for a re-rating of momentum to 'bullish'. We would like to note however that below ~$1.220 significant bearish continuation risk comes into play. We're inspired to bring you the latest developments across worldwide markets, helping you look in the right place, at the right time. Th
ASX:AMPLong
by The-Contrarians-Compass
Finer Market Points: ASX Top 10 Momentum Stocks: 29 Apr 2025AMEX:ASM LSE:KNB NYSE:MEI ASX:NTU NASDAQ:ADN GETTEX:TKM ASX:RNU NASDAQ:ZEO ASX:WA8 ASX:DRO Momentum leading shares are the market's best performers today. They are the fastest-growing shares on the ASX over the last 90 days. These companies can't get to be leaders without first appearing on our Launch Pad list. The Launch Pad List is shared on Thursdays and the video interview published after market close on Fridays. Today's ASX's Top 10 Quarterly Momentum Stocks are: Australi
ASX:DRO
by ch886
Finer Market Points: ASX Top 10 Momentum Stocks: 28 Apr 2025 NYSE:NMR AMEX:ASM NYSE:SRL LSE:KNB GETTEX:TKM ASX:NTU NASDAQ:ZEO ASX:DRO NYSE:MEI ASX:WA8 Momentum leading shares are the market's best performers today. They are the fastest-growing shares on the ASX over the last 90 days. These companies can't get to be leaders without first appearing on our Launch Pad list. The Launch Pad List is shared on Thursdays and the video interview published after market close on Fridays. Today's ASX's Top 10 Quarterly Momentum Stocks are: Native Mi
ASX:COG
by ch886
Trade Idea: Supply Network Limited (ASX: SNL)SNL has demonstrated impressive resilience, staging a sharp V-shaped recovery and returning to all-time highs despite broader market uncertainties. The stock’s ability to maintain strength through news-driven volatility highlights robust underlying momentum. With overall market volatility currently at manageable levels, a small initial position is warranted to participate in the ongoing uptrend, while maintaining disciplined risk management. Entry Strategy: Initiate a small long position at cu
ASX:SNLLong
by Gihanhemachandra
PDI + inverse H+SPDI - weekly line chart. Inverse H + S pattern formed and now has confirmed a breakout. Not surprising that the gold price has helped this along. KISS is the key. Keep it simple. no need to excessive indicators. Just look at the price action. Line charts are good as they cut out all the noise and smooths out price action.
ASX:PDILong
by IronBuddha
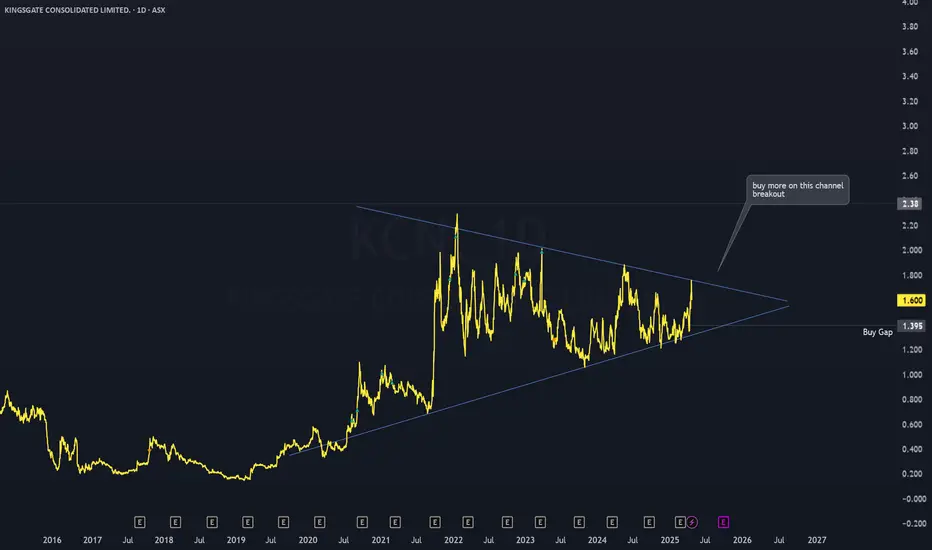
awsome setupweekly line chart of KCN. Triangle setup looks nice and well formed. If the breakout happens to the upside expect a massive rally higher as this baby has been in a congestion zone for 5 years now. The gold price will move higher in 2025 as the USD will be debased to maintain the illusion of growth. Learn the history of the Mississippi bubble. The piper will be paid.
ASX:KCNLong
by IronBuddha
2
Potential outside week and bullish potential for SPREntry conditions: (i) higher share price for ASX:SPR above the level of the potential outside week noted on 28th March (i.e.: above the level of $1.955). Stop loss for the trade would be: (i) below the low of the outside week on 25th March (i.e.: below $1.685), should the trade activate.
SLong
by Ivory_Wolf
Updated
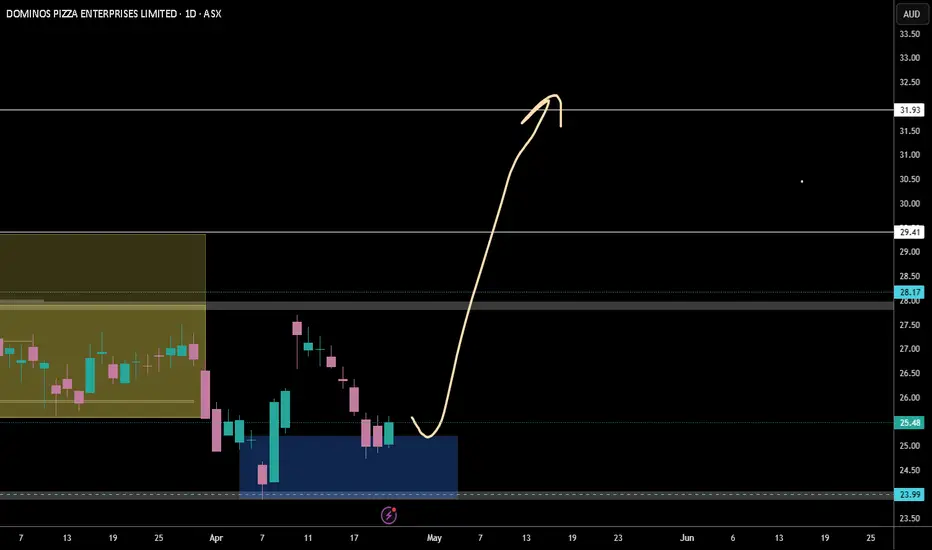
DMP long another unpublished TV forecast long from demand zone sl below
ASX:DMPLong
by Permaculture
Finer Market Points: ASX Top 10 Momentum Stocks: 23 Apr 2025 NYSE:NMR LSE:KNB NASDAQ:REE ASX:NTU AMEX:ASM NASDAQ:TRS ASX:DRO ASX:BGD NYSE:MEI LSE:CEL Momentum leading shares are the market's best performers today. They are the fastest-growing shares on the ASX over the last 90 days. These companies can't get to be leaders without first appearing on our Launch Pad list. The Launch Pad List is shared on Thursdays and the video interview published after market close on Fridays. Today's ASX's Top 10 Quarterly Momentum Stocks are: Native Min
ASX:NMR
by ch886
McMillan Shakespeare buy zoneJust looking around the equity markets for high dividend stocks, I found this one doing a correction. Found a convergent zone (wave (C) measuring 100% of wave (A) and a normal five wave extension in wave (C) as well as bullish RSI divergence indicating that a change in price direction is inbound. Recent ratings upgrade and $20+ targets from analysts in recent news. I'll be buying mainly to get the 10%+ dividends, but also to get some capital gains. No sell side target as yet. Medium term hold.
ASX:MMSLong
by flyinkiwi10
Updated
2
WC8... 1x potential!!WC8 completed the down trend at the angle of 360, it's expected to correct to 270 angle at 0.36 ...... let's see when it would acheive this target....
ASX:WC8Long
by B7r88
Bullish potential detected for INGEntry conditions: (i) higher share price for ASX:ING along with swing up of indicators such as DMI/RSI, and (ii) observation of market reaction at the resistance level at $3.30 (from the open of 18th February) after closing above 50 day and 200 day MAs. Stop loss for the trade would be, dependent on risk tolerance: (i) a close below the 200 day moving average (currently $3.22), or (ii) below the support level from the open of 21st February (i.e.: below $3.19).
ASX:INGLong
by Ivory_Wolf
Updated
PO3 setup on SYRLooking at a PO3 setup as shown in the diagram on the chart. Clear deviation below the trading range and appears to have backtested inside the range again. Looking for markup and distribution now if the PO3 is to play out.
ASX:SYRLong
by RB1988
TYX.ASX - Potential Double Bottom For A Nice Profit.This would be a nice little trade, though a little dangerous. You need to look at the longer term lead in trend to the chart and you will see there is a down sloping trendline into this double bottom. I say it is ill defined because that centre peak is deformed relative to the valleys. However, despite this, this trade has potential because of the volume spike I have drawn out. A lot of traders have entered into this trade and are down about 80% at the moment. If one is able to buy this stock ch
ASX:TYXLong
by MadButcherWA
XAM.ASX - Double Bottom, now a Triangle/Flag. This looks like a very promising setup. I should note, it is worth zooming out on this chart to see the full view of it because the down sloping trend line has a lot to play in this setup. The double bottom has passed which is a reversal pattern, and the Triangle has now come up which is a continuation pattern. It is important to note that both of the chart patterns are of similar size which helps to validate the move. With the Triangle we are now waiting to see if it crosses the down sloping t
XLong
by MadButcherWA
2
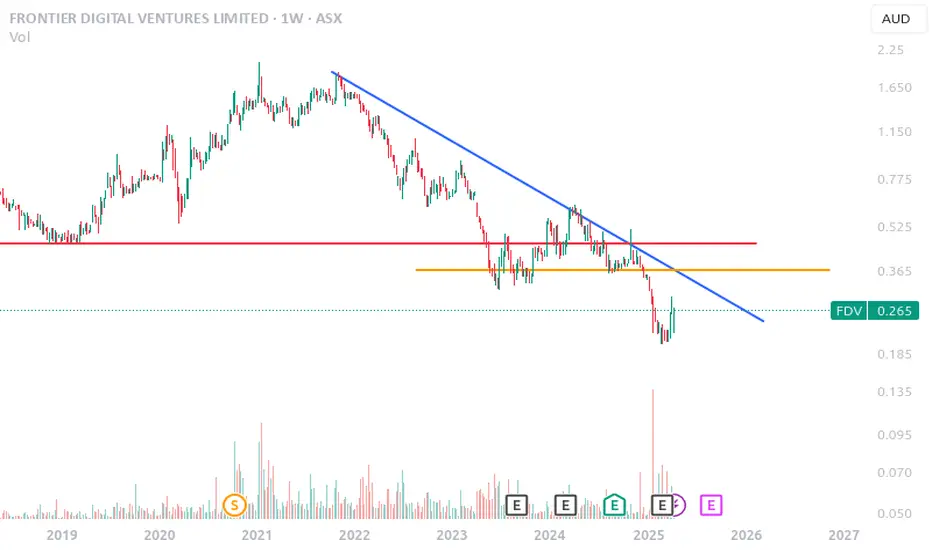
FDV.ASX - Trendline TradeNot really much to be said here, but this may develop into something. Sometimes I like to find setups like this that are quite "ripe" and sit on them. Pretty much what I will do here is leave this in my trading diary or on a watch list and just check on it once a week or once a month and see if it crosses that trendline and makes a nice reversal pattern.
ASX:FDV
by MadButcherWA
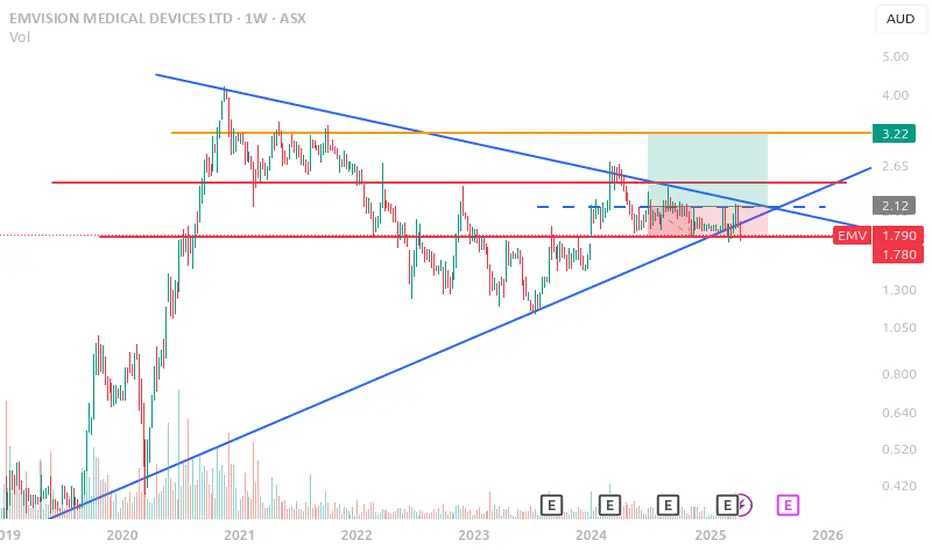
EMV.ASX - Large Accending TriangleTo be honest this chart looks weak, but I've seen charts like this with this kind of setup pop, so I might put it on a watchlist. The large triangle has caputured the trade with the lower bound trendline being far steep than the upper. This sort of indicates that there is a good amount of demand underneath this stock, however since about the start of 2024 it really looks to be a bit weaker. This is indicated by most of the price action being close to the lower blue support level, and the price b
ASX:EMVLong
by MadButcherWA
AGN.ASX in an Accending Triangle with Repeating PatternI like trading bio and pharma stocks. They trade very similar to small cap miners, but with their own little personalities. Anyway, a large triangle is here with the price coiling up against the 0.90 resistance level. There is that long term trendline that the price is trading up against that is holding the shape firmly. As we are coming to the tip of the triangle a decision point is reached. Will the price drop out below the trendline? Or will it pop above the resistance level? On top of this
ASX:AGNLong
by MadButcherWA
1
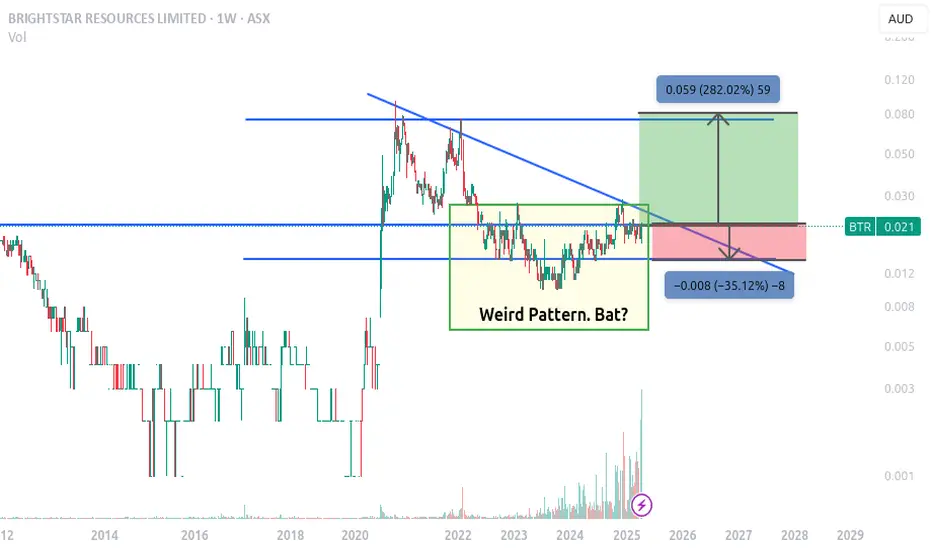
Strange pattern on BTRA really strange pattern I've not seen before on this chart, but there is definitely something about it. In any case, leading into this pattern back in 2021 we see a very sharp double top from which we can draw the trendline from. The pattern looks like some sort of reversal pattern as the price is holding to the resistance level at 0.021 and there is a huge amount of volume serving to hold this level as a bottom. Entry would be safe now, holding a stop loss at round number 0.015, which at 35% i
ASX:BTRLong
by MadButcherWA
Potential outside week and bearish potential for CAREntry conditions: (i) lower share price for ASX:CAR below the level of the potential outside week noted on 28th March (i.e.: $32.16). Stop loss for the trade would be: (i) above the swing high of 26th March (i.e.: above $34.05), should the trade activate.
ASX:CARShort
by Ivory_Wolf
Updated
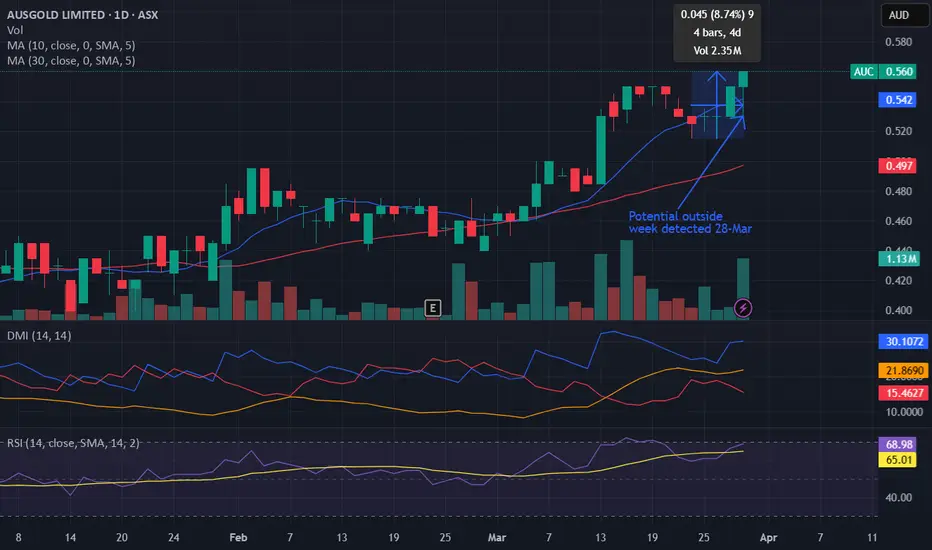
Potential outside week and bullish potential for AUCEntry conditions: (i) higher share price for ASX:AUC above the level of the potential outside week noted on 28th March (i.e.: above the level of $0.56). Stop loss for the trade would be: (i) below the low of the outside week on 26th March (i.e.: below $0.515), should the trade activate.
ASX:AUCLong
by Ivory_Wolf
Updated
1
SOL - 19 months RECTANGLE══════════════════════════════ Since 2014, my markets approach is to spot trading opportunities based solely on the development of CLASSICAL CHART PATTERNS 🤝Let’s learn and grow together 🤝 ══════════════════════════════ Hello Traders ✌ After a careful consideration I came to the conclusion that: - it is crucial to be quick in alerting you with all the opportunities I spot and often I don't post a good pattern because I don't have the opportunity to write down a proper didactical comment; - sin
ASX:SOLLong
by TheArtOfCharting
123456789101112131415161718192021222324252627282930313233343536373839404142
…999

Made by humans

Select market data provided by ICE Data Services. Select reference data provided by FactSet. Copyright © 2026 FactSet Research Systems Inc.Copyright © 2026, American Bankers Association. CUSIP Database provided by FactSet Research Systems Inc. All rights reserved. SEC filings and other documents provided by Quartr.© 2026 TradingView, Inc.

SOC 2 CompliantGDPR Compliant
More than a product
  • Supercharts
Screeners
  • Stocks
  • ETFs
  • Bonds
  • Crypto coins
  • CEX pairs
  • DEX pairs
  • Pine
Heatmaps
  • Stocks
  • ETFs
  • Crypto coins
Calendars
  • Economic
  • Earnings
  • Dividends
  • IPOs
More products
  • News Flow
  • Portfolios
  • Fundamental Graphs
  • Yield Curves
  • Options
  • Macro Maps
  • Pine Script®
  • MCP Server
Apps
  • Mobile
  • Desktop
Community
  • Social network
  • Wall of Love
  • Refer a friend
  • Creator program
  • House Rules
  • Moderators
Ideas
  • Trading
  • Education
  • Editors' picks
Pine Script
  • Indicators & strategies
  • Wizards
  • Freelancers
  • Marketplace
Tools & subscriptions
  • Features
  • Pricing
  • Market data
  • Gift plans
Trading
  • Overview
  • Brokers
  • Brokers comparison
  • The Leap
Special offers
  • CME Group futures
  • Eurex futures
  • US stocks bundle
About company
  • Who we are
  • Space mission
  • Blog
  • Help Center
  • Careers
  • Media kit
Merch
  • Tarot cards for traders
  • The C63 TradeTime
Policies & security
  • Terms of Use
  • Disclaimer
  • Privacy Policy
  • Cookies Policy
  • Accessibility Statement
  • Trust Center
  • Security tips
  • Bug Bounty program
  • Status page
Business solutions
  • Widgets
  • Charting libraries
  • Lightweight Charts™
  • Advanced Charts
  • Trading Platform
Growth opportunities
  • Advertising
  • Brokerage integration
  • Partner program
  • Education program
Community
  • Social network
  • Wall of Love
  • Refer a friend
  • Creator program
  • House Rules
  • Moderators
Ideas
  • Trading
  • Education
  • Editors' picks
Pine Script
  • Indicators & strategies
  • Wizards
  • Freelancers
  • Marketplace
Business solutions
  • Widgets
  • Charting libraries
  • Lightweight Charts™
  • Advanced Charts
  • Trading Platform
Growth opportunities
  • Advertising
  • Brokerage integration
  • Partner program
  • Education program
Look FirstLook First