Long
Long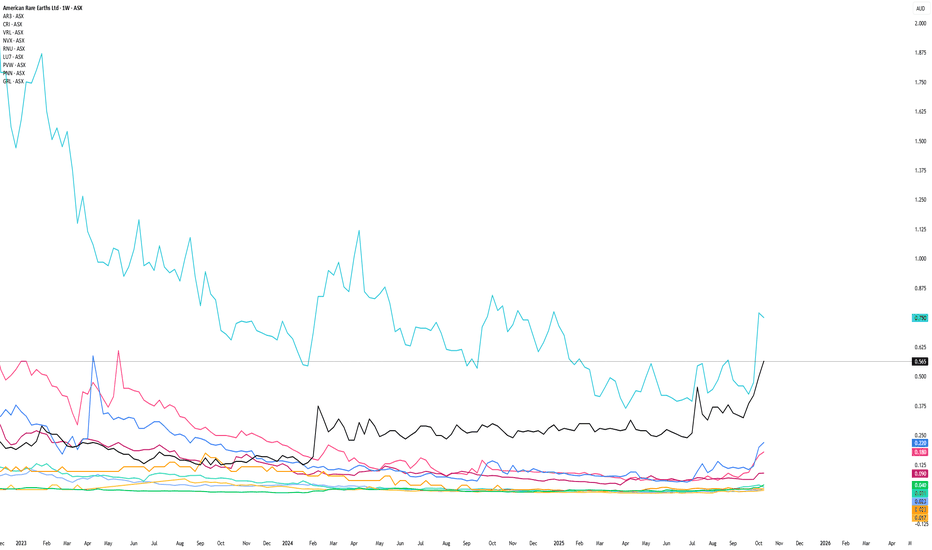
 Long
Long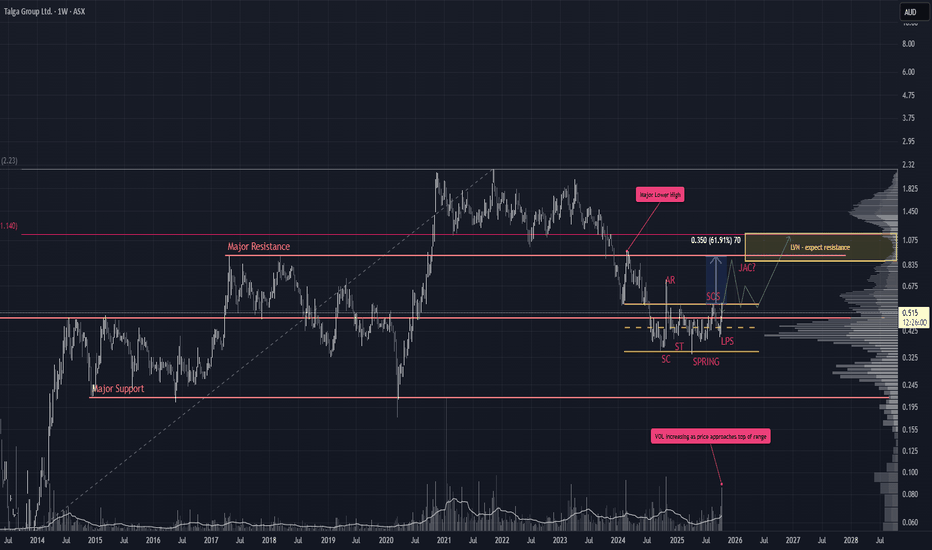
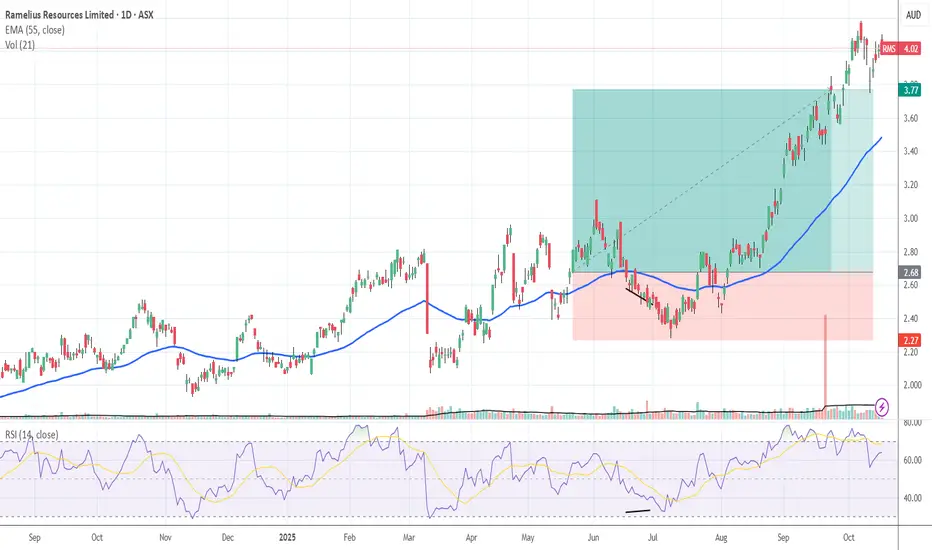
43% gain on Ramelius. This is why I sold.Thanks for viewing,
May 22nd to Oct 13th. It wasn't a trade - and I didn't have a stop-loss. Actually, I intended to hold for multiple years. This is why I exited.
- RBC Capital rated them "underperform," based on their projections of Ramelius gold production in 2026 to 2028.They think that production challenges have been understated and will lag even the early indicative lower production numbers for 2026 & 7 as can be seen in their most recent corporate presentations.
- They have delayed their production outlook/ forecast. This is seldom indicative of good news.
- Their production in FY 2025 was just over 300,000 ounces, but this is set to drop to the 200,000+ range for 2026 and 136,000+ in 2027 while they tail-off production at one mine and ramp-up another. ~30% to ~55% less production? No bueno! The "+" represents additional ounces added by Dilgaranga being developed and producing - how much and when is unknown. But I will be looking to re-enter sometime in 2027-8 when things look a little more certain. Their goal appears to be 500,000 ounces in 2030 at this stage. Quite a bit of uncertainty about how and when they will get there at this stage.
Actually, that is about it. Why should I hold a stock while it is predictably underperforming the other gold miners on the ASX 300? Especially, when I can buy back in later at a lower price. It is a great Company, has very low production AISC costs, and has acquired some very high-grade gold resources. When Dalgaranga comes online it will go gangbusters.  Short
Short
 Long
Long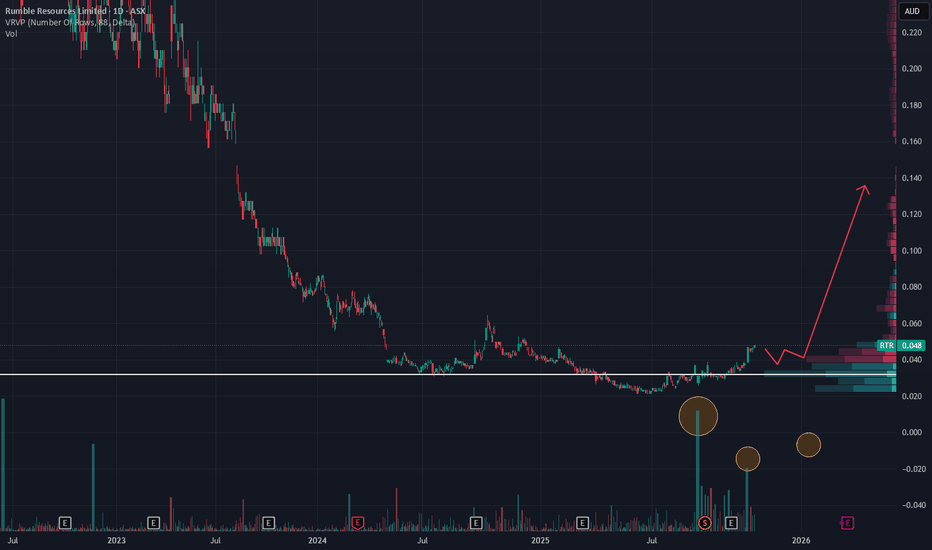
 Long
Long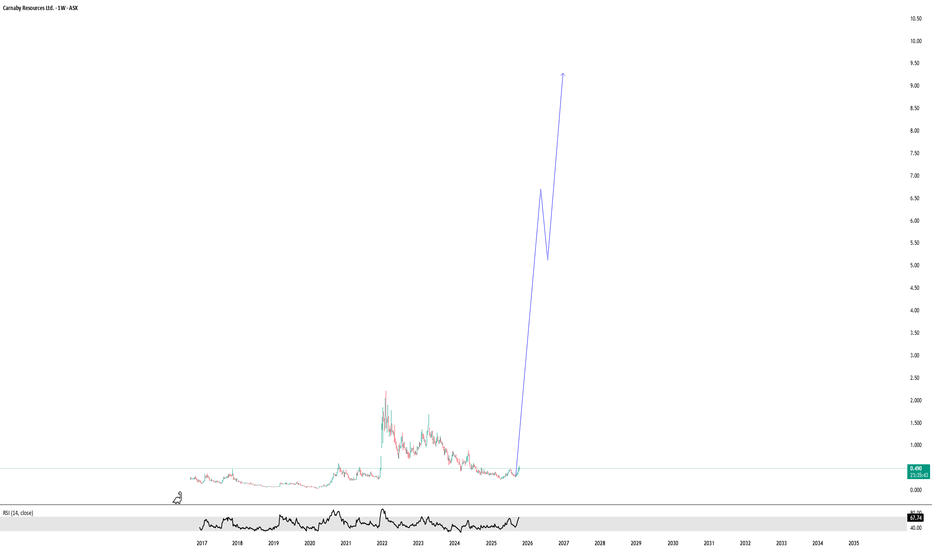
 Long
Long
 Long
Long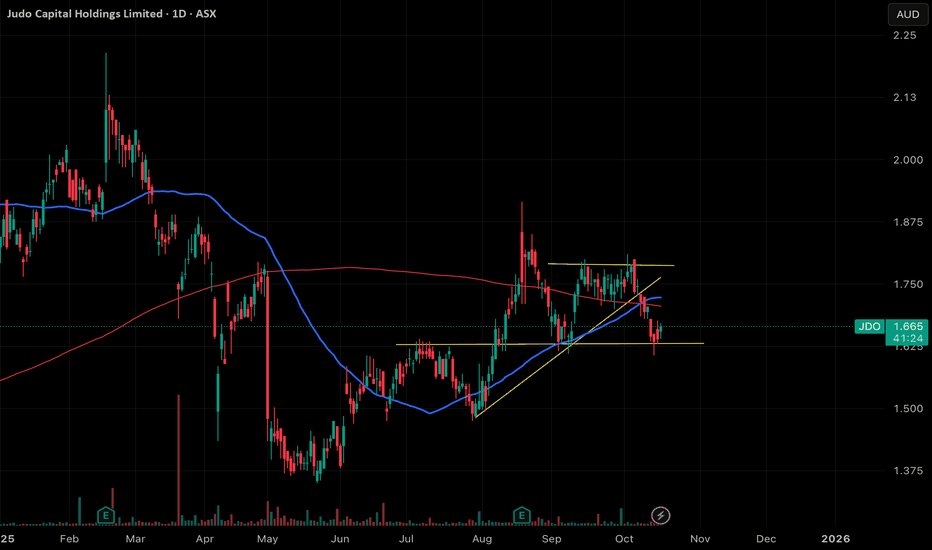
 Long
Long
 Long
Long
 Long
Long
 Long
Long
Rare Earth Play about to Moonshot!? American Rare EarthASX:ARR OTC:ARRNF OTC:AMRRY
Listen up, wannabe mooners.
American Rare Earths ( NYSE:ARR ), an Australian company, owns Wyoming Rare Inc, which holds the rights to mine the Halleck Creek rare earth site in Wyoming, USA ( aka one of the most mining-friendly states out there ).
Last year, they tried to spin off Wyoming Rare via SPAC and take it public… didn’t quite make it.
But if that plan comes back? We YOLO on Wyoming Rare. No hesitation.
Now here’s why it’s moon fuel:
China just dropped the hammer on rare earth exports . That’s right — they’re restricting shipments of the very materials needed for EVs, wind turbines, and every fancy green tech.
Since that move, U.S.-based rare earth stocks have been pamping hard. ARR, though? Still flying under the radar (relatively-speaking).
We’re basically staring at an un-pamped, home-grown rare earth play sitting on what could be one of the largest deposits in North America.
Here’s the juice straight from the company:
“The Halleck Creek Project, located on Wyoming State land northeast of Laramie, is a world-class rare earth deposit with a JORC-compliant resource of 2.63 billion tonnes, containing approximately 8.64 million tonnes of total rare earth oxides (TREO) — including high-value magnets like neodymium and praseodymium.”
If this thing gets the attention it deserves — or if Wyoming Rare gets that SPAC redo —
expect diamond hands and rocket emojis all over your feed. 🚀🌕
DYOR, but this might just be the next rare earth meme before the herd catches on.  Long
Long
 Long
Long
 Long
Long
 Long
Long
 Long
Long
 Long
Long
 Long
Long
GQG Approaching Strategic Area of InterestGQG has pulled back sharply from the $3.12 high and is now approaching a key Fair Value Gap (FVG) that warrants close tracking. While the probability of this zone holding is reduced due to excessive volume pressure, the setup still offers potential for a favorable risk-to-reward trade, especially if structure and timing align.
Why the FVG Still Matters
Price is testing a major support zone formed by previous highs.
The area sits within a Low Volume Node (LVN), which may act as a barrier to price acceptance.
Proximity to the yearly S1 pivot opens the door for a classic fakeout scenario. Price could spike below the FVG, trap late shorts, stop out longs, and then close back above the pivot.
Trade Scenarios (Early Framework) Still developing, these are preliminary overlays to add to watchlist.
Scenario 1 – Less Likely
Price prints and closes a high-volume bullish monthly candle that tags the Equilibrium of the FVG.
If confirmed, entry would be on the open of the next monthly candle.
Scenario 2 – More Likely
Price pushes down to the yearly S1 pivot, then prints a bullish reversal candle.
Entry would be on the open of the next candle, contingent on structure and volume confirmation.
Targets
Initial target: Macro 50% retracement projected from ATH to ATL.
If price breaks and closes above this level, we could begin mapping for new highs, but for now, we take it one leg at a time.
This isn’t a rush setup, it’s a structure-first, and just being patient.
 Long
Long
 Short
Short
Thoughts on AVM... is it over-valued?I'm glad you asked.
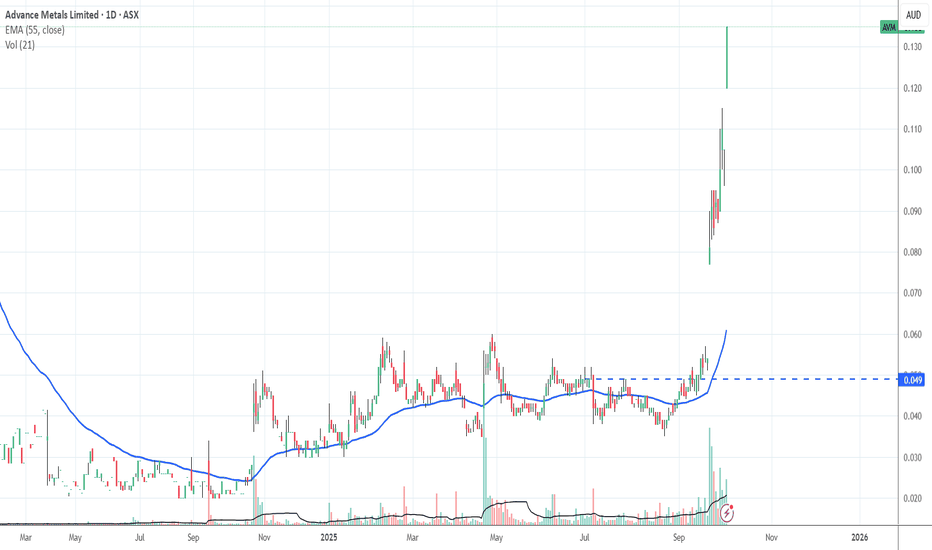
No, is the short answer. But there is a LOT of information yet to unfold, before this Company is a low risk purchase. Saying that, my average entry price of 0.495 is shown on the chart. While the price is depressed and there isn't any positive sentiment, and I am buying, I see no benefit in publishing my bullish viewpoint. I might want to buy more at a lower price, right. Well, I did buy quite a bit between mid-April and mid-August 2025. AVM has gone from about 3.7% of my portfolio to over 10% for a gain of 176%. So is it time to take some profits.
Well, #1 it is great how well silver has been performing, and there is a lot of attention now coming on Companies with an appreciable silver reserve. When I bought AVM it was clear (even at the silver prices then) that AVM was "un-loved" and un-appreciated. Relative to its ASX silver explorer/developers AVM was substantially under-valued. How undervalued? At the time AVM had around 45Moz silver foreign reserve at around 400Ageq grade for a Market Cap of around 8 to 12 million. So, relative to its peers, each established ounce in the ground was drastically cheaper. I worked out at one stage that vs Silver Mines that each AVM ounce had 5 times higher grade and each ounce valued a 1 / 7th the price per ounce. That appeared to be quite a mis-match.
But that isn't why I bought a boat-load of AVM shares. I viewed the Victorian gold exploration assets as fundamentally under-valued. In light of that, I saw the under-valued silver assets as essentially coming for free. Why do I see the Victorian asset as undervalued. Well look at the drilling results (so far they have only drilled out about 1% of their claim). But one drill result caught my attention;
11.7 meters at an average grade of 160.4 grams Au/ton (historic hole from 2021 I believe, from before they purchased the tenement).
That is a spectacular result and doesn't just hint that there is gold there, it SCREAMS it. Even huge Victorian developments like Southern Cross, started somewhere. I thought, there was a "non-zero" chance that AVM was onto a massive winner. Victoria is also improving as a mining jurisdiction, and other miners I follow have reported quite encouraging changes of late. They describe the state mining regulator as "motivated, accountable, and transparent." If, when, and how a mine will get built on AVM's tenement are completely unknown and will remain unknown for some years. But I was reading a LOT of drilling reports that had marginal results, like 1.2m at 2gpt at 250m depth or deeper. But 11.7m x 160.4gpt stuck in my brain. I could not understand why anyone would see a tiny Company with several million silver ounces and extremely prospective gold tenements wasn't valued an order of magnitude higher.
They also made a very cheap purchase of a closed gold/silver mine in Mexico more recently, to bring their silver assets up to over 100Moz. But still the market didn't really move. So, I kept buying. I think often, people need to be told when something is valuable, they can't recognise value when they see it. They need some sort of third-party confirmation. That came with analyst coverage and then a capital raise.
So, where is the "top." No idea, we will level-off and possibly even sell-off gradually, but as more drilling results come in and the silver and gold assets improve, the price will keep steadily marching up. If each AVM silver ounce in the ground becomes valued on a par with those in SVL's claims, it will increase AVM's value by 4x overnight. That is without even considering the future value of the gold claims. I will be following the news daily, but for me, AVM is a buy and hold on a multi-year basis. Considerable up-side remains in my view.  Long
Long